Abstract
Light-oxygen-voltage (LOV) domains function as blue light-inducible molecular switches. The photosensory LOV domains derived from plants and fungi have provided an indispensable tool for optogenetics. Here we develop a high-throughput screening system to efficiently improve switch-off kinetics of LOV domains. The present system is based on fluorescence imaging of thermal reversion of a flavin cofactor bound to LOV domains. We conducted multi site-directed random mutagenesis of seven amino acid residues surrounding the flavin cofactor of the second LOV domain derived from Avena sativa phototropin 1 (AsLOV2). The gene library was introduced into Escherichia coli cells. Then thermal reversion of AsLOV2 variants, respectively expressed in different bacterial colonies on agar plate, was imaged with a stereoscopic fluorescence microscope. Based on the mutagenesis and imaging-based screening, we isolated 12 different variants showing substantially faster thermal reversion kinetics than wild-type AsLOV2. Among them, AsLOV2-V416T exhibited thermal reversion with a time constant of 2.6 s, 21-fold faster than wild-type AsLOV2. With a slight modification of the present approach, we also have efficiently isolated 8 different decelerated variants, represented by AsLOV2-V416L that exhibited thermal reversion with a time constant of 4.3 × 10(3) s (78-fold slower than wild-type AsLOV2). The present approach based on fluorescence imaging of the thermal reversion of the flavin cofactor is generally applicable to a variety of blue light-inducible molecular switches and may provide a new opportunity for the development of molecular tools for emerging optogenetics.
🔬 Techniques
🧬 Organisms
💻 Software
🔬 Cell Lines
🏭 Microscope Brands
🧪 Reagent Suppliers
📷 Detectors
🎨 Filters
💻 Software Details
💾 Data Repositories
🏛️ Research Organizations (ROR)
Affiliated research institutions:
📋 Methods
Plasmid construction AsLOV2 used in the present study is the LOV2 domain derived from Avena sativa phototropin 1 (phototropin 1 404–560 ) (accession number: O49003 ). Synthesized cDNA encoding the wild-type AsLOV2 with mammalian codons was obtained from GenScript (Piscataway, NJ, USA), and subcloned into a bacterial expression vector pCold I DNA (Takara, Tokyo, Japan) at Hin dIII and Xba I sites. Protein expression and purification Wild-type AsLOV2 and its two variants, AsLOV2-V416T and AsLOV2-V416L, with an N-terminal six-residue histidine tag were expressed in Escherichia coli DH5α cells with the pCold I vector and cultured in 500 mL of a LB medium containing 100 µg/ml of ampicillin. The bacterial cells were grown at 37°C until they reached a density of approximately OD 600 = 0.5. Protein expression was induced by addition of isopropyl β- d -thiogalactoside (IPTG) at a final concentration of 0.1 mM following a temperature downshift from 37 to 15°C. The bacterial cells were cultured for 24 h following the induction and lysed by sonication. The histidine-tagged proteins were purified by TALON resin chromatography (Clontech, Palo Alto, CA). These protein samples were eluted with an imidazole solution (500 mM imidazole, 50 mM sodium phosphate, 300 mM NaCl, pH 7.0) and dialyzed against a solution (pH 7.5) containing 50 mM Tris HCl and 150 mM NaCl for 24 h. The samples were concentrated with an Amicon Ultra centrifugal filter device (Millipore, Bedford, MA, USA). Protein concentrations were determined by the Bradford method (Bio-Rad, Hercules, CA, USA) using BSA as a standard.
Show full methods section
Plasmid construction AsLOV2 used in the present study is the LOV2 domain derived from Avena sativa phototropin 1 (phototropin 1 404–560 ) (accession number: O49003 ). Synthesized cDNA encoding the wild-type AsLOV2 with mammalian codons was obtained from GenScript (Piscataway, NJ, USA), and subcloned into a bacterial expression vector pCold I DNA (Takara, Tokyo, Japan) at Hin dIII and Xba I sites. Protein expression and purification Wild-type AsLOV2 and its two variants, AsLOV2-V416T and AsLOV2-V416L, with an N-terminal six-residue histidine tag were expressed in Escherichia coli DH5α cells with the pCold I vector and cultured in 500 mL of a LB medium containing 100 µg/ml of ampicillin. The bacterial cells were grown at 37°C until they reached a density of approximately OD 600 = 0.5. Protein expression was induced by addition of isopropyl β- d -thiogalactoside (IPTG) at a final concentration of 0.1 mM following a temperature downshift from 37 to 15°C. The bacterial cells were cultured for 24 h following the induction and lysed by sonication. The histidine-tagged proteins were purified by TALON resin chromatography (Clontech, Palo Alto, CA). These protein samples were eluted with an imidazole solution (500 mM imidazole, 50 mM sodium phosphate, 300 mM NaCl, pH 7.0) and dialyzed against a solution (pH 7.5) containing 50 mM Tris HCl and 150 mM NaCl for 24 h. The samples were concentrated with an Amicon Ultra centrifugal filter device (Millipore, Bedford, MA, USA). Protein concentrations were determined by the Bradford method (Bio-Rad, Hercules, CA, USA) using BSA as a standard.
Spectral analysis
Absorption spectrometry was performed at room temperature using an Evolution Array spectrophotometer (Thermo Scientific, Waltham, MA, USA), which equips arrayed detectors for the simultaneous acquisition of full-spectrum data without scanning.
Fluorescence spectra of wild-type
AsLOV2 were determined at room temperature using an F-7000 spectrofluorometer (Hitachi High-Technologies, Tokyo, Japan). Fluorescence quantum yields ( φ ) of wild-type AsLOV2, AsLOV2-V416T and AsLOV2-V416L were determined at room temperature using an absolute quantum yield measurement system (Quantaurus-QY C11347-01, Hamamatsu Photonics, Hamamatsu, Japan).
Multi site-directed random mutagenesis
We performed site-directed random mutagenesis of seven amino acid residues of AsLOV2, Val416, Thr418, Asn425, Ile427, Ile466, Phe494 and Leu496, using Multi Site-Directed Mutagenesis Kit (MLB, Nagoya, Aichi, Japan) [15] according to the manufacturer's instructions. Among the seven residues, we first introduced mutations into three residues, Asn425, Ile427 and Ile466. Sequences for two degenerative primers for the mutation of the three residues are shown as follows: Primer-1 for the mutation of Asn425 and Ile427, 5′-CCTAGACTGCCCGACNNNCCTNNNATTTTCGCATCTGAT-3′ ; Primer-2 for the mutation of Ile466, 5′-GCAACCGTGAGGAAGNNNCGCGACGCCATTGAT-3′ . Next we introduced mutations into four amino acid residues, Val416, Thr418, Phe494 and Leu496. Sequences for two degenerative primers for the mutation of the four amino acid residues are shown as follows: Primer-3 for the mutation of Val416 and Thr418, 5′-ATTGAAAAGAACTTCNNNATTNNNGACCCTAGACTGCCC-3′ ; Primer-4 for the mutation of Phe494 and Leu496, 5′-AAATTCTGGAACCTGNNNCACNNNCAGCCTATGAGGGAC-3′ .
Imaging-based screening system E. coli
DH5α cells were transformed with plasmids respectively encoding AsLOV2 and its variants, and seeded on LB agar media plates containing 100 µg/mL ampicillin and 10 µM IPTG, which was optimized for the growth of E. coli cells on agar media and protein expression. The cells were grown at 37°C for 16 h. Protein expression was induced by a temperature downshift from 37 to 15°C. The cells were incubated in the dark condition at 15°C for 48 h following the induction. Bacterial colonies grown on agar plates were imaged on an M205 FA epifluorescence microscope (Leica, Wetzlar, Germany) equipped with a Retiga 1300i digital camera (Qimaging, Burnaby, BC, Canada). The system was controlled by MetaMorph software (Molecular Devices, Union City, CA, USA). For the fluorescence imaging, the agar plates were excited at 480/40 nm for 500 ms with 30% FIM. Images were obtained through a barrier long pass filter LP 510 nm. To facilitate the screening, all the bacterial colonies expressing AsLOV2 variants on agar plates were chilled on ice for 10 min or heated up at 50°C for 5 min using a heat block in the dark prior to imaging. Light source Blue light irradiation of all the samples, such as purified proteins and bacterial colonies on agar plates, was performed with a LED light source (470 nm, CCS Inc., Kyoto, Japan) for 10 s at 10 mW/cm 2 .
Curve fitting
We fitted all the recovery curves of absorption and fluorescence of purified AsLOV2 and its variants to the following single exponential equation using the online curve-fitting tool at http://zunzun.com : Y = A {1−exp(− kt )}+ B , where Y represents an absorbance or fluorescence intensity at time t , A and B are parameters, and k represents the rate constant. Time constant τ was determined using the following equation: τ = 1/ k . Time course of a fluorescence intensity change of each bacterial colony after irradiation with blue light was plotted with a normalized intensity calculated as follow: Normalized intensity = ( I − I after )/( I before − I after ), where I represents a fluorescence intensity at different time points after irradiation with blue light, I after represents a fluorescence intensity just after irradiation with blue light, and I before represents a fluorescence intensity just before the irradiation. All the recovery curves of the normalized intensities were fit well with the following single exponential equation: Y = A {1−exp(− kt )}, where Y represents the normalized intensity at time t , A is a parameter, and k represent the rate constant. Half-recovery time t 1/2 was determined using the following equation: t 1/2 = ln2/ k .
Supporting Information Figure S1 Spectral characterization of wild-type AsLOV2. (A) Absorption spectra of purified wild-type AsLOV2 protein before (dashed line) and after (solid line) irradiation with blue light. (B) Absorption difference spectra of purified wild-type AsLOV2 protein after irradiation with blue light. Δ Absorbance is calculated by subtracting absorbance before irradiation with blue light from that at different time points after the irradiation. Spectra were recorded every 20 s. Arrow indicates spectral changes with time. (C) Recovery of absorption at 447 nm shown in Fig. S1B . The absorption recovery was fit with a single exponential curve with a time constant of 55 s (solid line). (D) Fluorescence spectra of purified wild-type AsLOV2 protein upon excitation with 450 nm before (dashed line) and after (solid lines) irradiation with blue light. Arrow indicates spectral changes with time. (E) Time-lapse of fluorescence images of purified wild-type AsLOV2 protein. AsLOV2 emitted strong green fluorescence upon excitation at 480/40 nm for 500 ms with 30% FIM. The images were obtained with a stereoscopic fluorescence microscope through a long pass filter (∼510 nm cutoff). The sample is collected in a 1.5 mL microtube. (F) Time course of the fluorescence recovery of purified AsLOV2 protein. Fluorescence change was recorded every 30 s. The fluorescence recovery was fit with a single exponential curve with a time constant of 54 s (solid line). Purified wild-type AsLOV2 protein was concentrated to 1.9 mg/ml for all the spectral characterizations. (TIFF) Click here for additional data file. Figure S2 Thermal reversion kinetics of AsLOV2-V416T and AsLOV2-V416L. (A) Thermal reversion kinetics of purified AsLOV2-V416T protein at room temperature. The absorption at 447 nm was recorded every 1.0 s after irradiation with blue light and fit with a single exponential curve with a time constant τ of 2.6 s. (B) Thermal reversion kinetics of purified AsLOV2-V416L protein at room temperature. The absorption at 447 nm was recorded every 60 s after irradiation with blue light and fit with a single exponential curve with a time constant τ of 4.3×10 3 s. (TIFF) Click here for additional data file. Table S1 List of isolated AsLOV2 variants with fast and slow thermal reversion kinetics.
Bacterial colonies expressing
AsLOV2 variants were observed with a stereoscopic fluorescence microscope to screen and isolate variants with improved thermal reversion kinetics. (TIFF) Click here for additional data file.
📊 Figures
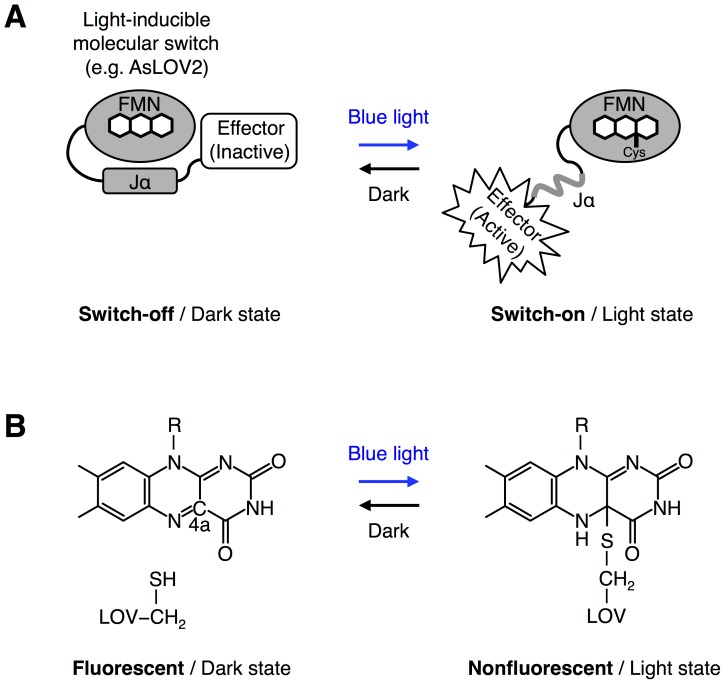
Figure 1
A LOV domain and its photocycle.
(A) The second light-oxygen-voltage (LOV) domain derived from Avena sativa phototropin 1 (AsLOV2) binds a flavin cofactor (FMN) to sense blue light. In the dark state, the C-terminal Ju03b1 helix of A...
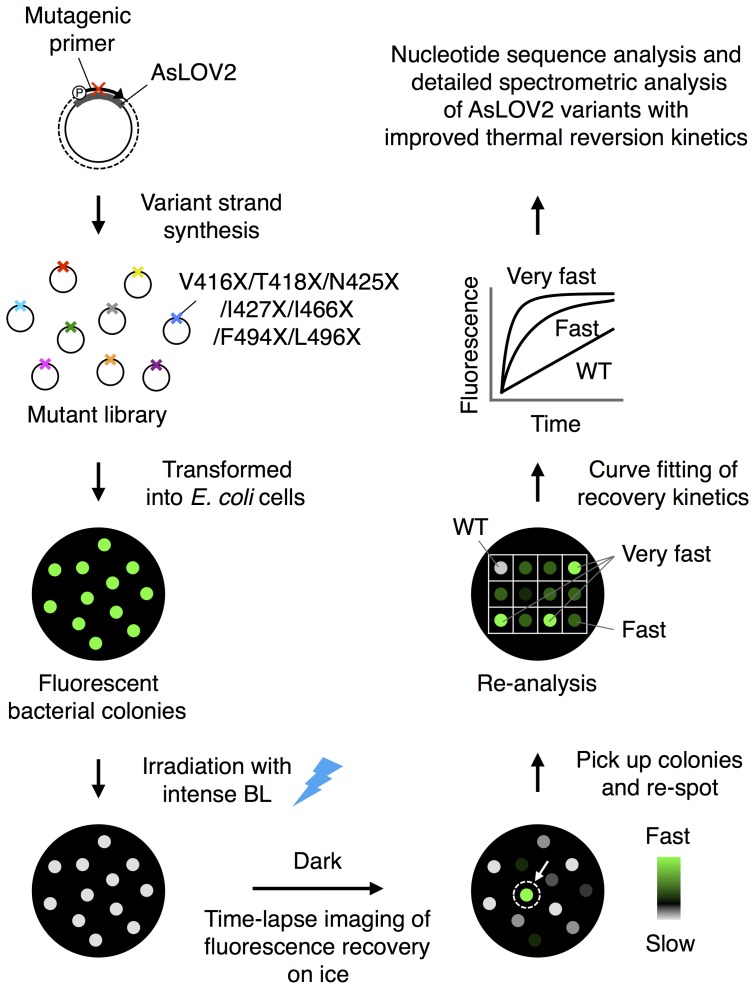
Figure 2
Imaging-based high-throughput system for tuning LOV domains.
A library of cDNAs encoding AsLOV2 variants is generated using multi site-directed random mutagenesis. Mutagenic primers are designed to change codons encoding Val416, Thr418, Asn425, Ile427, Ile466, ...
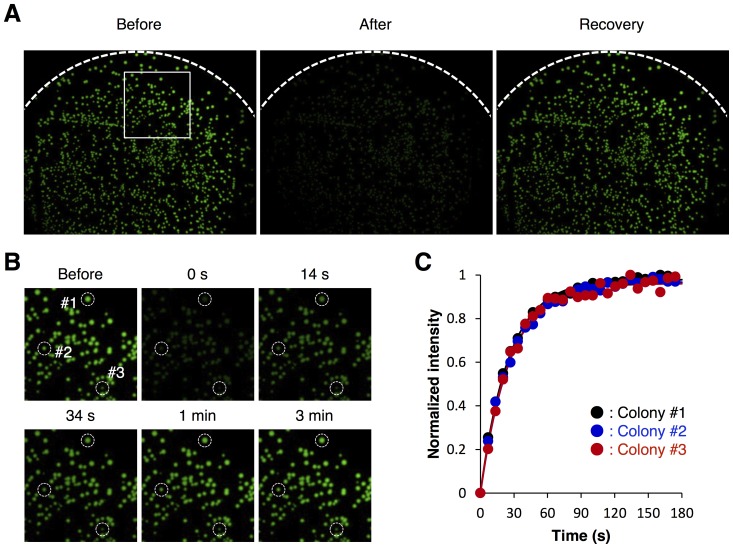
Figure 3
Direct imaging the thermal reversion of wild-type AsLOV2.
(A) Bacterial colonies expressing wild-type AsLOV2 on an agar plate were irradiated with blue light, and fluorescence recovery of its flavin cofactor was visualized with a stereoscopic fluorescence mi...
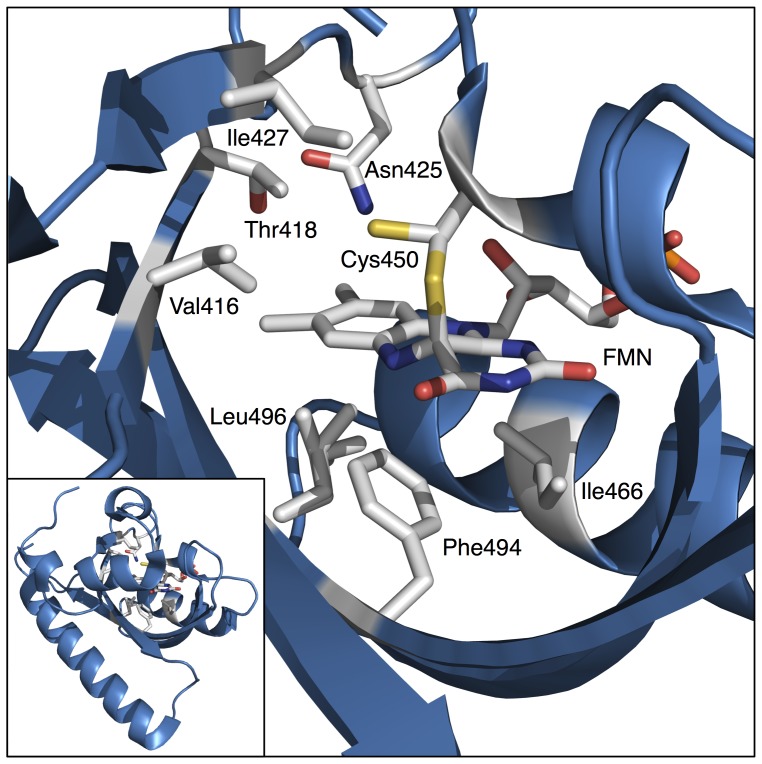
Figure 4
Crystal structure of wilt-type AsLOV2 in the light state.
Structural analysis of wild-type AsLOV2 (PDB: 2V1B) has previously revealed that approximately 20 amino acid residues surround the isoallexazine ring of FMN. Among them, seven amino acid residues, Val...
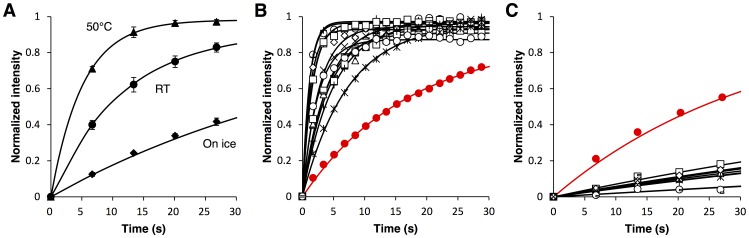
Figure 5
Mutagenesis and screening of AsLOV2 variants with improved thermal reversion kinetics.
(A) Fluorescence recovery of wild-type AsLOV2 after irradiation with blue light at room temperature (closed circle), at 50u00b0C (closed triangle), and on ice (closed diamond). The results are means u...
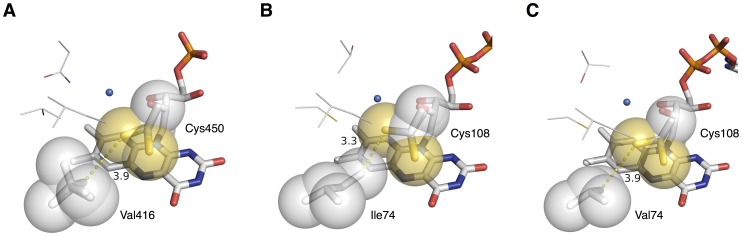
Figure 6
Structural analysis of Val416 of AsLO2 for thermal reversion.
(A) A crystal structure of wild-type AsLOV2 in the dark state (PDB: 2V1A) shows the side chain of Val416 directed toward Cys450 [10] . The valine residue is located within 4 of Cys450, but has no ster...
Figure images are served from the NIH/NLM PubMed Central Open Access Subset or Europe PMC; copyright remains with the publishers and authors.
💬 Discussion
0 commentsNo comments yet. Be the first to start a discussion!
Leave a Comment