Abstract
DNA-based points accumulation for imaging in nanoscale topography (DNA-PAINT) is a powerful super-resolution microscopy method that can acquire high-fidelity images at nanometer resolution. It suffers, however, from high background and slow imaging speed, both of which can be attributed to the presence of unbound fluorophores in solution. Here we present two-color fluorogenic DNA-PAINT, which uses improved imager probe and docking strand designs to solve these problems. These self-quenching single-stranded DNA probes are conjugated with a fluorophore and quencher at the terminals, which permits an increase in fluorescence by up to 57-fold upon binding and unquenching. In addition, the engineering of base pair mismatches between the fluorogenic imager probes and docking strands allowed us to achieve both high fluorogenicity and the fast binding kinetics required for fast imaging. We demonstrate a 26-fold increase in imaging speed over regular DNA-PAINT and show that our new implementation enables three-dimensional super-resolution DNA-PAINT imaging without optical sectioning.
🔬 Techniques
🧬 Organisms
✨ Fluorophores
🧪 Sample Preparation
🔬 Cell Lines
🏭 Microscope Brands
🧪 Reagent Suppliers
📷 Detectors
🔎 Objectives
🎨 Filters
💻 Software Details
💾 Data Repositories
🏛️ Research Organizations (ROR)
Affiliated research institutions:
📋 Methods
Imager probes and docking strands The sequences for the regular imager probe and docking strand were taken from Auer et al., 2017 16 and share a complementary region of 9 bases. Two sets (A and B) of fluorogenic imager probes and docking strands that are orthogonal in color (orange and far red) and binding affinity were developed (see Suppl. Note 3 ). The imager probes are 15-bases long and conjugated with a fluorophore at the 5’ end and a quencher at the 3’ end ( Ext. Data Fig. 1 ). The docking strands are partially mismatched to their corresponding imager probe sequences ( Ext. Data Fig. 2 ). Slightly different versions of the docking strand with different padding bases were developed within set A. Specifically, version 2 is optimized for multiplex imaging as it is predicted to have minimal cross-specific binding against set B. All oligonucleotides were ordered from Integrated DNA Technologies.
DNA origami The ring-shaped
DNA origami structure is based on a previously described structure 22 with only minor modifications in the positions of handles. The structure was designed using caDNAno ( caDNAno.org ), with an expected outer diameter of ~62 nm. DNA scaffold strands (8064-nt circular ssDNA) were produced using E. coli and M13-derived bacteriophages. All DNA oligonucleotides were purchased from Integrated DNA Technologies. 48 ssDNA handles ( Ext. Data Fig. 1 , docking strand D1–1b) extend from the 5’ end of staple strands on the outer helices. Additionally, 12 ssDNA handles ( Suppl. Table 1 , Biotin handle) extend from the 3’ end of staple strands on the bottom of the ring for biotin functionalization. DNA origami rings were assembled from a scaffold strand (80 nM) and a pool of staple strands (480 nM each) in 1× folding buffer (25 mM TrisHCl, 1 mM EDTA, pH 8.0 with 16 mM of MgCl 2 ) using an 18-hr thermal annealing program (85°C–25°C). Folded structures were concentrated by resuspending in half the original volume following PEG precipitation 30 . Correctly assembled rings were purified via rate-zonal centrifugation through 15–45% glycerol gradients (in 1× folding buffer) in an SW 55 rotor (Beckman Coulter) at 48,000 rpm at 4°C for 1.5 hr 31 . DNA origami were attached to channel slides (ibidi USA, μ-Slide VI, 80607) for imaging following a previously published protocol 10 with minor modifications. Slides were plasma-cleaned, coated with biotin-BSA (Millipore Sigma, A8549) and incubated with streptavidin (ThermoFisher, 434302). DNA origami with biotin handles were then attached to the functionalized coverslips. Non-fluorescent beads (Spherotech, TP-08-10) and nanodiamonds (Adámas Nanotechnologies, NDNV140nmHi) were added as fiduciary markers for drift correction.
Show full methods section
Imager probes and docking strands The sequences for the regular imager probe and docking strand were taken from Auer et al., 2017 16 and share a complementary region of 9 bases. Two sets (A and B) of fluorogenic imager probes and docking strands that are orthogonal in color (orange and far red) and binding affinity were developed (see Suppl. Note 3 ). The imager probes are 15-bases long and conjugated with a fluorophore at the 5’ end and a quencher at the 3’ end ( Ext. Data Fig. 1 ). The docking strands are partially mismatched to their corresponding imager probe sequences ( Ext. Data Fig. 2 ). Slightly different versions of the docking strand with different padding bases were developed within set A. Specifically, version 2 is optimized for multiplex imaging as it is predicted to have minimal cross-specific binding against set B. All oligonucleotides were ordered from Integrated DNA Technologies.
DNA origami The ring-shaped
DNA origami structure is based on a previously described structure 22 with only minor modifications in the positions of handles. The structure was designed using caDNAno ( caDNAno.org ), with an expected outer diameter of ~62 nm. DNA scaffold strands (8064-nt circular ssDNA) were produced using E. coli and M13-derived bacteriophages. All DNA oligonucleotides were purchased from Integrated DNA Technologies. 48 ssDNA handles ( Ext. Data Fig. 1 , docking strand D1–1b) extend from the 5’ end of staple strands on the outer helices. Additionally, 12 ssDNA handles ( Suppl. Table 1 , Biotin handle) extend from the 3’ end of staple strands on the bottom of the ring for biotin functionalization. DNA origami rings were assembled from a scaffold strand (80 nM) and a pool of staple strands (480 nM each) in 1× folding buffer (25 mM TrisHCl, 1 mM EDTA, pH 8.0 with 16 mM of MgCl 2 ) using an 18-hr thermal annealing program (85°C–25°C). Folded structures were concentrated by resuspending in half the original volume following PEG precipitation 30 . Correctly assembled rings were purified via rate-zonal centrifugation through 15–45% glycerol gradients (in 1× folding buffer) in an SW 55 rotor (Beckman Coulter) at 48,000 rpm at 4°C for 1.5 hr 31 . DNA origami were attached to channel slides (ibidi USA, μ-Slide VI, 80607) for imaging following a previously published protocol 10 with minor modifications. Slides were plasma-cleaned, coated with biotin-BSA (Millipore Sigma, A8549) and incubated with streptavidin (ThermoFisher, 434302). DNA origami with biotin handles were then attached to the functionalized coverslips. Non-fluorescent beads (Spherotech, TP-08-10) and nanodiamonds (Adámas Nanotechnologies, NDNV140nmHi) were added as fiduciary markers for drift correction.
Cell culture COS-7 cells
(ATCC lot #63624240) were grown in DMEM (Gibco, 21063029) supplemented with 10% fetal bovine serum (FBS; Gibco, 10438026).
U-2 OS cells
(ATCC lot #70008732) were grown in McCoy’s 5A medium (ATCC, 30-2007) supplemented with 10% FBS. Microtubule labeling: Channel slides (ibidi USA, μ-Slide VI, 80607) were plasma-cleaned and coated with poly-l-lysine (Sigma Aldrich, P4707) before seeding COS-7 cells. Microtubules were labeled following a previously published protocol 25 . COS-7 cells were incubated with 0.2% saponin for 1 min, fixed with 3% paraformaldehyde (Electron Microscopy Sciences, 15710) and 0.1% glutaraldehyde (Electron Microscopy Sciences, 16019) for 15 min, rinsed 3 times with PBS, incubated in blocking buffer (PBS + 0.2% Triton X-100 + 3% bovine serum albumin) for 30 min, and then incubated with mouse anti-alpha tubulin primary antibody (Sigma Aldrich,T5168) at a concentration of 1:200 in antibody dilution buffer (PBS + 1% BSA + 0.2% TX-100) overnight at 4°C. The cells were then washed 3 times for 5 min each and incubated with oligonucleotide-conjugated goat anti-mouse IgG secondary antibody (Jackson ImmunoResearch, 115-005-146) at a concentration of 1:200 for 1 hr at room temperature. The secondary antibody was conjugated to oligonucleotide docking strands ( Ext. Data Fig. 1 , D1-1a) using azide / DBCO click chemistry 10 . The cells were washed 3 times for 5 min each and then rinsed 3 times with PBS. Mitochondria labeling: U-2 OS cells were electroporated with plasmids encoding the mitochondrial marker GFP-OMP25 25 , 32 and then seeded onto ozone-cleaned 25-mm round coverslips. Mitochondria were labeled following a previously described protocol 25 . The cells were fixed with 3% PFA and 0.1% GA for 15 min, rinsed three times with PBS, permeabilized for 3 min, rinsed three times with PBS, incubated in blocking buffer for 1 hr, and then labeled with rabbit anti-GFP primary antibody (Invitrogen, A-11122) at 1:500 overnight at 4°C. The cells were washed 3 times for 5 min each prior to incubation with oligonucleotide-conjugated goat anti-rabbit IgG secondary antibody (Jackson ImmunoResearch, 111-005-144) at a concentration of 1:200 for 1 hr. The secondary antibody was conjugated to oligonucleotide docking strands ( Ext. Data Fig. 1 , D1-1a) using azide / DBCO click chemistry 10 . The cells were washed 3 times for 5 min each and finally rinsed with PBS 3 times. Dual endoplasmic reticulum and mitochondria labelling: U-2 OS cells were electroporated with plasmids encoding endoplasmic reticulum marker mEm-Sec61B (gift from Michael Davidson; Addgene plasmid # 54249). Samples were processed similarly to samples labelled only for mitochondria 25 with the following changes: the cells were labeled with mouse anti-GFP primary antibody (Invitrogen, A-11120) at 1:100 and rabbit anti-TOM20 (Abcam, ab78547) at 1:500 overnight at 4°C. After washing, the samples were labeled with goat anti-mouse IgG secondary antibody (Jackson ImmunoResearch, 115-005-146) and goat anti-rabbit IgG secondary antibody (Jackson ImmunoResearch, 111-005-144) conjugated with oligonucleotide docking strands ( Ext. Data Fig. 1 , D1-1c and D2-1a, respectively) both at a concentration of 1:200 for 1 hr at room temperature. Fluorescence measurements in solution: Fluorescence measurements of the probes in solution were performed with a microscope (the same microscope as described for imaging DNA origami structures) under widefield illumination provided by a xenon arc lamp (Sutter Instruments, Lambda LS). Fluorescence intensity was measured ~10 μm deep past the coverslip. Buffer-only blanks were measured for background correction. Samples were prepared in a high ionic strength PBS-based buffer (PBS, 500 mM NaCl) in channel slides (ibidi USA, μ-Slide VI, 80607). To measure quenching efficiency, fluorophore-conjugated strands were prepared at 0.2 μM, and saturated with adapter strands at 0.3 μM and quencher-conjugated strands at 0.45 μM ( Suppl. Table 2 and Suppl. Fig. 3b ). ‘Unbound probes’ samples contained only the imager probe (0.2 μM), and ‘bound probes’ samples were prepared with the probe and its complementary sequence in excess (20 μM) ( Fig. 1b and Suppl. Fig. 3c ). All oligonucleotides were ordered from Integrated DNA Technologies. Microscope setup: DNA origami samples and microtubule samples (for 2D imaging) were imaged in TIRF mode on a modified Nikon Ti-E inverted microscope with a 100× 1.45 NA oil immersion objective with a sCMOS camera (Andor, Zyla 4.2). For illumination, a 561-nm laser with a built-in acousto-optic modulator for intensity modulation (Omicron Lux) was used with a dichroic (Semrock, Di02-R488-25×36) and a band pass filter (Semrock, FF01-524/45-25). For imaging with the regular probe, data were recorded at 4 fps at ~0.2 kW/ cm2 . With the fluorogenic probe, data were recorded at 100 fps at ~2 kW/cm 2 . A custom image-based focus-lock system based on the a previously described design 33 was used. Astigmatic 3D imaging of microtubule samples was performed on a custom-built microscope as previously described 34 . Briefly, fluorescent signal was collected by an oil-immersion objective lens (Olympus, 100×, 1.49 NA) and imaged with a sCMOS camera (Hamamatsu, ORCA-Flash 4.0). A cylindrical lens (f = 500 mm) was added to the emission beam path to introduce astigmatism. Data were recorded at 100 fps with a 560-nm laser (MPB Communications, 500 mW) at an intensity of ~13 kW/cm 2 . 100 nm diameter fluorescent microspheres (ThermoFisher, 580/605, F8801) were imaged to generate reference PSFs. A custom-built focus-lock system based on tracking a reflected infrared laser was used to correct for axial drift. Mitochondria samples were imaged with a custom-built 4Pi-SMS system as previously described 25 . Briefly, the fluorescent signal was collected coherently by two opposing objectives (Olympus, 100×, 1.35 NA, silicone oil immersion,) and imaged with a sCMOS camera (Hamamatsu, ORCA-Flash 4.0 v2). Data were acquired at 100 fps with a 560 nm laser (MPB Communications, 2RU-VFL-P-2000–560-B1R) at an intensity of ~15 kW/cm 2 . Dual mitochondria and ER-labelled samples were imaged on a custom-built microscope in 2-channel mode as previously described with modifications 35 . In brief, samples were simultaneously excited at 561 nm (~1.5 kW/cm 2 ) and 642 nm (~7.5 kW/cm 2 ). Fluorescence emission was split using a tilted bandpass filter (Semrock, FF01–709/167) as a beam splitter, filtered (Chroma, ZET405/488/561/647m) and imaged on adjacent areas of a sCMOS camera (Hamamatsu, ORCA-Flash 4.0). An oil-immersion objective lens (Leica Microsystems, 63x, 1.47 NA) was used. Fluorescent microspheres (ThermoFisher, TetraSpeck, 100 nm diameter, T7284 or T7279) were imaged to generate sub-diffraction alignment maps between the two color channels. Imaging buffer: For imaging origami structures, a Tris-based buffer (5 mM Tris, 10 mM MgCl 2 , 1 mM EDTA, 0.05% Tween 20, 20 mM Na 2 SO 3 and 1 mM Trolox, pH 7.3-7.5) was prepared. For imaging fixed cell samples, a high ionic strength PBS-based buffer (1× PBS, 500 mM NaCl, 20 mM Na 2 SO 3 and 1 mM Trolox, pH 7.3-7.5) was used. Trolox (Santa Cruz Biotechnology, sc-200810) aliquots were stored at −20°C at a concentration of 50 mM in DMSO and thawed prior to the experiment. Imager probes were stored at −20°C at a concentration of 100 μM in nuclease-free H 2 O and serially diluted into one of the imaging buffers as necessary. Data analysis: Data acquired by the single-objective microscope systems were analyzed with PYME 36 , 37 and custom code written in Python. Localizations in 2D were performed by a weighted least square fit with a 2D Gaussian PSF model 38 , 39 . Astigmatic 3D localizations were performed by fitting against a PSF experimentally derived from bead images 40 . For 2-color DNA-PAINT, molecules were localized independently in each channel and subsequently recombined using an experimentally acquired alignment map. The localization routine for 4Pi-SMS microscope data has been previously described in detail 25 . Images and movies were rendered using Vutara SRX software (Bruker). Localizations that appeared in consecutive frames (allowing for 1 frame misdetection) at the same position (within < 2σ xy-localization precision) were combined into ‘blinks’. This correction takes into account that these localizations most likely do not represent independent samples of the docking strands (see Suppl. Note 2 ). Although this results in fewer localization counts, blinks provide better estimates of the position at higher precision, and this approach avoids artificially inflated blinking rates and overcounting artifacts due to fast camera frame rate and/or slow blinking. Drift corrections were performed using the redundant cross-correlation method 41 . Blinks were rendered as 2D or 3D Gaussians in images and movies.
Fourier ring correlation
(FRC) and Fourier shell correlation (FSC) was computed based on the method described in Nieuwenhuizen, et al., 2013 42 . A threshold of 0.143 was used. A 5 × 5 × 0.6 μm subregion was used for the FSC calculations presented in Fig. 4c and Ext. Data Fig. 3c . Coordinate-based colocalization was computed based on the method described in Malkusch et al. 2012 26 , and code published as part of LocAlization Microscopy Analyzer (LAMA) reported in Malkusch and Heilemann, 2016 43 . Analytic study of DNA-PAINT imaging speed and simulations of multi-emitter artifact were performed with code written in Python (shared on Github 44 ). Computational screens of docking strand sequences were performed with custom code written in Python (shared on Github 45 ) and used tools available as part of Biopython 20 .
Statistics
Statistical tests were performed using functions from the SciPy library (scipy.stats) 46 . Assumption of normality was tested for t-tests where sample size is > 5 using the Shapiro-Wilk test. No assumptions were tested for the Mann-Whitney U test or the Wilcoxon signed-rank test. No multiple comparison corrections were performed.
Supplementary Material SupplVideo1 Supplementary Video 1: Fast 3D fluorogenic DNA-PAINT imaging ([imager probe A] =10 nM; 100 Hz; 10 min) of microtubules in a COS-7 cell without optical sectioning under widefield illumination. The hollow center of microtubules can be observed in both the XY and XZ planes when viewing 30-nm thick cross-sections. 1 μm scalebar. SupplVideo2 Supplementary Video 2: (a) Raw images from fast astigmatic 3D fluorogenic DNA-PAINT imaging ([imager probe A] =10 nM; 100 Hz) of microtubules in a COS-7 cell under widefield illumination. (b) Live kymograph of the blinking within the dashed box in (a). SupplVideo3 Supplementary Video 3: (a) Images from fast 2-color fluorogenic DNA-PAINT using imager probe A (10 nM; Cy3B; green) and imager probe B (1 nM; ATTO 643; magenta) to image the endoplasmic reticulum and mitochondria respectively (100 Hz; raw images from the two color channels were transformed and aligned for display). (b) Heatmap of pixel intensities. Negligible spectral cross-talk between the fluorophores (Cy3B and ATTO 643) was observed as indicated by the well resolved populations (green and magenta dashed line respectively). Supplementary information
📊 Figures
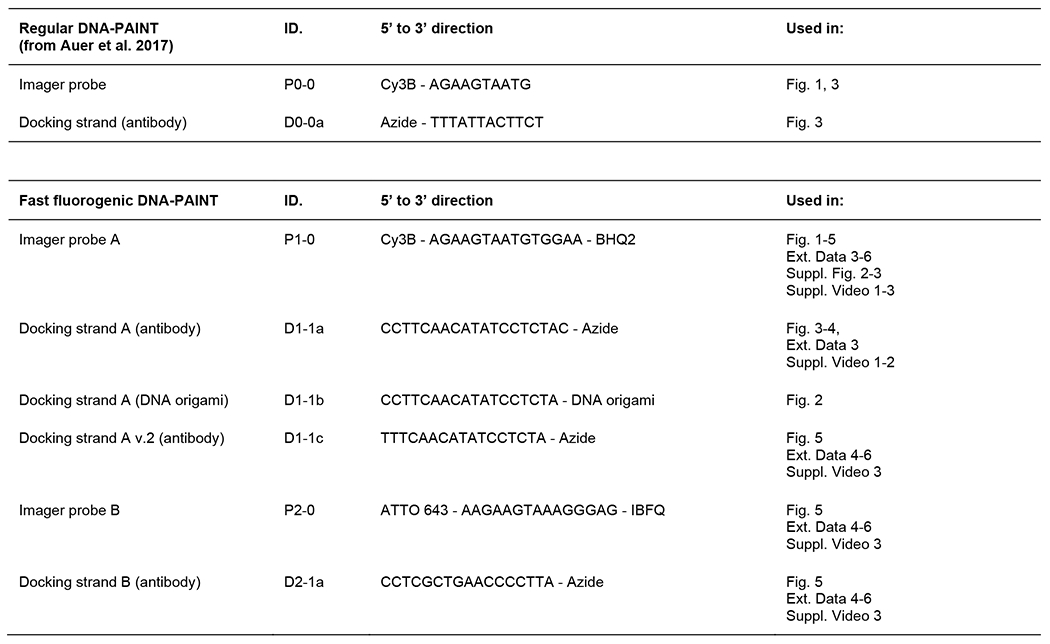
Extended Data Fig. 1
List of imager probes and docking strands used in this study.
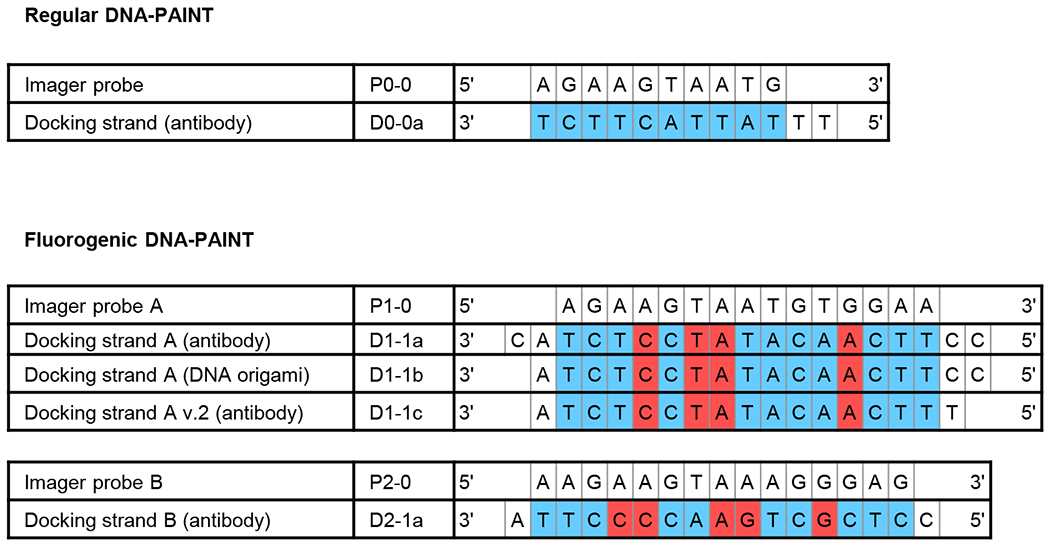
Extended Data Fig. 2
Alignment between imager probes and their corresponding docking strands.
Fluorogenic DNA-PAINT uses imager probes and docking strands with internal mismatches. Complementary base pairings are colored in blue whereas mismatches in red.
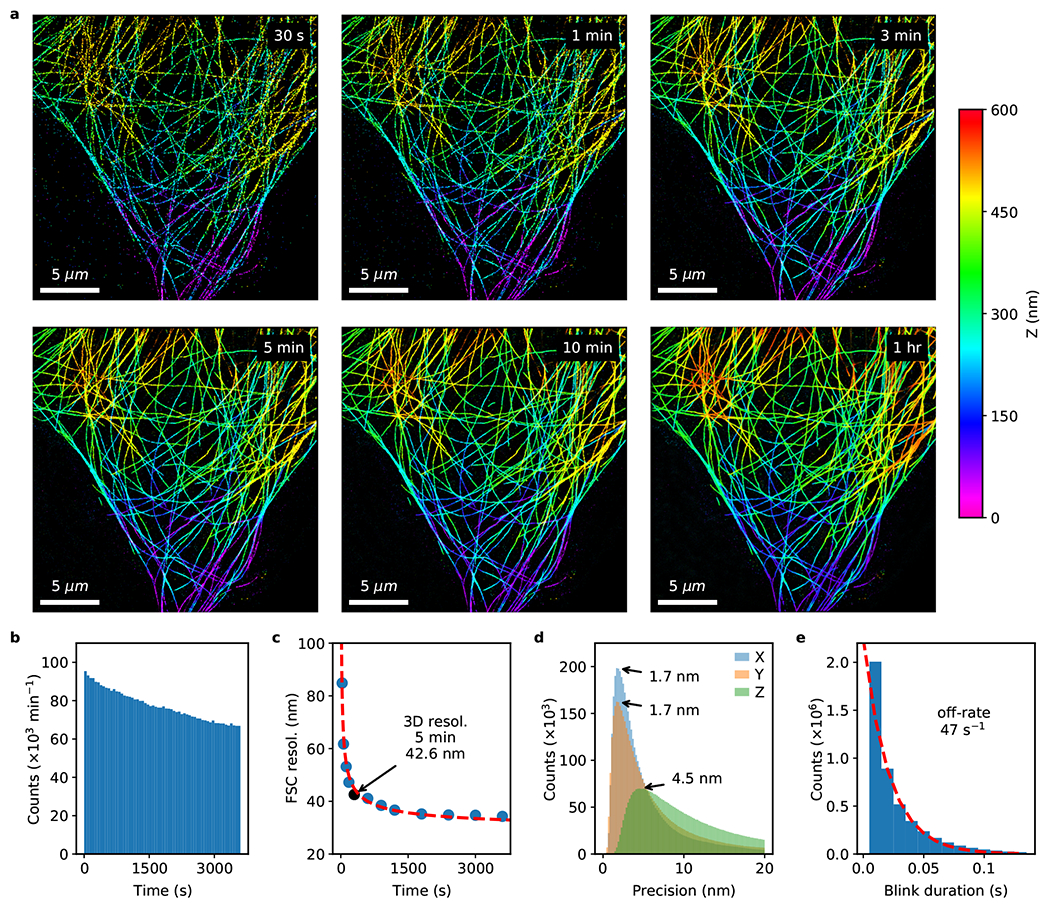
Extended Data Fig. 3
Fast astigmatic 3D fluorogenic DNA-PAINT imaging without optical sectioning.
The full dataset from which Fig. 4a u2013 c were generated. (a) Fast 3D fluorogenic DNA-PAINT imaging of immunolabeled microtubules in COS-7 cells under widefield illumination at multiple time points....
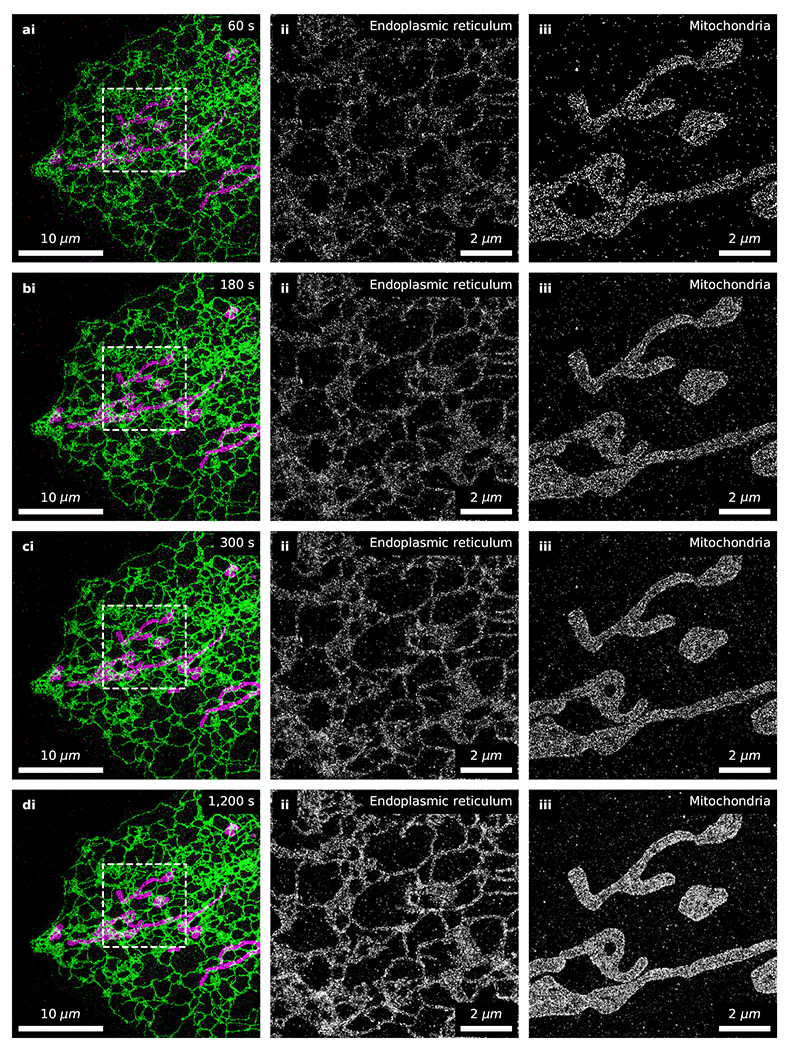
Extended Data Fig. 4
Time series of fast 2-color fluorogenic DNA-PAINT imaging without optical sectioning.
The full dataset from which Fig. 5b u2013 f were generated, rendered at various timepoints. (a-d) Fast 2-color fluorogenic DNA-PAINT imaging of immunolabeled endoplasmic reticulum ( ii ; [imager probe...
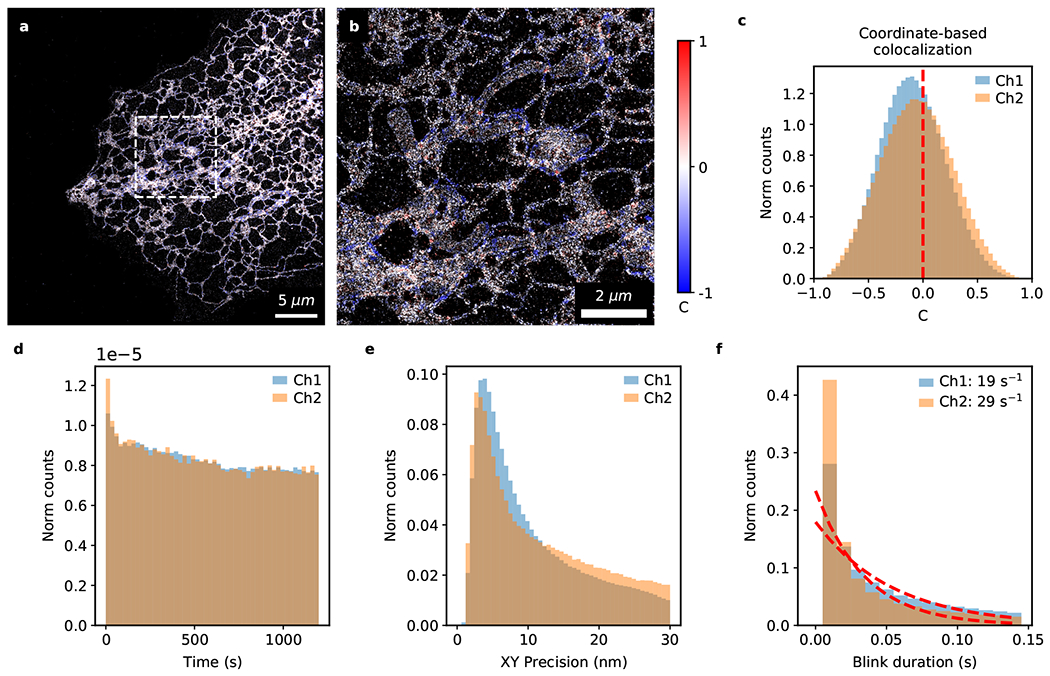
Extended Data Fig. 5
Analysis of fast 2-color fluorogenic DNA-PAINT imaging without optical sectioning.
Detailed analysis of the full 20-minute 2-color fluorogenic DNA-PAINT dataset from which Fig. 5 and Ext. Data Fig. 4 were generated. Image colored by the correlation parameter (C) based on Coordinate-...
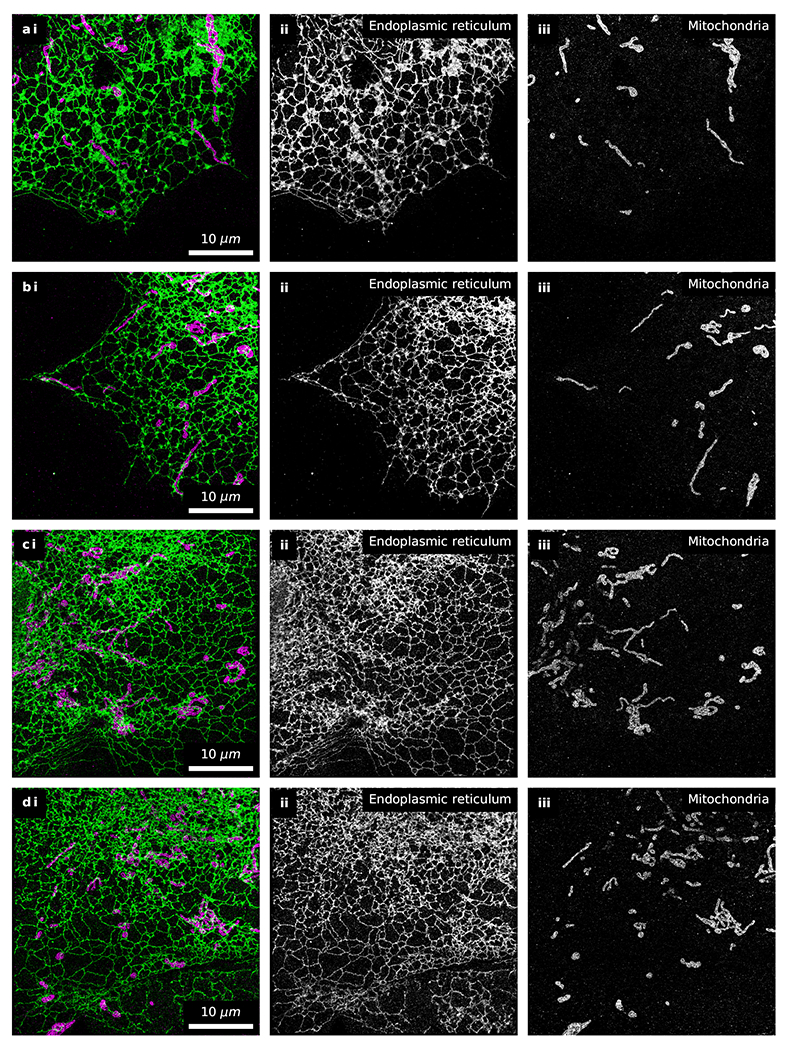
Extended Data Fig. 6
Additional examples of fast 2-color fluorogenic DNA-PAINT imaging without optical sectioning.
Fast 2-color fluorogenic DNA-PAINT imaging of immunolabeled endoplasmic reticulum (green; [imager probe A] = 10 nM) and mitochondria (magenta; [imager probe B] = 1 nM) in U-2 OS cells under widefield ...
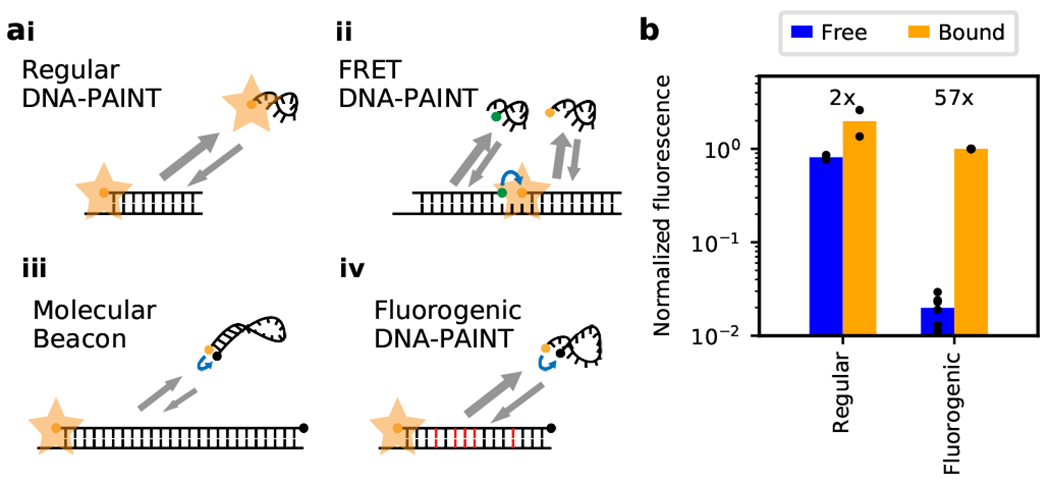
Figure 1.
Imager probes for DNA-PAINT.
(a) Comparison of different DNA-PAINT imager probe / docking strand systems: (i) Imager probe for regular DNA-PAINT is always fluorescent and contributes to high background. (ii) In FRET DNA-PAINT, ac...
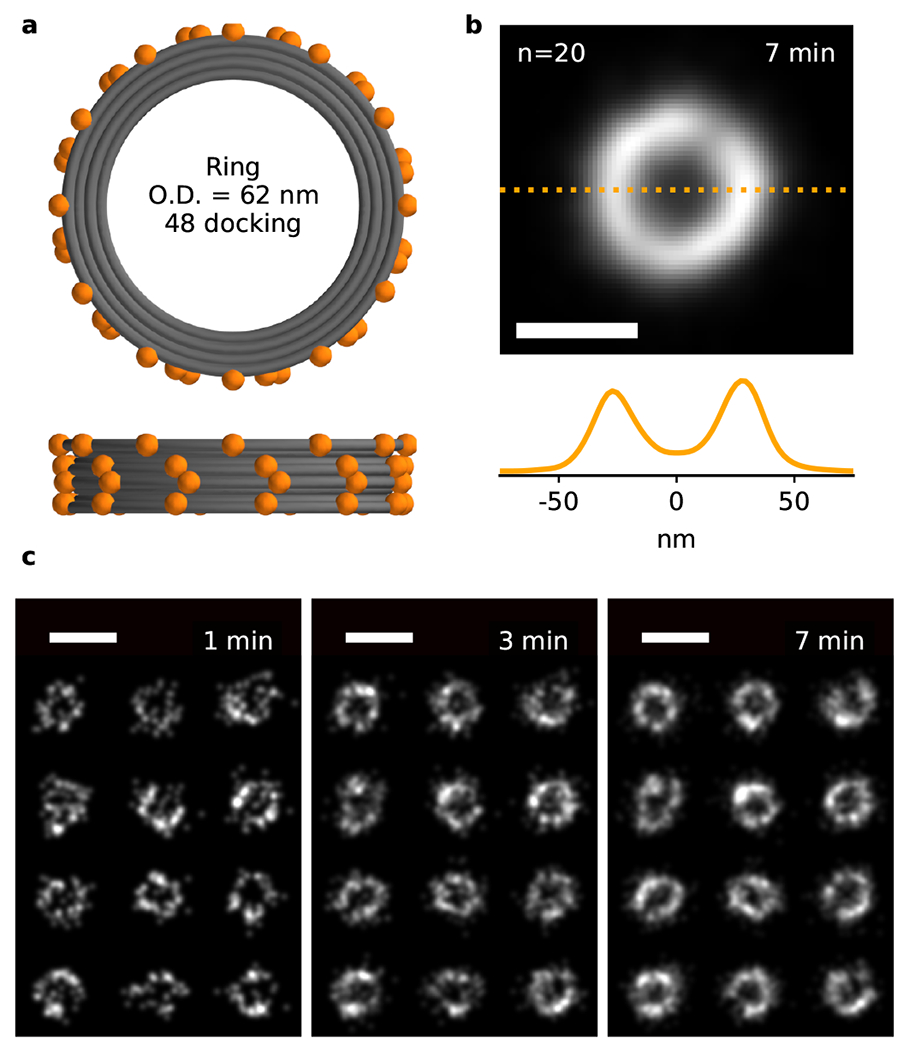
Figure 2.
Fast fluorogenic DNA-PAINT imaging of DNA origami nanostructures.
(a) Top and front schematic view of the DNA origami nanostructure, with 48 docking strands attached to the 62-nm ring. (c) Fast fluorogenic DNA-PAINT TIRF imaging ([imager probe A] = 250 nM; frame rat...
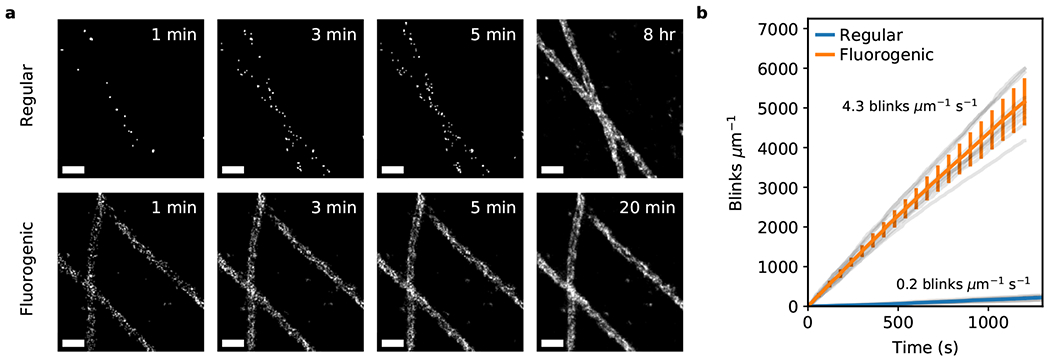
Figure 3.
Comparison of regular and fluorogenic DNA-PAINT imaging.
(a) Qualitative comparison of regular versus fluorogenic DNA-PAINT TIRF-imaging of fixed microtubules (regular: [probe] = 100 pM, frame rate = 4 Hz; fluorogenic: [imager probe A] = 20 nM, frame rate =...
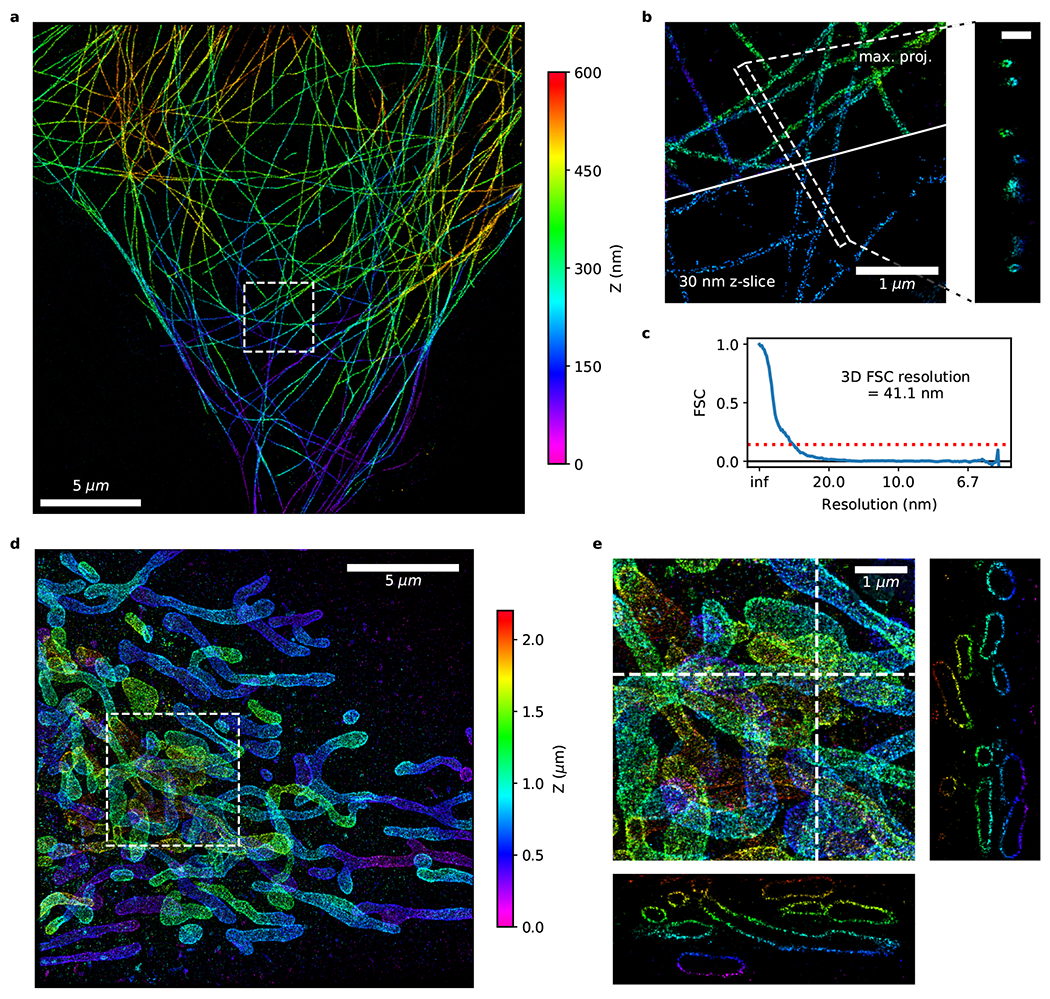
Figure 4.
Fast 3D fluorogenic DNA-PAINT imaging without optical sectioning.
(a-c) Fast astigmatic 3D fluorogenic DNA-PAINT imaging ([imager probe A] = 10 nM; 100 Hz; 10 min) of immunolabeled microtubules in COS-7 cells without optical sectioning under widefield illumination. ...
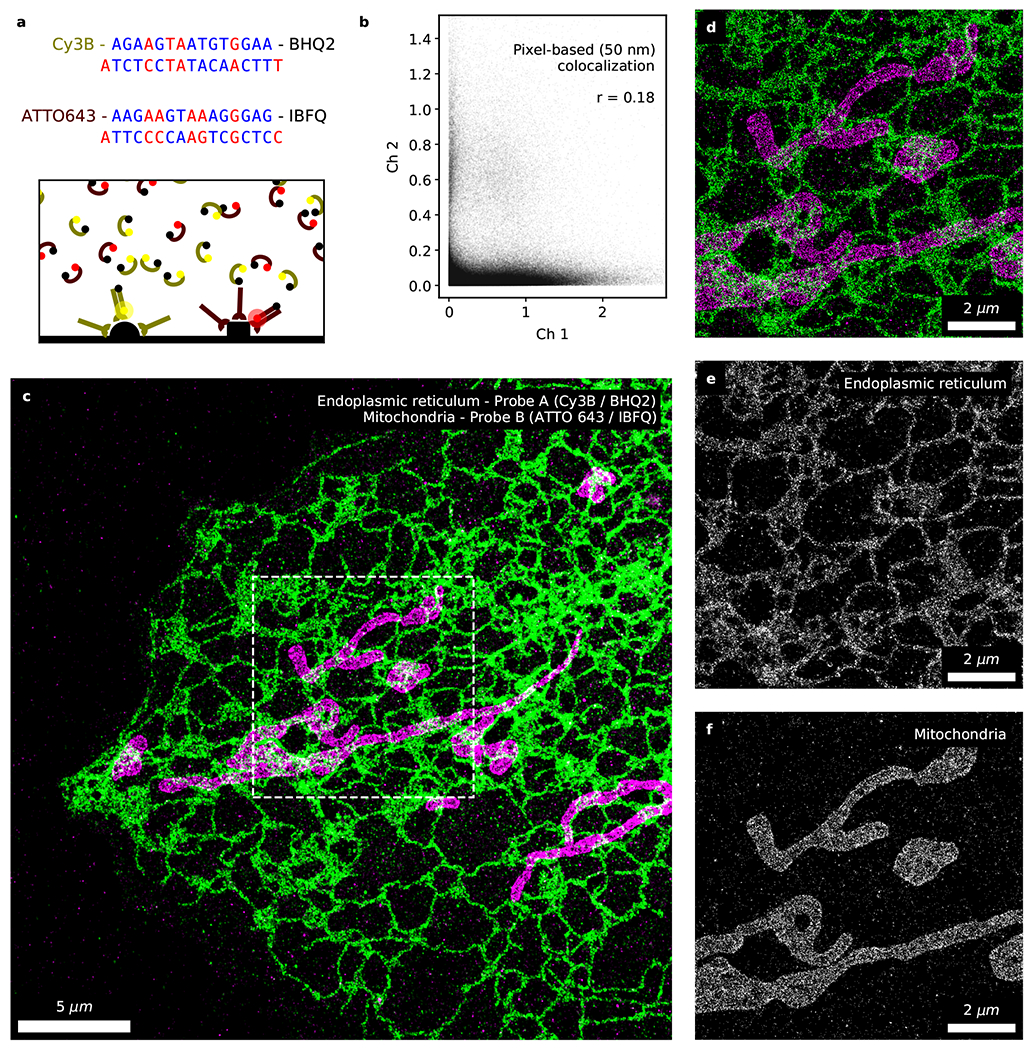
Figure 5.
Fast 2-color fluorogenic DNA-PAINT imaging without optical sectioning.
Simultaneous 2-channel DNA-PAINT imaging with fluorogenic probes ([imager probe A] = 10 nM and [imager probe B] = 1 nM; 100 Hz; 10 min) of immunolabeled endoplasmic reticulum (overexpressed Sec61u03b2...
Figure images are served from the NIH/NLM PubMed Central Open Access Subset or Europe PMC; copyright remains with the publishers and authors.
💬 Discussion
0 commentsNo comments yet. Be the first to start a discussion!
Leave a Comment