Abstract
Axon guidance is proposed to act through a combination of long- and short-range attractive and repulsive cues. The ligand-receptor pair, Netrin (Net) and Frazzled (Fra) (DCC, Deleted in Colorectal Cancer, in vertebrates), is recognized as the prototypical effector of chemoattraction, with roles in both long- and short-range guidance. In the Drosophila visual system, R8 photoreceptor growth cones were shown to require Net-Fra to reach their target, the peak of a Net gradient. Using live imaging, we show, however, that R8 growth cones reach and recognize their target without Net, Fra, or Trim9, a conserved binding partner of Fra, but do not remain attached to it. Thus, despite the graded ligand distribution along the guidance path, Net-Fra is not used for chemoattraction. Based on findings in other systems, we propose that adhesion to substrate-bound Net underlies both long- and short-range Net-Fra-dependent guidance in vivo, thereby eroding the distinction between them.
🔬 Techniques
🔭 Microscopes
🧬 Organisms
💻 Software
✨ Fluorophores
🧪 Sample Preparation
🏭 Microscope Brands
🧪 Reagent Suppliers
🔴 Lasers
📷 Detectors
🔎 Objectives
💻 Software Details
📋 Protocols
💾 Data Repositories
🏷️ Research Resource Identifiers (RRIDs)
Verified research resources used in this paper:
🏛️ Research Organizations (ROR)
Affiliated research institutions:
📋 Methods
Histology and confocal microscopy
Histology was performed as described previously ( Chen et al., 2014 ) with minor modifications. After antibody incubations, brains were washed into PBS with 0.5% Triton X-100 (PBT). To minimize tissue shrinkage, the brains were moved from PBT to mounting medium (EverBrite, Biotium) through a series of mixtures with increasing concentrations of the latter. The following primary antibodies were used: chicken Pab α-GFP (abcam, ab13970, RRID: AB_300798 , 1:1,000), Mab24B10 ( Van Vactor et al., 1988 ) (DSHB, RRID: AB_528161 , 1:20), rabbit Pab α-DsRed (Clontech, Cat# 632496, RRID: AB_10013483 , 1:200), mouse α-V5 (Serotec, Cat# MCA1360, RRID: AB_322378 1:200). The following secondary antibodies were used: Alexa Fluor 488 goat α-chicken, Alexa Fluor 568 goat α-rabbit, Alexa Fluor 647 goat α-mouse (ThermoFisher, Cat# A-11039, RRID: AB_2534096 , Cat# A11036, RRID: AB_10563566 , Cat# A-21235, RRID: AB_2535804 , 1:500). Confocal images were acquired with a Zeiss LSM780 system.
Confocal image analysis
To carry out 3D measurements in the medulla, imaged volumes are deconstructed into oriented medulla columns bounded by computed surfaces for M0 and M6. A typical multi-channel confocal stack of the medulla measures 150 x 150 x 180 µm and has voxel dimensions of 0.29 x 0.29 x 0.4 µm. In a pre-processing step, all channels are scaled in the z-dimension to achieve unit voxel aspect ratio. The Mab24B10 channel (i.e. all R cells) is used in the deconstruction. R7 axon terminals are the deepest-reaching visible features; a mask of the R7 axon tips is generated by manually cleaning up the image. Local intensity maxima in the original image are selected with this mask and the resulting point cloud is used to define the continuous 3D surface of the M6 layer. The bundles of R cell axons that stretch across the outer medulla surface increases the complexity of the image at M0; a more involved approach is required to define this layer. The area bounding the footprint of the R7 projections in M6 is divided into 50–72 regions, and, for each region, columnar volumes orthogonal to the M6 surface are extracted from the image. Intensity profiles along the column axis of these volumes are used to find local peaks, which are classified according to magnitude and their distance from the M6 surface. These two parameters are used to identify the peaks that reside in the M0 layer; the M0 surface is built from a point cloud derived from the selected peaks. A similar approach is used to compute the Dm4 surface. To define the medulla columns, a sequence of masks laminating the space between the M0 and M6 surfaces are used to generate maximum intensity projections (MIPs) of the Mab24B10 image. The cross-sections of R7-R8 projections are identified as local intensity maxima in these MIPs. Across the MIP sequence, the intensity maxima are grouped into individual tracks that define the position and orientation of the medulla columns. This information is used to create single panel MIPs of individual R8 axons from the R8 channel. The tips of R8 projections are marked manually on the MIPs and the input is used to calculate 3D distances to the M0 and M6 surfaces. Up to 500 R8s per medulla were scored with this approach. This analysis was written in Matlab (Mathworks) with a critical script sourced form the Mathworks File Exchange repository ( D’Errico, 2005 ). Fiji (ImageJ) ( Schindelin et al., 2012 ) was used for user-assisted tasks. Gaussian mixture modeling of adult R8 phenotypes Each data set in Figure 4b–e was modeled as mixtures of 2–7 Gaussian distributions using a built-in Matlab (Mathworks) function. For all cases, the Akaike information criterion, a fitting evaluation metric that weighs the goodness-of-fit against the number of free parameters, decreased monotonically until the minimum was reached at 4 or 5 components. While more complex models are supported by the data, we presented the fits with 3 components, the minimum number required to represent the major sub-populations. When modeled with >3 Gaussians, only the fra RNAi ( Figure 4c ) data supports a wild-type component with a mean at 0.75.
Show full methods section
Histology and confocal microscopy
Histology was performed as described previously ( Chen et al., 2014 ) with minor modifications. After antibody incubations, brains were washed into PBS with 0.5% Triton X-100 (PBT). To minimize tissue shrinkage, the brains were moved from PBT to mounting medium (EverBrite, Biotium) through a series of mixtures with increasing concentrations of the latter. The following primary antibodies were used: chicken Pab α-GFP (abcam, ab13970, RRID: AB_300798 , 1:1,000), Mab24B10 ( Van Vactor et al., 1988 ) (DSHB, RRID: AB_528161 , 1:20), rabbit Pab α-DsRed (Clontech, Cat# 632496, RRID: AB_10013483 , 1:200), mouse α-V5 (Serotec, Cat# MCA1360, RRID: AB_322378 1:200). The following secondary antibodies were used: Alexa Fluor 488 goat α-chicken, Alexa Fluor 568 goat α-rabbit, Alexa Fluor 647 goat α-mouse (ThermoFisher, Cat# A-11039, RRID: AB_2534096 , Cat# A11036, RRID: AB_10563566 , Cat# A-21235, RRID: AB_2535804 , 1:500). Confocal images were acquired with a Zeiss LSM780 system.
Confocal image analysis
To carry out 3D measurements in the medulla, imaged volumes are deconstructed into oriented medulla columns bounded by computed surfaces for M0 and M6. A typical multi-channel confocal stack of the medulla measures 150 x 150 x 180 µm and has voxel dimensions of 0.29 x 0.29 x 0.4 µm. In a pre-processing step, all channels are scaled in the z-dimension to achieve unit voxel aspect ratio. The Mab24B10 channel (i.e. all R cells) is used in the deconstruction. R7 axon terminals are the deepest-reaching visible features; a mask of the R7 axon tips is generated by manually cleaning up the image. Local intensity maxima in the original image are selected with this mask and the resulting point cloud is used to define the continuous 3D surface of the M6 layer. The bundles of R cell axons that stretch across the outer medulla surface increases the complexity of the image at M0; a more involved approach is required to define this layer. The area bounding the footprint of the R7 projections in M6 is divided into 50–72 regions, and, for each region, columnar volumes orthogonal to the M6 surface are extracted from the image. Intensity profiles along the column axis of these volumes are used to find local peaks, which are classified according to magnitude and their distance from the M6 surface. These two parameters are used to identify the peaks that reside in the M0 layer; the M0 surface is built from a point cloud derived from the selected peaks. A similar approach is used to compute the Dm4 surface. To define the medulla columns, a sequence of masks laminating the space between the M0 and M6 surfaces are used to generate maximum intensity projections (MIPs) of the Mab24B10 image. The cross-sections of R7-R8 projections are identified as local intensity maxima in these MIPs. Across the MIP sequence, the intensity maxima are grouped into individual tracks that define the position and orientation of the medulla columns. This information is used to create single panel MIPs of individual R8 axons from the R8 channel. The tips of R8 projections are marked manually on the MIPs and the input is used to calculate 3D distances to the M0 and M6 surfaces. Up to 500 R8s per medulla were scored with this approach. This analysis was written in Matlab (Mathworks) with a critical script sourced form the Mathworks File Exchange repository ( D’Errico, 2005 ). Fiji (ImageJ) ( Schindelin et al., 2012 ) was used for user-assisted tasks. Gaussian mixture modeling of adult R8 phenotypes Each data set in Figure 4b–e was modeled as mixtures of 2–7 Gaussian distributions using a built-in Matlab (Mathworks) function. For all cases, the Akaike information criterion, a fitting evaluation metric that weighs the goodness-of-fit against the number of free parameters, decreased monotonically until the minimum was reached at 4 or 5 components. While more complex models are supported by the data, we presented the fits with 3 components, the minimum number required to represent the major sub-populations. When modeled with >3 Gaussians, only the fra RNAi ( Figure 4c ) data supports a wild-type component with a mean at 0.75.
2P microscopy and image processing Overview
Using a custom-built two photon microscope, we can image the developing visual system between 15 and 65 hr after puparium formation (hAPF). In the specific case of the R8 photoreceptor cell, one imaging session can capture the dynamics of 50–200 individual growth cones at 5–30 min time resolution. We analyzed the 3D time series using a suite of custom scripts implemented in Matlab (Mathworks). The source code for this suite of scripts are available as a supplement to this article.
Microscope
The microscope was designed to maximize light collection efficiency. The three principal considerations were: (1) High efficiency GaAsP detectors (Hamamatsu); (2) A short, wide-angle collection path with 2” optical elements; and 3. Use of a large field-of-view objective (Zeiss, W Plan-Apochromat 20x/1.0 DIC) that balances a long working distance with a large numerical aperture. A tunable Ti:sapphire pulsed laser (Chameleon Ultra II, Coherent) was used as the light source. Most of the images presented in this study were collected at ~25 mW (920 or 970 nm) under-the-objective power to minimize photobleaching. The microscope hardware and image capture was computer controlled and driven by ScanImage ( Pologruto et al., 2003 ).
Sample preparation
During pupal development, a small, fat-free window over each retina provides optical access into the visual system. The cuticle around the head is removed after head eversion (~12 hAPF), and the animal is attached eye-down on to a coverglass (22 x 50 mm, No.1.5) coated with dilute embryo glue. Up to 18 animals can fit on a sample slide making it possible to image multiple flies in a single session. To provide sufficient immersion liquid for the long imaging sessions, a water reservoir is constructed on the opposite surface of the cover glass. Glass-bound pupae are suspended above a second water reservoir to minimize dehydration. Animals are staged at white pre-pupa formation (0 hAPF) or head eversion (12 hAPF) and kept at 25°C using an objective heater system (Bioptechs). In all live imaging experiments, genotype-independent R8 labeling was achieved by activating a transcriptionally silenced strong driver with a cell-type specific recombinase (Flp or R, driven by a promoter from the senseless gene, see Experimental Genotypes). The two drivers used, GMR and brp-2A-LexA (see Experimental Genotypes), offered different advantages and caveats. GMR-driven expression of myr::tdTOM provides strong labeling of R8s up to ~50 hAPF. The signal begins to degrade beyond this point due to early onset of pigmentation in the retina and the imaging window closes ~58 hAPF. The modified brp BAC, utilized as a LexA driver, complements the GMR promoter. Expression from brp-2A-LexA dips at ~45 hAPF, but recovers to reveal the details of R8 dynamics past 60 hAPF without significant loss of signal strength. While either strategy yields an adequate description of WT R8 targeting, combining the strengths of both was essential to a quantitative study of the fra null phenotype.
Image processing and analysis
A typical 10 min per frame 24 hr time series contains ~140 512 x 512 x 390 pixel stacks with voxel dimensions of 0.24 x 0.24 x 0.4 µm. In a pre-processing step, these stacks are scaled in the z-dimension to achieve unit voxel aspect ratio. Medulla registration begins with manual clean-up of a single time point, the anchor stack (40 hAPF), to remove contributions from the lamina and incoming R8 axons. The cleaned stack is used as a mask to select local intensity maxima in R8 growth cones. The resulting point cloud, which is a sparse representation of the outer medulla surface, is fit to an oblate ellipsoid, yielding the rotation matrix that brings the medulla into alignment with the image axes (i.e. top-down view.) The point cloud itself is aligned to the image axes and used to define the continuous 3D surface of the outer medulla. A mask that contains the R8 growth cones, the shell mask, is built as a slab centered around this surface. Through an iterative cross-correlation search in the rest of the time series, coordinates that most closely match a region-of-interest (ROI) near the center of the R8 array in the anchor stack are identified. An ellipsoidal mask is used to extract volumes-of-interest (VOIs) centered on these coordinates in each stack. Starting from the anchor stack and moving to either end of the time series, the VOIs are iteratively aligned to one another using rigid body transformations. The product of these transformations and the original rotation matrix bring the full time series into register with the anchor stack and align the medulla with the image axes. Growth cone segmentation is performed in a single stack from the registered series, the seed stack (45 hAPF). The seed stack is processed to reduce noise and local intensity variations, masked with the shell mask, and flattened as a MIP. A 2D growth cone template is generated and manually edited to refine the segmentation. The resulting segmented growth cone mask is used to define the 3D center of each growth cone in the seed stack. A refined surface for the outer medulla is computed using the growth cone centers and medulla column vectors for the growth cones are calculated as normals to the new surface. Growth cone tracking is carried out in a MIP representation of the time series, generated from medulla-registered stacks masked with the shell mask. The top-down view of the registered orientation minimizes overlap between R8 growth cones while the shell mask removes signal contribution from non-growth cone objects in the full image volume. Small 2D ROIs centered around each segmented growth cone in the seed stack are used to initiate a cross-correlation-based iterative search to find best matching regions in successive frames of the time series. XY tracks from this search are combined with Z coordinate information retained from the MIP generation step to compile the first-pass XYZT coordinates of the growth cone centers in the registered orientation. In growth cone alignment , the 4D positions of R8 growth cones are refined in the original orientation of the raw data. Starting with the seed stack, a template VOI for each growth cone is extracted from the 3D position and masked with a cylinder oriented along the medulla column vector calculated in the segmentation step. Masked target VOIs are extracted from the next stack in the series, using 3D coordinates from the tracking step and vectors corrected with the medulla transformation matrix. Target VOIs are aligned to template VOIs with rigid body transformations and the aligned target VOIs are re-cast as the templates for the next iteration of the operation (i.e. next stack). This process has two principal outputs: (1) Refined 4D positions and orientations of R8 growth cones, and (2) Masked MIP series of individually aligned growth cones (see Figure 1d ). To avoid reducing the spatial resolution of the MIP series, rotations about either axis of the imaging plane (XY) are suppressed during MIP generation. As a result, images shown under-represent the true 3D length of the R8 projections (see legend for Video 2 ). R8 tip position relative to the growth cone center is tracked automatically through each aligned series; this output is visually inspected and corrected, when necessary. The accuracy of automatic tracking increases with image quality and peaks at ~95%. Onset of transformation times were scored manually. Most image processing was done using custom software written in Matlab (Mathworks). Several critical scripts were sourced from the Mathworks File Exchange repository ( D’Errico, 2005 , 2009 , Kroon, 2008 ). Fiji (ImageJ) was used for batch stack processing and user-assisted tasks. Identifying target layer and tracking trendlines For each growth cone tip trace, a family of candidate trendlines was generated using data points within a moving window of 10–12 hr. For WT growth cones, a subset of the data in each window was selected by fitting a lower-bound cubic spline to the data. The complexity of the spline (i.e. number of cubic functions used) was increased until 30% of the data points were within 0.5 µm of the curve. These spline-proximal points were used to define a line using the Thiel-Sen estimator method. The intercept of the line was adjusted so as to give 90% of all the data in the time window positive residuals. For fra null growth cones, an upper-bound spline was fit to the data in each time window and, again, the complexity of the spline was increased until 30% of the data points were within 0.5 µm of the curve. The best-fit line to the spline-proximal points was refined using a 30% subset with the smallest standard deviation in their residuals to the line. For both classes of growth cones, the optimum trendline from among the candidates was selected using the product of three weight functions. The first two of these are normal distributions, which rank the slope and intercept of the trendlines based on parameters derived from the average tip trace curves of WT growth cones (e.g. blue mean and errors in Figure 5c ). The third is an exponential decay function that ranks the standard deviation of the residuals to each candidate trendline. This analysis was written in Matlab (Mathworks) with a critical script sourced form the Mathworks File Exchange repository ( D’Errico, 2009 ). Experimental genotypes Flies were reared at 25°C on standard cornmeal/molasses medium. Pupal development was staged relative to white pre-pupa formation (0 hAPF) or head eversion (12 hAPF). Main figures 1b, NetA Δ ,NetB::TM/+;; senseless-R::pest, GMR-RpdOUT-myr::tdTOM/+ Description: One of the maternal X chromosomes carries a myc-tagged membrane-tethered variant of NetB (NetB::TM) expressed form the native genomic locus of NetB, in a NetA deletion background ( Brankatschk and Dickson, 2006 ). Expression of GMR ( Hay et al., 1994 ) driven myr::tdTOM is controlled by sens-R::pest , resulting in genotype-independent labeling of ~70% of R8s and ~3% of R7s. 1e, W; Sp-Cyo/+; sens-R::pest, brp-RpdOUT-V5-2A-LexA, LexAop-myr::GFP/+ Description: The R recombinase ( Nern et al., 2011 ), under the control of the sens F2 fragment ( Pepple et al., 2008 ), removes the RpdOUT transcriptional and translational interruption cassette from the modified brp BAC (STaR system, RRID: BDSC_55760 ) ( Chen et al., 2014 ). The 3’ read-through and translation of the sequence downstream of the excised cassette leads to addition of the V5 epitope tag to Brp (not utilized in this experiment) and production of the LexA transcriptional activator as a discrete polypeptide. The expression domain of the sens F2 fragment is specific to R8s in the medulla; LexA driven myr::GFP labels ~70% of R8s and ~3% of R7s. 2a-d, same as 1e 2e, sens-FLP1/+; GMR-FRT-Stop-FRT-GAL4/+; brp-FlpdOUT-GFP-2A-LexA, UAS- FRT-Stop-FRT-myr::tdTOM/+ Description: FLP1 recombinase driven by the sens promoter fragment (RRID: BDSC_55768 ) excises the FRT-flanked transcriptional stop cassettes in the GAL4 and UAS elements, leading to myr::tdTOM expression in R8s. The stop cassette in the UAS element is not necessary for cell-specific labeling. The STaR element is included to visualize Brp puncta in the live preparation (not shown). 2f , Same as 1e 3, w; LexAop-myr::tdTOM, R25F07-LexAp65/+; senseless-R::pest, GMR-RpdOUT-myr::tdTOM/+ Description: R25F07-LexAp65 (RRID: BDSC_52703 ) drives expression of myr::tdTOM in Dm3 cells through pupal development into adulthood. R8-specific expression of myr::tdTOM achieved as in 1b. 4a , w; Sp-Cyo/+; sens-R::pest, brp-RpdOUT-V5-2A-LexA, LexAop-myr::GFP/+ Description: see 1e. 4b, ey 3.5 -FLP1/+; FRT42B, ACT-GAL80/FRT42B, fra 3 ; sens-GAL4, UAS-UtrnCH::GFP/ sens-R::pest, GMR-RpdOUT-myr::tdTOM Description: Variant of the MARCM genotype in 5a. The filamentous actin marker UtrnCH::GFP ( Burkel et al., 2007 ) (provided by Margot E. Quinlan) is driven by sens-GAL4 and positively labels fra 3 ( Kolodziej et al., 1996 ) R8s. Expression of GMR ( Hay et al., 1994 ) driven myr::tdTOM is controlled by sens-R::pest , resulting in genotype-independent labeling of ~70% of R8s and ~3% of R7s. 4c , w/Y; sens-GAL4/+; sens-R::pest, brp-RpdOUT-V5-2A-LexA, LexAop-myr::GFP/UAS-fra RNAi (DRSC HMS01147) Description: The three elements on the third chromosome use the STaR system to label ~70% of R8s with myr::GFP (see genotype description for 1e). sens -GAL4 drives expression of the short hairpin RNAi construct directed at fra (RRID: BDSC_40826 ). 4d, w, NetAB ΔGN /Y; sens-GAL4/+; sens-R::pest, brp-RpdOUT-V5-2A-LexA, LexAop-myr::GFP/TM2 Description: The three elements on the third chromosome use the STaR system to label ~70% of R8s with myr::GFP (see genotype description for 1e). sens -GAL4 is included as a genetic background control for the fra-Net epistasis experiment. 4e, w, NetAB ΔGN /Y; sens-GAL4/+; sens-R::pest, brp-RpdOUT-V5-2A-LexA, LexAop-myr::GFP/ UAS-fra RNAi (DRSC HMS01147) Description: See genotype description for 4d. 4f , Net: Same as 4d.; Net +fraRNAi: Same as 4e 4g,H,i, WT: w/Y; UAS-myr::tdTOM/Sp; sens-R::pest, brp-RpdOUT-V5-2A-LexA, LexAop-myr::GFP/R23G11-GAL4 Net : w, NetAB ΔGN /Y; UAS-myr::tdTOM/+; sens-R::pest, brp-RpdOUT-V5-2A-LexA, LexAop-myr::GFP/R23G11-GAL4 Description: The three elements on the third chromosome use the STaR system to label ~70% of R8s with myr::GFP (see genotype description for 1e). R23G11-GAL4 (RRID: BDSC_49043 ) drives expression of myr::tdTOM in Dm4 cells in the adult ( Nern et al., 2015 ). 4j, Dm1-WT: Similar to 4g-WT with R22D12-GAL4 (RRID: BDSC_48983 ) driving Dm1 specific expression ( Nern et al., 2015 ). Dm1- Net: Similar to 4g - Net with R22D12-GAL4 (RRID: BDSC_48983 ) driving Dm1 specific expression. Dm6-WT: Similar to 4g -WT with R38H06-GAL4 (RRID: BDSC_50029 ) driving Dm6 specific expression ( Nern et al., 2015 ). Dm6- Net: Similar to 4g - Net with R38H06-GAL4 (RRID: BDSC_50029 ) driving Dm6 specific expression. 5a-c,f-j, ey 3.5 -FLP1/+; FRT42B, ACT-GAL80/FRT42B, fra 3 ; sens-GAL4, UAS-myr::tdTOM/ sens-R::pest, brp-RpdOUT-V5-2A-LexA, LexAop-myr::GFP Description: Mitotic recombination in the visual system in this MARCM ( Lee and Luo, 1999 ) genotype was driven by FLP1 recombinase ( Nern et al., 2011 ) under the control of the ey-3.5 promoter fragment ( Bazigou et al., 2007 ). The pairing of the ey-3.5 promoter with this higher efficiency variant of FLP largely preserves its specificity in the eye disc; in ~15% of the optic lobes we also noted recombination in lamina and medulla cell precursors. In our analysis, we did not detect a subclass of fra R8s with alternate developmental progression, suggesting that the possible existence of sporadic fra mutants of other cell classes does not change our main conclusions. The ACT-GAL80 element is based on a new actin-derived pan-cell promoter (provided by Barret Pfeiffer, Rubin Lab, Janelia Farm Research Campus/HHMI). fra R8s are labeled with myr::tdTOM (not shown). STaR system is used to drive genotype-independent expression of myr::GFP in ~70% of R8s (see genotype description for 1d). 5d, same as 4b 5e, Data compiled from two MARCM genotypes: ey 3.5 -FLP1/+; FRT42B, ACT-GAL80/FRT42B, fra 3 ; sens-GAL4, UAS-myr::tdTOM/ sens-R::pest, brp-RpdOUT-V5-2A-LexA, LexAop-myr::GFP , and ey 3.5 -FLP1/+; FRT42B, ACT-GAL80/FRT42B, fra 3 ; sens-GAL4, UAS-UtrnCH::GFP/ sens-R::pest, GMR-RpdOUT-myr::tdTOM 6, w, NetAB ΔGN /Y; Sp-+/+; sens-R::pest, GMR-RpdOUT-myr::tdTOM/+ Description: R8-specific expression of myr::tdTOM achieved as in 1b. 7a , ey 3.5 -FLP1/+; ACT-GAL80, FRT40A/FRT40A; sens-GAL4, UAS-UtrnCH::GFP/ TM2 7b, ey 3.5 -FLP1/+; ACT-GAL80, FRT40A/Trim9 91 , FRT40A; sens-GAL4, UAS-UtrnCH::GFP/ Ly 7c , ey 3.5 -FLP1/+; ACT-GAL80, FRT40A/FRT40A; sens-GAL4, UAS-UtrnCH::GFP/ UAS-fra RNAi (DRSC HMS01147) 7d, ey 3.5 -FLP1/+; ACT-GAL80, FRT40A/Trim9 91 ,FRT40A; sens-GAL4, UAS-UtrnCH::GFP/ UAS-fra RNAi (DRSC HMS01147) 7e, Trim9 null : Same as 7b.; Trim9 null + fraRNAi: Same as 7d. 7f , ey 3.5 -FLP1/+; ACT-GAL80, FRT40A/Trim9 91 , FRT40A; sens-GAL4, UAS-myr::tdTOM/ sens-R::pest, brp-RpdOUT-V5-2A-LexA, LexAop-myr::GFP Description: FRT40A variant of the MARCM genotype in 5a. Figure supplements Figure1-F.s.1, Same as 1e. Figure3-F.s.1, Same as 3. Figure5-F.s.1a,d, Same as 4b. Figure5-F.s.1c, Same as 5a. Figure5-F.s.1b,e, Same as 5e. Figure5-F.s.2, Same as 5a.
Experimental genotypes Flies were reared at 25°C on standard cornmeal/molasses medium. Pupal development was staged relative to white pre-pupa formation (0 hAPF) or head eversion (12 hAPF). Main figures 1b, NetA Δ ,NetB::TM/+;; senseless-R::pest, GMR-RpdOUT-myr::tdTOM/+ Description: One of the maternal X chromosomes carries a myc-tagged membrane-tethered variant of NetB (NetB::TM) expressed form the native genomic locus of NetB, in a NetA deletion background ( Brankatschk and Dickson, 2006 ). Expression of GMR ( Hay et al., 1994 ) driven myr::tdTOM is controlled by sens-R::pest , resulting in genotype-independent labeling of ~70% of R8s and ~3% of R7s. 1e, W; Sp-Cyo/+; sens-R::pest, brp-RpdOUT-V5-2A-LexA, LexAop-myr::GFP/+ Description: The R recombinase ( Nern et al., 2011 ), under the control of the sens F2 fragment ( Pepple et al., 2008 ), removes the RpdOUT transcriptional and translational interruption cassette from the modified brp BAC (STaR system, RRID: BDSC_55760 ) ( Chen et al., 2014 ). The 3’ read-through and translation of the sequence downstream of the excised cassette leads to addition of the V5 epitope tag to Brp (not utilized in this experiment) and production of the LexA transcriptional activator as a discrete polypeptide. The expression domain of the sens F2 fragment is specific to R8s in the medulla; LexA driven myr::GFP labels ~70% of R8s and ~3% of R7s. 2a-d, same as 1e 2e, sens-FLP1/+; GMR-FRT-Stop-FRT-GAL4/+; brp-FlpdOUT-GFP-2A-LexA, UAS- FRT-Stop-FRT-myr::tdTOM/+ Description: FLP1 recombinase driven by the sens promoter fragment (RRID: BDSC_55768 ) excises the FRT-flanked transcriptional stop cassettes in the GAL4 and UAS elements, leading to myr::tdTOM expression in R8s. The stop cassette in the UAS element is not necessary for cell-specific labeling. The STaR element is included to visualize Brp puncta in the live preparation (not shown). 2f , Same as 1e 3, w; LexAop-myr::tdTOM, R25F07-LexAp65/+; senseless-R::pest, GMR-RpdOUT-myr::tdTOM/+ Description: R25F07-LexAp65 (RRID: BDSC_52703 ) drives expression of myr::tdTOM in Dm3 cells through pupal development into adulthood. R8-specific expression of myr::tdTOM achieved as in 1b. 4a , w; Sp-Cyo/+; sens-R::pest, brp-RpdOUT-V5-2A-LexA, LexAop-myr::GFP/+ Description: see 1e. 4b, ey 3.5 -FLP1/+; FRT42B, ACT-GAL80/FRT42B, fra 3 ; sens-GAL4, UAS-UtrnCH::GFP/ sens-R::pest, GMR-RpdOUT-myr::tdTOM Description: Variant of the MARCM genotype in 5a. The filamentous actin marker UtrnCH::GFP ( Burkel et al., 2007 ) (provided by Margot E. Quinlan) is driven by sens-GAL4 and positively labels fra 3 ( Kolodziej et al., 1996 ) R8s. Expression of GMR ( Hay et al., 1994 ) driven myr::tdTOM is controlled by sens-R::pest , resulting in genotype-independent labeling of ~70% of R8s and ~3% of R7s. 4c , w/Y; sens-GAL4/+; sens-R::pest, brp-RpdOUT-V5-2A-LexA, LexAop-myr::GFP/UAS-fra RNAi (DRSC HMS01147) Description: The three elements on the third chromosome use the STaR system to label ~70% of R8s with myr::GFP (see genotype description for 1e). sens -GAL4 drives expression of the short hairpin RNAi construct directed at fra (RRID: BDSC_40826 ). 4d, w, NetAB ΔGN /Y; sens-GAL4/+; sens-R::pest, brp-RpdOUT-V5-2A-LexA, LexAop-myr::GFP/TM2 Description: The three elements on the third chromosome use the STaR system to label ~70% of R8s with myr::GFP (see genotype description for 1e). sens -GAL4 is included as a genetic background control for the fra-Net epistasis experiment. 4e, w, NetAB ΔGN /Y; sens-GAL4/+; sens-R::pest, brp-RpdOUT-V5-2A-LexA, LexAop-myr::GFP/ UAS-fra RNAi (DRSC HMS01147) Description: See genotype description for 4d. 4f , Net: Same as 4d.; Net +fraRNAi: Same as 4e 4g,H,i, WT: w/Y; UAS-myr::tdTOM/Sp; sens-R::pest, brp-RpdOUT-V5-2A-LexA, LexAop-myr::GFP/R23G11-GAL4 Net : w, NetAB ΔGN /Y; UAS-myr::tdTOM/+; sens-R::pest, brp-RpdOUT-V5-2A-LexA, LexAop-myr::GFP/R23G11-GAL4 Description: The three elements on the third chromosome use the STaR system to label ~70% of R8s with myr::GFP (see genotype description for 1e). R23G11-GAL4 (RRID: BDSC_49043 ) drives expression of myr::tdTOM in Dm4 cells in the adult ( Nern et al., 2015 ). 4j, Dm1-WT: Similar to 4g-WT with R22D12-GAL4 (RRID: BDSC_48983 ) driving Dm1 specific expression ( Nern et al., 2015 ). Dm1- Net: Similar to 4g - Net with R22D12-GAL4 (RRID: BDSC_48983 ) driving Dm1 specific expression. Dm6-WT: Similar to 4g -WT with R38H06-GAL4 (RRID: BDSC_50029 ) driving Dm6 specific expression ( Nern et al., 2015 ). Dm6- Net: Similar to 4g - Net with R38H06-GAL4 (RRID: BDSC_50029 ) driving Dm6 specific expression. 5a-c,f-j, ey 3.5 -FLP1/+; FRT42B, ACT-GAL80/FRT42B, fra 3 ; sens-GAL4, UAS-myr::tdTOM/ sens-R::pest, brp-RpdOUT-V5-2A-LexA, LexAop-myr::GFP Description: Mitotic recombination in the visual system in this MARCM ( Lee and Luo, 1999 ) genotype was driven by FLP1 recombinase ( Nern et al., 2011 ) under the control of the ey-3.5 promoter fragment ( Bazigou et al., 2007 ). The pairing of the ey-3.5 promoter with this higher efficiency variant of FLP largely preserves its specificity in the eye disc; in ~15% of the optic lobes we also noted recombination in lamina and medulla cell precursors. In our analysis, we did not detect a subclass of fra R8s with alternate developmental progression, suggesting that the possible existence of sporadic fra mutants of other cell classes does not change our main conclusions. The ACT-GAL80 element is based on a new actin-derived pan-cell promoter (provided by Barret Pfeiffer, Rubin Lab, Janelia Farm Research Campus/HHMI). fra R8s are labeled with myr::tdTOM (not shown). STaR system is used to drive genotype-independent expression of myr::GFP in ~70% of R8s (see genotype description for 1d). 5d, same as 4b 5e, Data compiled from two MARCM genotypes: ey 3.5 -FLP1/+; FRT42B, ACT-GAL80/FRT42B, fra 3 ; sens-GAL4, UAS-myr::tdTOM/ sens-R::pest, brp-RpdOUT-V5-2A-LexA, LexAop-myr::GFP , and ey 3.5 -FLP1/+; FRT42B, ACT-GAL80/FRT42B, fra 3 ; sens-GAL4, UAS-UtrnCH::GFP/ sens-R::pest, GMR-RpdOUT-myr::tdTOM 6, w, NetAB ΔGN /Y; Sp-+/+; sens-R::pest, GMR-RpdOUT-myr::tdTOM/+ Description: R8-specific expression of myr::tdTOM achieved as in 1b. 7a , ey 3.5 -FLP1/+; ACT-GAL80, FRT40A/FRT40A; sens-GAL4, UAS-UtrnCH::GFP/ TM2 7b, ey 3.5 -FLP1/+; ACT-GAL80, FRT40A/Trim9 91 , FRT40A; sens-GAL4, UAS-UtrnCH::GFP/ Ly 7c , ey 3.5 -FLP1/+; ACT-GAL80, FRT40A/FRT40A; sens-GAL4, UAS-UtrnCH::GFP/ UAS-fra RNAi (DRSC HMS01147) 7d, ey 3.5 -FLP1/+; ACT-GAL80, FRT40A/Trim9 91 ,FRT40A; sens-GAL4, UAS-UtrnCH::GFP/ UAS-fra RNAi (DRSC HMS01147) 7e, Trim9 null : Same as 7b.; Trim9 null + fraRNAi: Same as 7d. 7f , ey 3.5 -FLP1/+; ACT-GAL80, FRT40A/Trim9 91 , FRT40A; sens-GAL4, UAS-myr::tdTOM/ sens-R::pest, brp-RpdOUT-V5-2A-LexA, LexAop-myr::GFP Description: FRT40A variant of the MARCM genotype in 5a. Figure supplements Figure1-F.s.1, Same as 1e. Figure3-F.s.1, Same as 3. Figure5-F.s.1a,d, Same as 4b. Figure5-F.s.1c, Same as 5a. Figure5-F.s.1b,e, Same as 5e. Figure5-F.s.2, Same as 5a.
📊 Figures
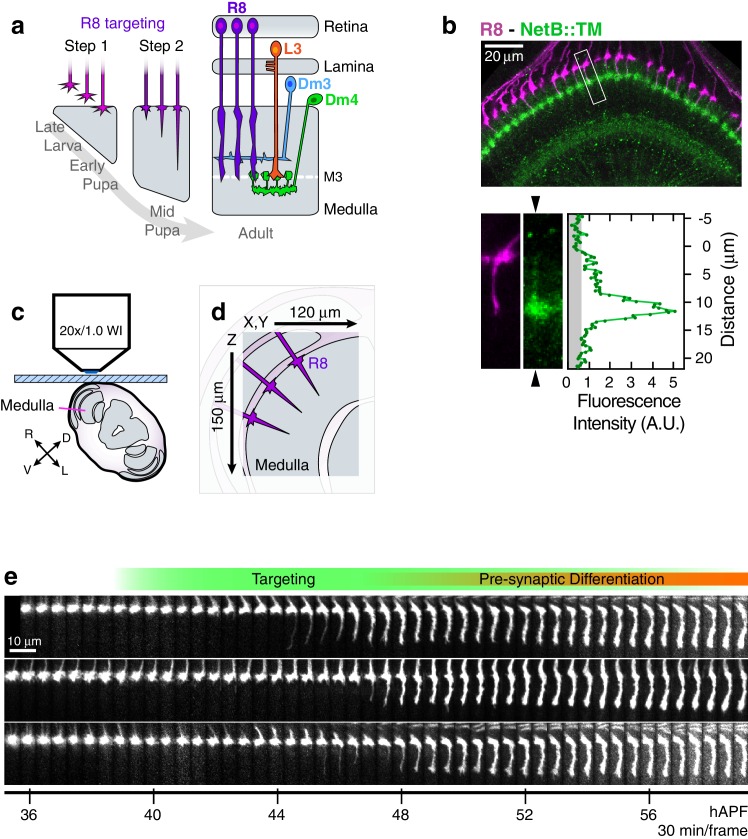
Figure 1.
Live imaging of R8 growth cones in the developing fly brain.
( a ) Schematic of R8 targeting. ( b ), Top panel: Confocal micrograph of the medulla at 45 hAPF in a fly expressing a membrane-tethered variant of NetB (NetB::TM) from the NetB genomic locus. R8s (ma...
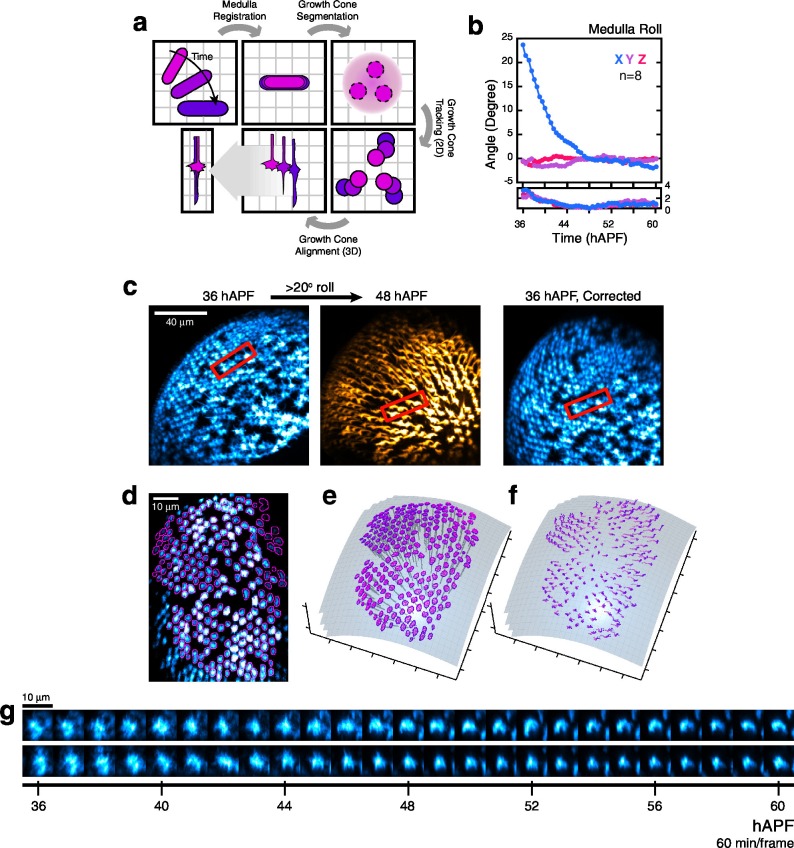
Figure 1u2014figure supplement 1.
Processing 2-photon time series.
( a )u00a0Major steps of the image processing work-flow: Medulla Registration: The R8 array is treated as a rigid body to correct for developmental movement. Segmentation: One stack is used to perform...
Video 1.
Medulla Registration.
The developmental roll of the medulla is corrected in preparation for growth cone segmentation and tracking. DOI: http://dx.doi.org/10.7554/eLife.20762.007
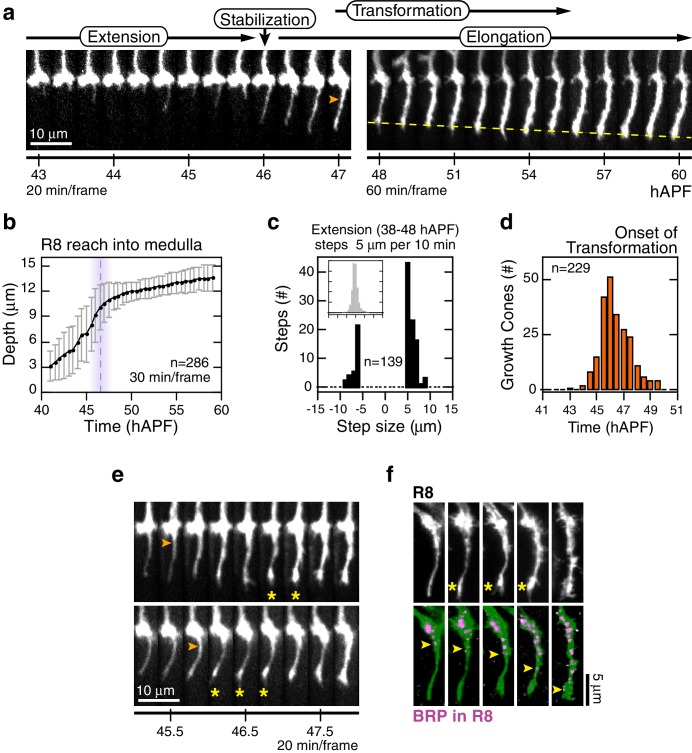
Figure 2.
Wild-type R8 targeting.
( a ) Steps of WT targeting. Orange arrowhead marks the onset of transformation . Dashed yellow line marks R8 depth through elongation . See also Figure 3u2014figure supplement 1b for an illustration ...
Video 2.
Aligned WT Growth Cones.R8 growth cones are aligned through the time series and extracted from the full image volumes. myr::tdTOM expressing WT growth cones from one brain are shown.
DOI: http://dx.doi.org/10.7554/eLife.20762.010
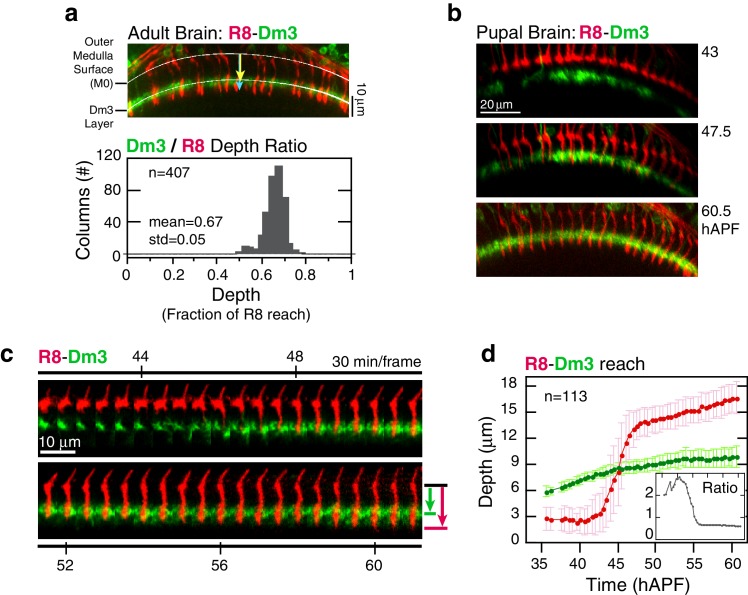
Figure 3.
Analysis of elongation .
( a ) Panel: Confocal micrograph of the outer medulla in the adult brain. R8s (red, myr::tdTOM) and Dm3s (green, myr::GFP) are shown. White arcs are fits to M0 and to the Dm3 processes. Arrows, yellow...
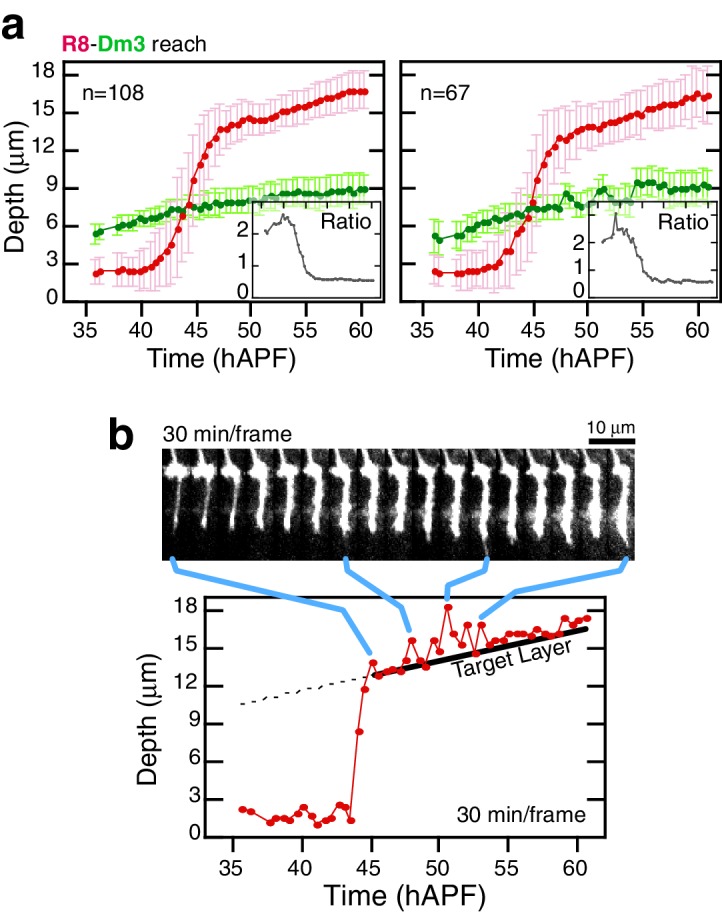
Figure 3u2014figure supplement 1.
Analysis of elongation.
( a ) Data from two additional brains analyzed as in Figure 3d . ( b ), Intensity saturated time series highlights transient projections from the target layer during elongation. Tip trace is plotted b...
Video 3.
Two Channel Imaging of R8 and Dm3.
Live imaging of R8 (myr::tdTOM) and Dm3 (myr::GFP). DOI: http://dx.doi.org/10.7554/eLife.20762.015
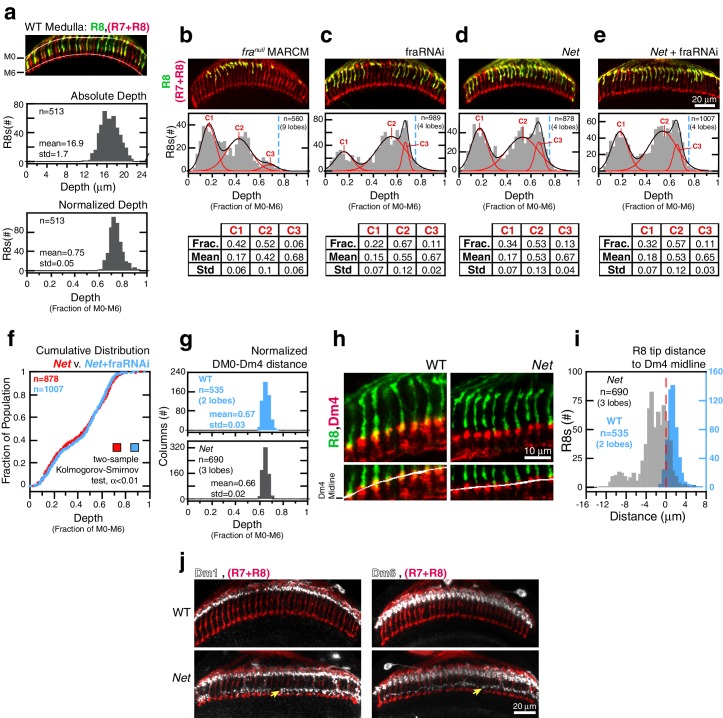
Figure 4.
Fra and Net are in the same genetic pathway for R8 targeting.
( a ) Panel: Confocal micrograph of outer medulla. R8s (green, ~70% expressing myr::GFP) and all R cells (red, labeled with Mab24B10) are shown. Graphs: Absolute (top) and normalized (bottom) distance...
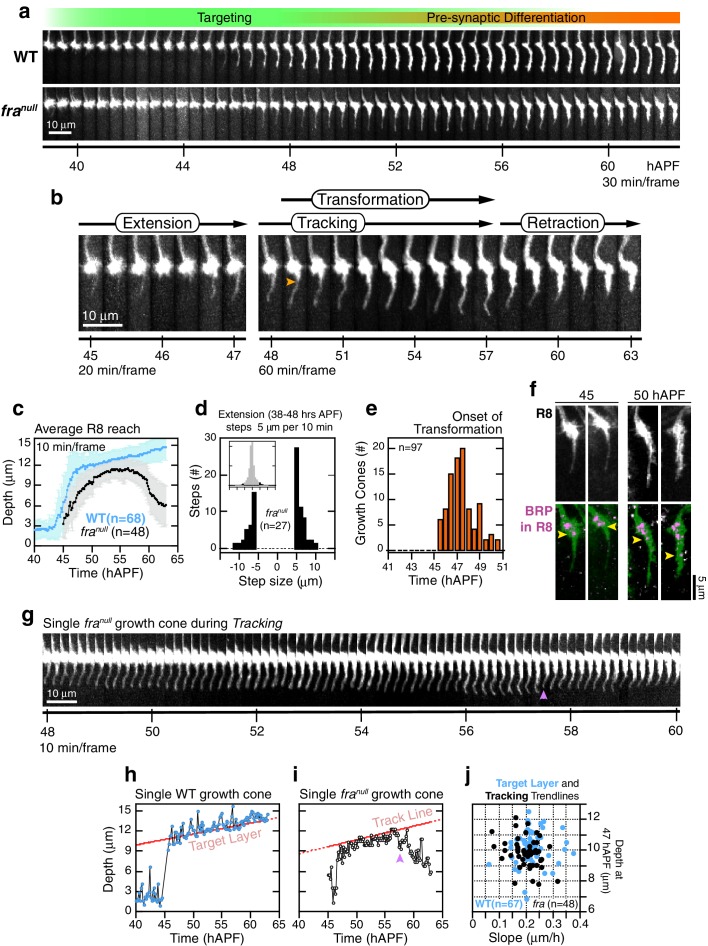
Figure 5.
fra null R8 targeting.
( a ) Wild-type and fra null growth cones from the same mosaic brain. ( b ) Steps of fra null targeting. Orange arrowhead marks the onset of transformation . ( c ) Data for WT and fra null R8s from th...
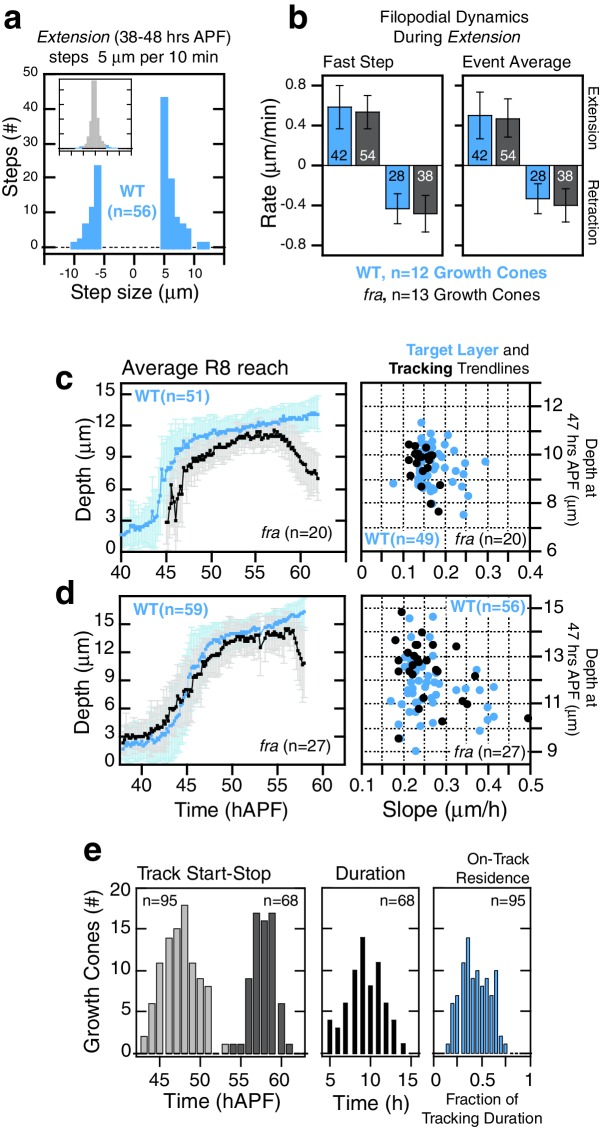
Figure 5u2014figure supplement 1.
fra null R8 targeting.
( a , b ) Extension dynamics are not altered in fra null R8s. ( a ) shows counts of frame-to-frame (u2206tu00a0=u00a010 min) tip movements equal to or greater thanu00a0u00b15 u00b5m for WT R8s from th...
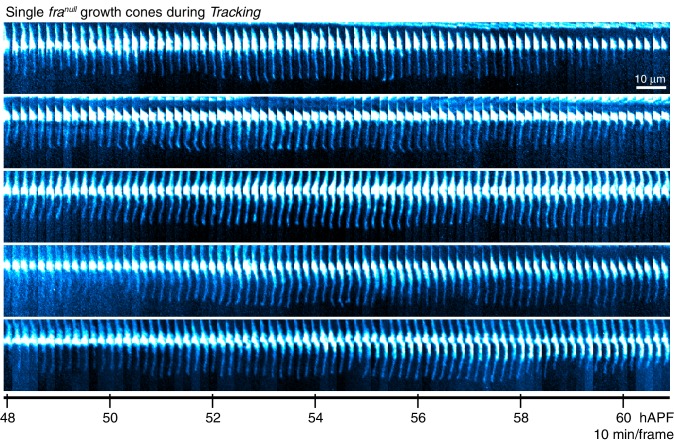
Figure 5u2014figure supplement 2.
fra null dynamics during tracking
Single fra null growth cones presented at full time resolution.Images are shown with a cyan-hot look-up table to increase displayed dynamic range. DOI: http://dx.doi.org/10.7554/eLife.20762.022
Video 4.
Two Channel Imaging of WT and fra R8s with MARCM.
Dual labeling of all (myr::tdTOM, red) and fra ufeffnull (UtrnCH::GFP, green) R8s reveals dynamics of wild-type and mutant growth cones in the same MARCM brain. DOI: http://dx.doi.org/10.7554/eLife.20...
Video 5.
Aligned fra null Growth Cones
R8 growth cones are aligned through the time series and extracted from the full image volumes. myr::tdTOM expressing fra null growth cones from one brain are shown. DOI: http://dx.doi.org/10.7554/eLif...
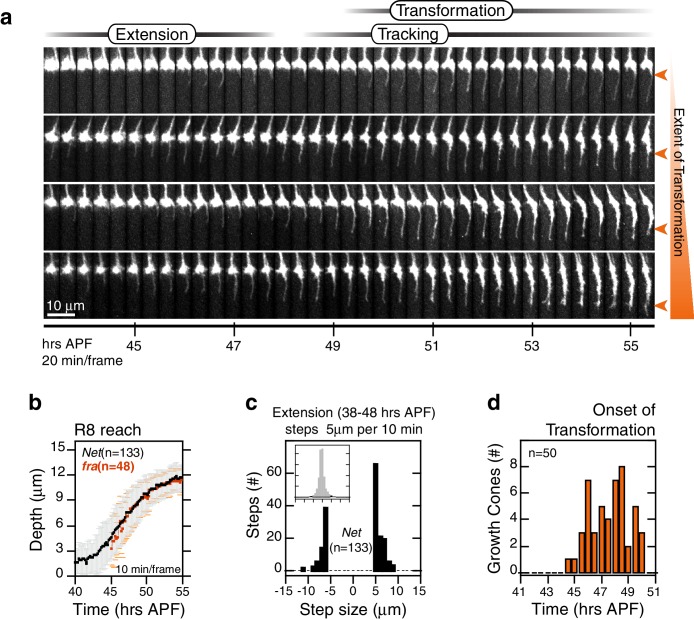
Figure 6.
R8 targeting in Net mutants.
( a ) Four growth cones from the same Net null mutant brain. Orange arrowheads mark the extent of transformation at the end of the time series in this data set; this determines the final R8 depth afte...
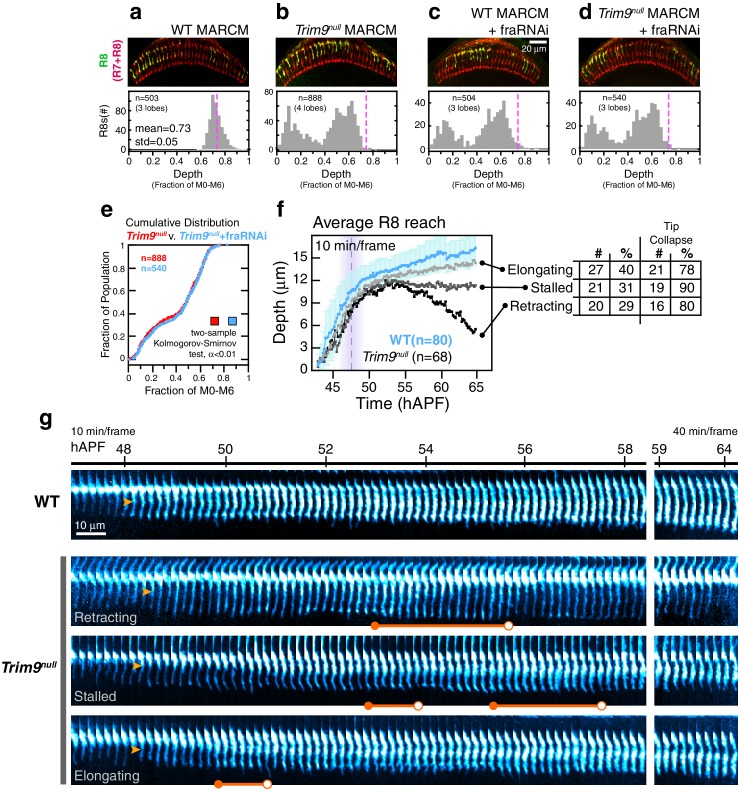
Figure 7.
Trim9 null R8 targeting.
( a ) Panel: Confocal micrograph of outer medulla in a WT MARCM brain. MARCM labeled WT R8s (green, expressing UtrnCH::GFP) and all R cells (red, labeled with Mab24B10) are shown. Graph: Normalized R8...
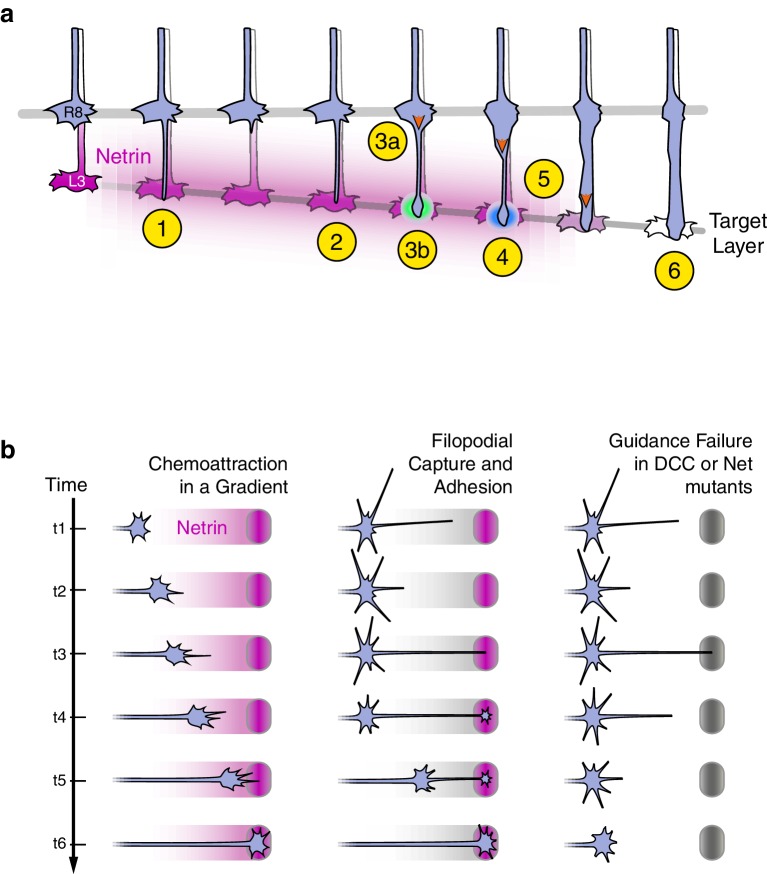
Figure 8.
Axon guidance through Net-DCC-mediated adhesion.
( a ) Net-Fra signaling in the second step of R8 targeting: (1) Extension of thin process into medulla, Net-Fra independent. (2) Target layer recognition, Net-Fra independent. (3a) Onset of transforma...
Figure images are served from the NIH/NLM PubMed Central Open Access Subset or Europe PMC; copyright remains with the publishers and authors.
💬 Discussion
0 commentsNo comments yet. Be the first to start a discussion!
Leave a Comment