Abstract
The fabrication of fungicides in cost-effective and eco-friendly ways is particularly important for agriculture. Plant pathogenic fungi produce many economic and ecological problems worldwide, which must be controlled with potent fungicides. Here we propose the green synthesis of fungicides, which consist of copper nanoparticles (Cu-NPs) prepared in aqueous media. Through in vitro experiments, the antifungal efficacy against Fusarium solani, Neofusicoccum sp., and Fusarium oxysporum was investigated. Although the antifungal activity differs for each fungal species, it was found that the Cu-NPs induce strong morphological changes in the mycelium. Additionally, the damage of the cell membranes of the pathogens was revealed by microscopic observations. For the three evaluated fungi, fluorescence microscopy demonstrated the intracellular generation of reactive oxygen species in the mycelium. This work proves that the green-synthesized Cu-NPs are potential fungicides against F. solani, Neofusicoccum sp., and F. oxysporum.
🔬 Techniques
🔭 Microscopes
💻 Software
✨ Fluorophores
🧪 Sample Preparation
🏭 Microscope Brands
💻 Software Details
🏛️ Research Organizations (ROR)
Affiliated research institutions:
📋 Methods
2.1.
Synthesis and characterization of the copper nanoparticles
All the chemicals were of analytical grade and were used without further purification. The Cu-NPs were synthesized as follows: 2.5 g of sodium citrate tribasic dihydrate was dissolved in 100 mL of distilled water and then 5 g of copper( ii ) sulfate pentahydrate was added. Next, 50 mL of a solution of ascorbic acid (0.2 M) and 30 mL of a solution of sodium hydroxide (1 M) were added under stirring. Afterward, the mixture was heated at 95 °C for 90 min at the open atmosphere. After this time, a precipitate red in color is formed, which indicates the formation of Cu-NPs. Using centrifugation, the precipitate was washed three times with distilled water and one time with ethanol. The obtained powder was dried at room temperature for 48 h. The crystal structure of the Cu-NPs was characterized by X-ray diffraction (XRD) using a Bruker X-ray diffractometer, operating in the Bragg–Brentano geometry and equipped with a Cu-anode X-ray source (Kα, λ = 0.15418 nm). The patterns were collected with a scan rate of 0.04° s −1 in the 20–90° 2 θ range. The XRD patterns were indexed using the powder diffraction files (PDF) database, and Rietveld refinement was done using the MAUD program v. 2.33. 22 Transmission electron microscopy (TEM) studies were done in a JEOL JEM-2000EX microscope with an accelerating voltage of 200 kV. Samples for TEM measurements were suspended in ethanol and ultrasonically dispersed. Then drops of the suspensions were placed on a nickel grid coated with carbon and the solvent was evaporated prior to TEM observations. The X-ray photoelectron spectroscopy (XPS) analysis was performed with a model K-Alpha equipment from Thermo Scientific Instruments, which employed a monochromatic Al Kα radiation ( E = 1486.68 eV) with a resolution of 0.1 eV. 2.2.
Show full methods section
2.1.
Synthesis and characterization of the copper nanoparticles
All the chemicals were of analytical grade and were used without further purification. The Cu-NPs were synthesized as follows: 2.5 g of sodium citrate tribasic dihydrate was dissolved in 100 mL of distilled water and then 5 g of copper( ii ) sulfate pentahydrate was added. Next, 50 mL of a solution of ascorbic acid (0.2 M) and 30 mL of a solution of sodium hydroxide (1 M) were added under stirring. Afterward, the mixture was heated at 95 °C for 90 min at the open atmosphere. After this time, a precipitate red in color is formed, which indicates the formation of Cu-NPs. Using centrifugation, the precipitate was washed three times with distilled water and one time with ethanol. The obtained powder was dried at room temperature for 48 h. The crystal structure of the Cu-NPs was characterized by X-ray diffraction (XRD) using a Bruker X-ray diffractometer, operating in the Bragg–Brentano geometry and equipped with a Cu-anode X-ray source (Kα, λ = 0.15418 nm). The patterns were collected with a scan rate of 0.04° s −1 in the 20–90° 2 θ range. The XRD patterns were indexed using the powder diffraction files (PDF) database, and Rietveld refinement was done using the MAUD program v. 2.33. 22 Transmission electron microscopy (TEM) studies were done in a JEOL JEM-2000EX microscope with an accelerating voltage of 200 kV. Samples for TEM measurements were suspended in ethanol and ultrasonically dispersed. Then drops of the suspensions were placed on a nickel grid coated with carbon and the solvent was evaporated prior to TEM observations. The X-ray photoelectron spectroscopy (XPS) analysis was performed with a model K-Alpha equipment from Thermo Scientific Instruments, which employed a monochromatic Al Kα radiation ( E = 1486.68 eV) with a resolution of 0.1 eV. 2.2.
Assessment of antifungal activity of Cu-NPs on mycelial radial growth
The antifungal activity of the Cu-NPs was evaluated against Fusarium solani (strain INECOL_BM-04), Neofusicoccum sp. (strain INECOL_BM-03), and Fusarium oxysporum (strain INECOL_CBF-185). Those species were kindly provided by the Laboratories of Molecular Biology and Biologic Control of the Institute of Ecology A. C., Xalapa, Veracruz, Mexico. To determine the inhibition of mycelial growth of the fungi, the fungal samples were incubated in potato dextrose agar (PDA) mixed with different amounts of Cu-NPs. The final concentrations of Cu-NPs in the growth media were: 0, 0.1, 0.25, 0.5, 0.75 and 1.0 mg mL −1 . Finally, suspensions of 1 × 10 6 CFU mL −1 cells were inoculated at the center of each fresh PDA solid media, followed by the incubation at 29 °C for 6 days. PDA plates without Cu-NPs were used as controls, using the same grown conditions for each pathogenic fungus. Each treatment was carried out in triplicates. The photographic record and the radial colony growth were measured after 6 days and the percentage of fungal inhibition was calculated based on the percent inhibition of radial growth (IRG) as a follow: where R 1 is the radial growth of the control and R 2 is the radial growth for each treatment. The IRG data were analyzed using the mean standard deviation. 2.3.
Analysis of fungal morphology through field emission scanning electron microscopy
The growth morphology was studied in six-day-old fungal cultures for the three species (controls and the Cu-NPs treatments). For these studies, the mycelial discs were cut from the peripheral in a 10 × 10 mm 2 area and fixed with 2.5% glutaraldehyde at 4 °C for 24 h. Subsequently, the samples were washed with Sorensen phosphate buffer three times for 1 min. Then, the samples were dehydrated in a graded series of ethanol, started with gradual dehydration in ethanol from 30, 40, 50, 60, 70, 80 to 90% for 40 min in each aqueous solution. The last step was performed in 100% ethanol for 30 min thrice. The dehydrated samples were dried in a Quorum K850 critical point dryer and placed in aluminum specimens on double adhesive carbon conductive tape and finally gold-coated for one minute in a Quorum Q150R S coater. 23 Finally, the samples were observed in a scanning electron microscope (SEM) FEI Quanta 250 FEG. 2.4.
Analysis of viability through confocal microscopy
To investigate the effect of Cu-NPs on cell viability, propidium iodide (PI) was used. It has been reported that PI forms a bright red fluorescent complex with DNA and RNA in the nuclei of dying or dead cells but not in healthy cells, it is because PI overcome damaged cell membranes. 24 The viability was studied in six days old mycelia for the fungi treated with 0.5 mg mL −1 of Cu-NPs. Firstly, each mycelium was re-suspended in 1 mL of Tris-KCl solution and later treated in 1 mL of PI (final concentration of 5 μg mL −1 ) for 10 min under dark conditions. Stained cells were washed thrice with a Tris-KCl solution. On the other hand, to show the accumulation of reactive oxygen species (ROS) in the mycelia, the 2′,7′-dichlorofluorescein diacetate (DCFH-DA) assay was conducted. DCFH-DA reacts with ROS to produce a bright green fluorescence. Fluorescence images were observed using confocal laser scanning microscopy (CLSM) using a Leica TCS SP8 microscope, where the confocal setup is based on a DMI6000 inverted microscope. The images were taken using an excitation/emission wavelength of 536/617 and 488/530 nm for IP and DCFH-DA tests, respectively. 2.5.
Statistical analysis
All fungal growth assays were carried out in triplicate and the data are presented as the mean standard deviation. One-way analysis of variance (ANOVA) was performed to compare the treated group and the controls (without Cu-NPs), followed by Tukey's post hoc tests using Origin 9.0 software. Statistical differences were considered significant at p < 0.05.
📊 Figures
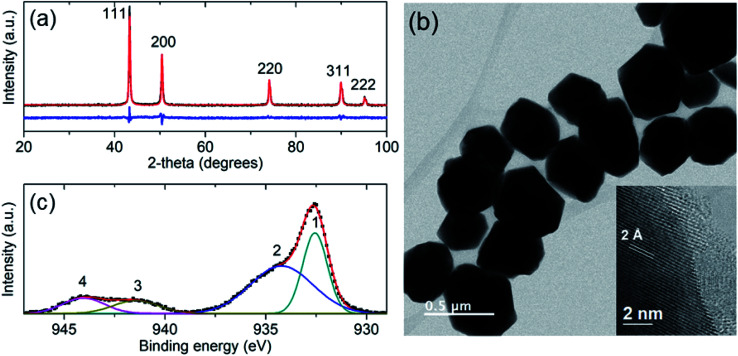
Fig. 1
(a) X-ray diffraction pattern of Cu-NPs. (b) TEM micrograph of the Cu-NPs, the inset shows a high resolution TEM image of the border of a Cu-NP. (c) The fitted XPS spectrum of the Cu-NPs.
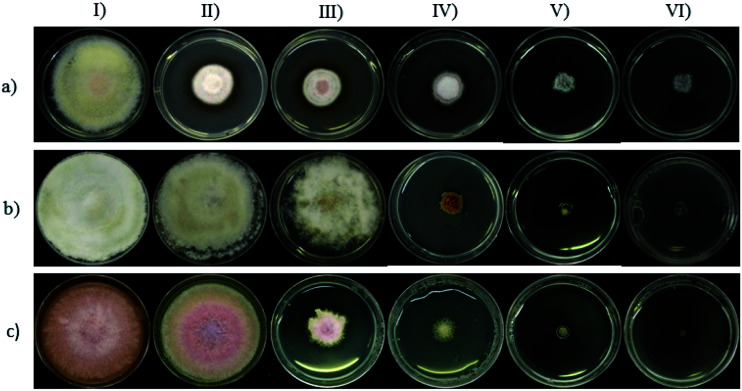
Fig. 2
Antifungal activity of Cu-NPs against: (a) Fusarium solani , (b) Neofusicoccum sp. and (c) Fusarium oxysporum . The columns indicate different concentrations of Cu-NPs: (I) 0 (controls), (II) 0.1, (III) 0.25, (IV) 0.5, (V) 0.75 and (VI) 1.0 mg mL u22121 of Cu-NPs.
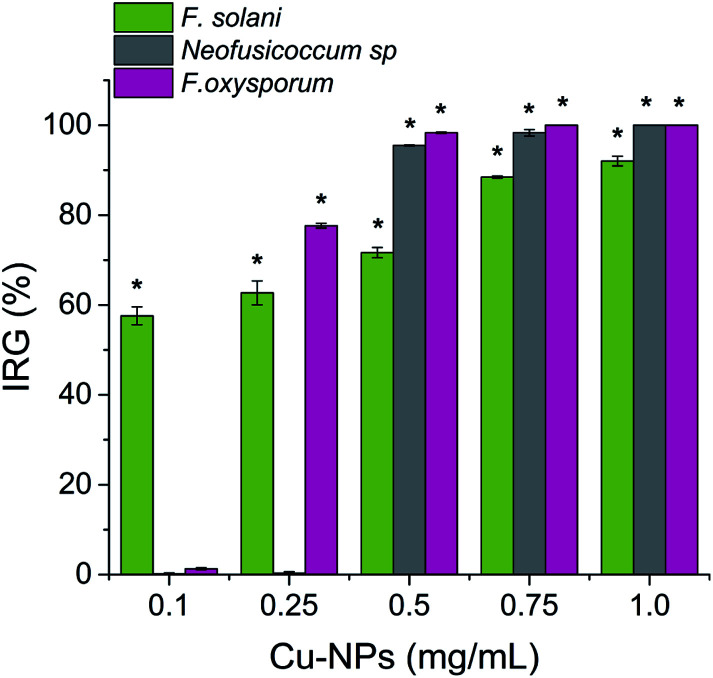
Fig. 3
Inhibition of radial growth (IRG) (%) of Cu-NPs against Fusarium solani , Neofusicoccum sp., and Fusarium oxysporum . The quantitative data are expressed as the mean u00b1 SD ( n = 3). (*) indicates significant differences ( P < 0.05) in comparison to their controls (treatments without Cu-NPs).
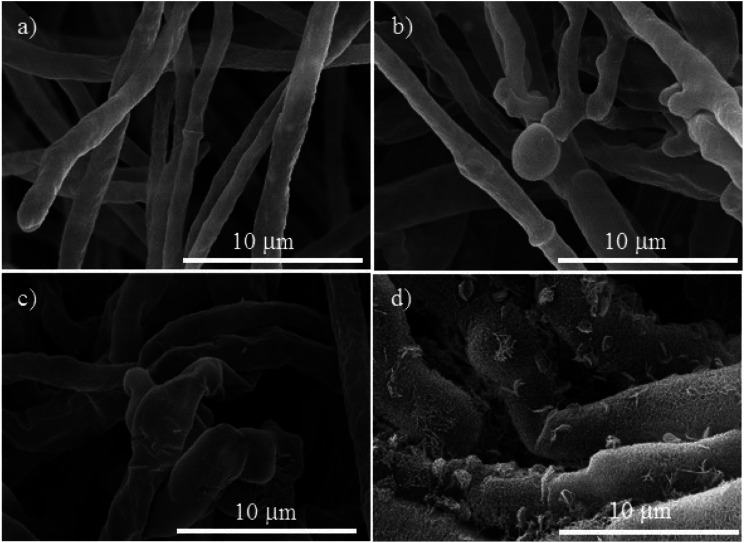
Fig. 4
SEM micrographs of Fusarium solani , (a) control. The treatments with different concentrations of Cu-NPs: (b) 0.1 mg mL u22121 , (c) 0.25 mg mL u22121 , and (d) 0.5 mg mL u22121 .
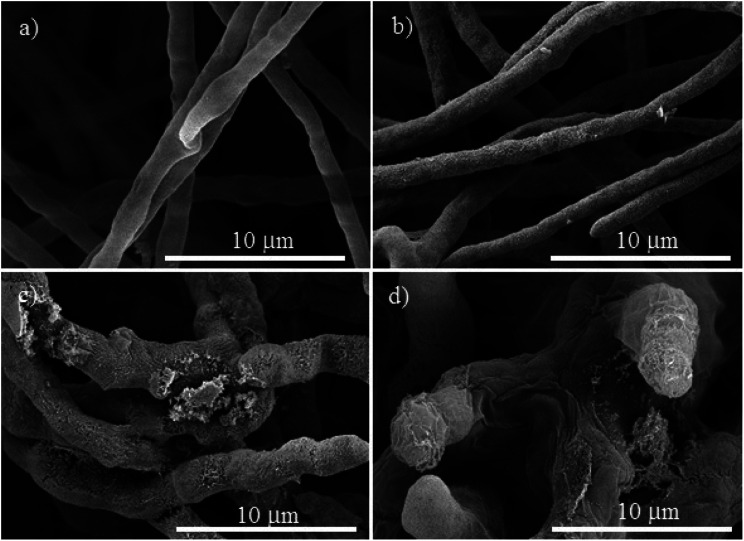
Fig. 5
SEM micrographs of Neofusicoccum sp., (a) control. The treatments with different concentrations of Cu-NPs: (b) 0.1 mg mL u22121 , (c) 0.25 mg mL u22121 , and (d) 0.5 mg mL u22121 .
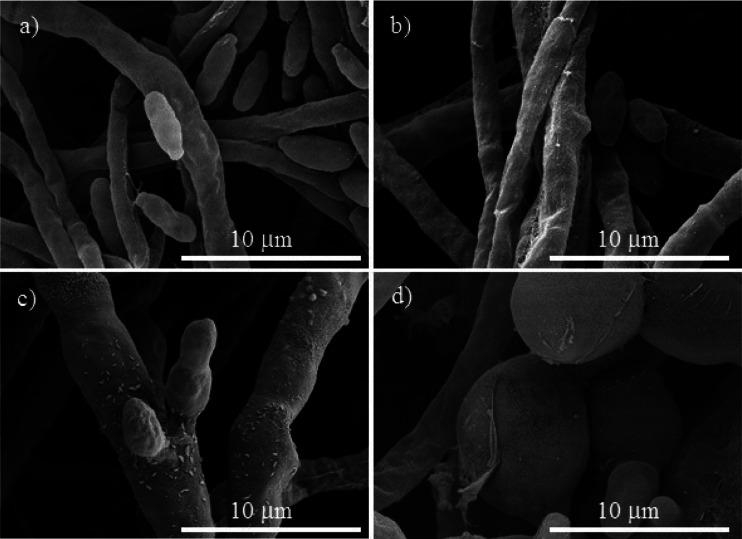
Fig. 6
SEM micrographs of Fusarium oxysporum , (a) control. The treatments with different concentrations of Cu-NPs: (b) 0.1 mg mL u22121 , (c) 0.25 mg mL u22121 , and (d) 0.5 mg mL u22121 .
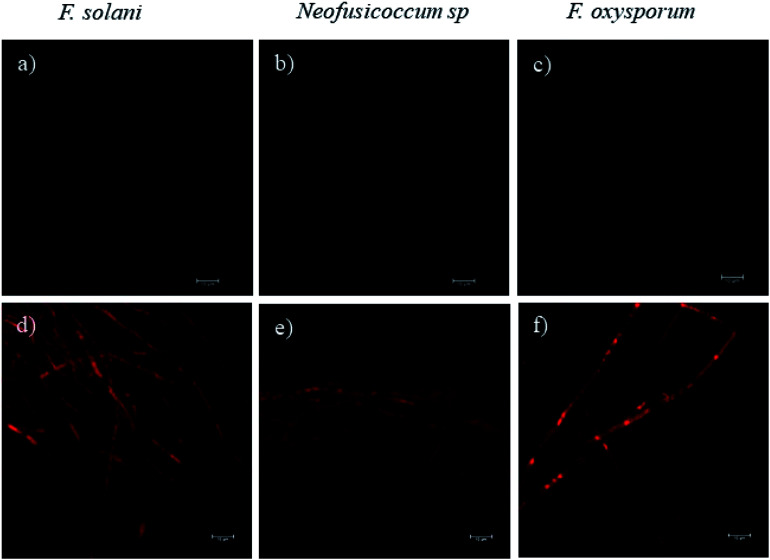
Fig. 7
The effect of Cu-NPs on the cell viability by analyzing the PI influx in F. solani , Neofusicoccum sp., and F. oxysporum . (au2013c) Controls and (du2013f) treatments of Cu-NPs at a concentration of 0.5 mg mL u22121 .
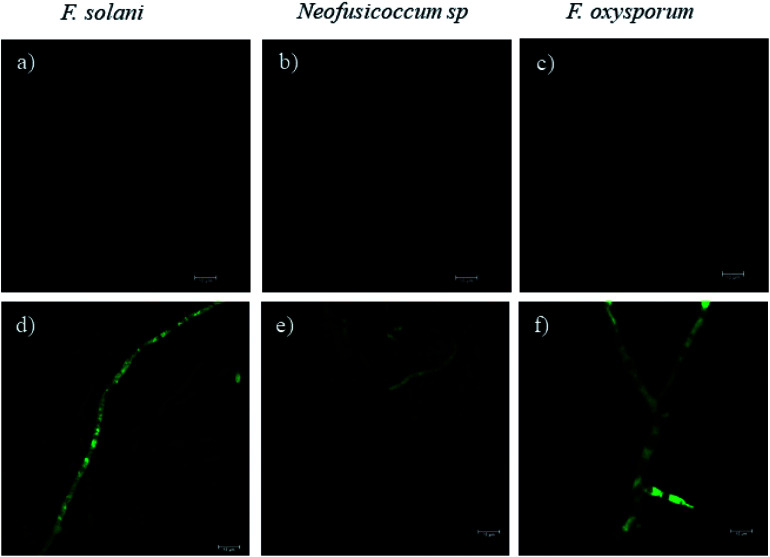
Fig. 8
The effect of Cu-NPs on the production of intracellular ROS in F. solani , Neofusicoccum sp., and F. oxysporum . (au2013c) Controls and (du2013f) treatments of Cu-NPs at a concentration of 0.5 mg mL u22121 .
Figure images are served from the NIH/NLM PubMed Central Open Access Subset or Europe PMC; copyright remains with the publishers and authors.
💬 Discussion
0 commentsNo comments yet. Be the first to start a discussion!
Leave a Comment