Abstract
Astrocytic calcium dynamics has been implicated in the encoding of sensory information1-5, and modulation of calcium in astrocytes has been shown to affect behaviour6-10. However, longitudinal investigation of the real-time calcium activity of astrocytes in the hippocampus of awake mice is lacking. Here we used two-photon microscopy to chronically image CA1 astrocytes as mice ran in familiar or new virtual environments to obtain water rewards. We found that astrocytes exhibit persistent ramping activity towards the reward location in a familiar environment, but not in a new one. Shifting the reward location within a familiar environment also resulted in diminished ramping. After additional training, as the mice became familiar with the new context or new reward location, the ramping was re-established. Using linear decoders, we could predict the location of the mouse in a familiar environment from astrocyte activity alone. We could not do the same in a new environment, suggesting that the spatial modulation of astrocytic activity is experience dependent. Our results indicate that astrocytes can encode the expected reward location in spatial contexts, thereby extending their known computational abilities and their role in cognitive functions.
🔬 Techniques
✨ Fluorophores
🧪 Sample Preparation
🔬 Cell Lines
🏭 Microscope Brands
🧪 Reagent Suppliers
🔴 Lasers
📷 Detectors
🎨 Filters
💻 Software Details
💾 Data Repositories
🏷️ Research Resource Identifiers (RRIDs)
Verified research resources used in this paper:
🏛️ Research Organizations (ROR)
Affiliated research institutions:
📋 Methods
Key Resources Table REAGENT or RESOURCE SOURCE IDENTIFIER
Bacterial and Virus Strains AAV5.CAG.Flex.GCaMP6m.WPRE.SV40 Penn Vector Core AV-5-PV2817 AAV5.gfaABC1D.Kmyr.GCaMP6m GCaMP6m [ 36 ] Addgene #40754 gfaABC1D [ 37 ] Addgene #19976 Kmyr tag [ 38 ] N/A Chemicals, Peptides, and Recombinant Proteins Alexa Fluor-568 Invitrogen Cat# A20003 Kerr Tab 2000 dental cement and liquid Kerr Dental Cat# 61770 Metabond dental cement Crown & Bridge Cat# S380 N-(2-chloroethyl)-N-ethyl-2-bromobenzylamine hydrochloride (DSP-4) Sigma Aldrich Cat# C8417 Noradrenaline Sigma Aldrich Cat# A7257 Optical glue Norland Cat# NOA71 Tamoxifen Sigma Aldrich Cat# T5648 Vetbond 3M Cat# 1469SB Experimental Models: Organisms/Strains Mouse: B6;CBA-Tg(Fgfr3-icre/ERT2)4-2Wdr/J Univ. College London [ 39 ] RRID: IMSR_JAX:025809 Oligonucleotides iCre250 (GAG GGA CTA CCT CCT GTA CC) [ 39 ] N/A iCre880 (TGC CCA GAG TCA TCC TTG GC) [ 39 ] N/A Software and Algorithms Adobe Illustrator Adobe RRID: SCR_010279 Breeze 3.20 Waters https://www.waters.com/waters/de_DE/Breeze-2-HPLC ImageJ [ 40 ] RRID: SCR_003070 MATLAB MathWorks RRID: SCR_001622 Presentation Neurobehavioral Systems RRID: SCR_002521 StreamPix Norpix RRID: SCR_015773 TurboReg [ 41 ] RRID: SCR_014308 Other Blackout material Thorlabs BK5 Camera: CCD camera Allied Vision Prosilica GC660 Camera: EMCCD camera Qimaging EM-C 2 Collimating lens Thorlabs N-BK7 Cover glasses Harvard Apparatus CS-5R, CS-8R GaAsP photomultipler tubes Hamamatsu H11706-401 Galvanometer scanner Cambridge Technology 6215H Filters Semrock FF01-510/84-25-STR Laser Spectra Physics MaiTai DeepSee LCD monitor Samsung 2233RZ LEDs Thorlabs MCWHL5 LED driver Thorlabs LEDD1B Lens Navitar Zoom 6000 Lens: 2x widefield lens, NA = 0.55 Edmund Optics PSM-PLAPO2xPA Lens: 16x lens, NA = 0.8 Nikon N16XLWD-PF Microcontroller Atmel AT89LP52 Multi-wavelength fluorescence detector Waters 2475 Nanoliter injector: Nanoject II Drummond Sci. 3-000-205A Neoprene O-rings 014-018 WPI 016-5927-100; 015-5927-100 Photodetector Omron E3T-SR41 Pinch valve msscientific 075P2NC12-02SQM Resonant scanner Cambridge Technology CRS 8k Reversed phase column Alltima HP C18 AQ Rotary encoder Avago Tech 630-HEDS-5540-C02 Stereoscope Zeiss MZ10F Thermistor CWE Inc YSI-451 Titanium head plate Inhouse Design available upon request Treadmill Inhouse / Thorlabs Design available upon request Treadmill belt: Velcro material Country Brook L-BLA-2 Treadmill belt: Velvet material McMaster-Carr 88015K1 2-photon microsope Neurolabware N/A Ultrasonic processor Hielscher UP50H USB acquisition board MCC USB-4301 USB programmer Mouser 932-MIKROE-29 Lead Contact and Materials Availability Further information and requests for resources and reagents should be directed to and will be fulfilled by the Lead Contact, Matthew Holt ( Matthew.Holt@kuleuven.vib.be ). Viral vectors generated in this study are available from Matthew Holt.
Show full methods section
Key Resources Table REAGENT or RESOURCE SOURCE IDENTIFIER
Bacterial and Virus Strains AAV5.CAG.Flex.GCaMP6m.WPRE.SV40 Penn Vector Core AV-5-PV2817 AAV5.gfaABC1D.Kmyr.GCaMP6m GCaMP6m [ 36 ] Addgene #40754 gfaABC1D [ 37 ] Addgene #19976 Kmyr tag [ 38 ] N/A Chemicals, Peptides, and Recombinant Proteins Alexa Fluor-568 Invitrogen Cat# A20003 Kerr Tab 2000 dental cement and liquid Kerr Dental Cat# 61770 Metabond dental cement Crown & Bridge Cat# S380 N-(2-chloroethyl)-N-ethyl-2-bromobenzylamine hydrochloride (DSP-4) Sigma Aldrich Cat# C8417 Noradrenaline Sigma Aldrich Cat# A7257 Optical glue Norland Cat# NOA71 Tamoxifen Sigma Aldrich Cat# T5648 Vetbond 3M Cat# 1469SB Experimental Models: Organisms/Strains Mouse: B6;CBA-Tg(Fgfr3-icre/ERT2)4-2Wdr/J Univ. College London [ 39 ] RRID: IMSR_JAX:025809 Oligonucleotides iCre250 (GAG GGA CTA CCT CCT GTA CC) [ 39 ] N/A iCre880 (TGC CCA GAG TCA TCC TTG GC) [ 39 ] N/A Software and Algorithms Adobe Illustrator Adobe RRID: SCR_010279 Breeze 3.20 Waters https://www.waters.com/waters/de_DE/Breeze-2-HPLC ImageJ [ 40 ] RRID: SCR_003070 MATLAB MathWorks RRID: SCR_001622 Presentation Neurobehavioral Systems RRID: SCR_002521 StreamPix Norpix RRID: SCR_015773 TurboReg [ 41 ] RRID: SCR_014308 Other Blackout material Thorlabs BK5 Camera: CCD camera Allied Vision Prosilica GC660 Camera: EMCCD camera Qimaging EM-C 2 Collimating lens Thorlabs N-BK7 Cover glasses Harvard Apparatus CS-5R, CS-8R GaAsP photomultipler tubes Hamamatsu H11706-401 Galvanometer scanner Cambridge Technology 6215H Filters Semrock FF01-510/84-25-STR Laser Spectra Physics MaiTai DeepSee LCD monitor Samsung 2233RZ LEDs Thorlabs MCWHL5 LED driver Thorlabs LEDD1B Lens Navitar Zoom 6000 Lens: 2x widefield lens, NA = 0.55 Edmund Optics PSM-PLAPO2xPA Lens: 16x lens, NA = 0.8 Nikon N16XLWD-PF Microcontroller Atmel AT89LP52 Multi-wavelength fluorescence detector Waters 2475 Nanoliter injector: Nanoject II Drummond Sci. 3-000-205A Neoprene O-rings 014-018 WPI 016-5927-100; 015-5927-100 Photodetector Omron E3T-SR41 Pinch valve msscientific 075P2NC12-02SQM Resonant scanner Cambridge Technology CRS 8k Reversed phase column Alltima HP C18 AQ Rotary encoder Avago Tech 630-HEDS-5540-C02 Stereoscope Zeiss MZ10F Thermistor CWE Inc YSI-451 Titanium head plate Inhouse Design available upon request Treadmill Inhouse / Thorlabs Design available upon request Treadmill belt: Velcro material Country Brook L-BLA-2 Treadmill belt: Velvet material McMaster-Carr 88015K1 2-photon microsope Neurolabware N/A Ultrasonic processor Hielscher UP50H USB acquisition board MCC USB-4301 USB programmer Mouser 932-MIKROE-29 Lead Contact and Materials Availability Further information and requests for resources and reagents should be directed to and will be fulfilled by the Lead Contact, Matthew Holt ( Matthew.Holt@kuleuven.vib.be ). Viral vectors generated in this study are available from Matthew Holt.
Experimental Model and Subject Details Animals
All procedures were performed in compliance with protocols approved by the Animal Ethics Committee of the University of Leuven (KU Leuven, Belgium). Experiments involved 15 male Fgfr3-iCreER T2 hemizygous mice and 3 wild-type (WT) mice bred on a C57BL/6j background (Charles River). Fgfr3-iCreER T2 mice expressed tamoxifen-inducible Cre recombinase specifically in astrocytes [ 39 ]. Genotyping was performed by PCR using primers iCre250 (5′-GAGGGACTACCTCCTGTACC-3′) and iCre880 (5′-TGCCCAGAGTCATCCTTGGC-3′). Animals were group-housed (up to five mice per cage) under standard conditions, under a 12-h:12-h light:dark cycle, with access to food and water ad libitum and only moved to individual housing after surgery. Animals were eight weeks of age or older at the time of headpost and cranial window implantation. Animals were habituated to head fixation and treadmill running (2 - 4 weeks). Their visual cortex was mapped with widefield flavoprotein imaging and injected with AAV. For Fgfr3-iCreER T2 mice, injections were immediately followed by tamoxifen treatment. Multiple 1-photon and 2-photon imaging experiments were performed for up to 20 weeks after AAV injections. In a subset of animals (N = 10 Fgfr3-iCreER T2 and 3 WT), imaging sessions were interrupted by a single dose of DSP-4 or saline (as a control). Imaging sessions resumed 72 hours after drug administration. Behavioral training was maintained throughout the experiments. At the end of a given set of experiments, animals were euthanized. For animals injected with DSP-4 (or saline), brains were removed for HPLC analysis.
Method Details Surgical procedures and cranial window implantation
All surgical procedures were performed in aseptic conditions under isoflurane anesthesia (induction 2.5%, 1 l/min O 2 ; maintenance 1%–1.5%, 0.6 l/min O 2 ) using a stereotaxic apparatus, a heating pad set to 37°C, and regular toe pinches to assess depth of anesthesia. Animals were treated with dexamethasone (8 mg/kg, intramuscular) four hours prior to surgery to prevent brain swelling. A custom-made titanium head plate and a removable cranial window were implanted to allow head fixation and provide optical access to the left posterior cortex [ 42 ]. The scalp was disinfected (70% ethanol and betadine), the skull was exposed, and the temporalis muscle was separated. The head plate was positioned over the posterior left hemisphere and attached using cyanoacrylic glue (Loctite, Henkel). Any exposed tissue or skull was covered with cyanoacrylic glue (Vetbond, 3M) and the head plate was cemented with Metabond (C&B). A 5 mm craniotomy centered over left primary visual cortex (1.6 mm anterior from lambda, 3.1 mm lateral from midline) was covered with a cranial window consisting of one 8 mm and two 5 mm circular coverslips glued concentrically together with optical glue (NOA71, Norland), and attached to the skull with dental cement (Kerr Tab 2000, KemDent). The implant was painted with a mixture of dental cement and black pigment to prevent stray light from reaching the objective. A water well made of two neoprene O-rings was attached to the head plate using cyanoacrylic glue. After surgery, mice were moved to individual housing and allowed to recover. All mice received post-operative treatment for 60 hours to minimize pain and prevent infection. Buprenorphine (0.2 mg/kg) and cefazolin (15 mg/kg) were supplied via intramuscular injection at 12-hour intervals for 2.5 consecutive days. Trimethoprim (0.1 mg/ml) and sulfamethoxazole (0.5 mg/ml) were supplied in the drinking water for a maximum of 10 days post-surgery.
Mapping of visual areas with flavoprotein imaging
To target viral vector injections, retinotopic mapping of visual areas was performed with flavoprotein imaging [ 43 , 44 ] during responses to square-wave moving stimuli (spatial frequency = 0.08 cycles per degree, temporal frequency = 4 Hz, horizontal and vertical orientations moving in four cardinal directions) presented at six screen locations (in a 2-by-3 matrix from upper-central to bottom-peripheral right visual hemifield). Each of the six stimuli filled a circular spot covering 40 degrees in visual space along both the horizontal and vertical axes and lasted 8 s. Stimuli were interleaved by equally-timed ‘blanks’ (50% luminance), with a final ‘blank’ phase of 8-s duration. This cycle was repeated 10 times. Fractional changes in fluorescence were normalized to baseline and averaged across 4-s intervals to capture the slow time course of the flavoprotein signal. The location of V1 was identified based on the characteristic decrease in flavoprotein fluorescence (relative to the pre-stimulus baseline) observed during presentation of visual stimuli, which distinguishes V1 from surrounding higher visual areas.
Viral vector administration and induction of GCaMP6 expression
Two vector systems were used to deliver GCaMP6m [ 36 ] to the visual cortex. Wild-type animals were injected with an AAV-based vector carrying membrane-tagged GCaMP under the control of an astrocyte-specific promoter (AAV5-gfaABC1D-Kmyr-GCaMP6m). AAV was produced in house , using a standard tri-transfection protocol with subsequent iodixanol-based purification. Vector titer was determined by quantitative PCR and purity assessed by SDS-PAGE and silver staining [ 45 , 46 ]. When using the Fgfr3-iCreER T2 line, animals received injections of AAV5-CAG-Flex-GCaMP6m, which was obtained from the University of Pennsylvania Vector Core. GCaMP6 expression was induced by administration of tamoxifen (see below). Three to four vector injections were performed along the border of V1 (based on flavoprotein imaging) to cover a large fraction of primary visual cortex. The cranial window was removed with a surgical drill. A microliter injection system (Nanoject II, Drummond Science) was used to inject 100 - 300 nl of a vector containing solution (approximately 9 × 10 5 to 3 × 10 6 total vector genomes), together with the fluorescent dye Alexa-568. We typically targeted astrocytes in cortical layer II/III, approximately 120 - 300 μm below the cortical surface. The solution was delivered through beveled glass capillaries (Drummond Science) with 20 - 40 μm tip diameters, at a rate of 60 nl/min. A fluorescence microscope was used to monitor the injections. A new cranial window was fixed in place and the animal was left to recover for five days. When necessary, Cre activation (leading to GCaMP6m expression) was induced by intraperitoneal injection of tamoxifen (2 mg in a mixture of 1 part ethanol - 9 parts sunflower oil; total injection volume 100 μl; Sigma). Tamoxifen administration started immediately after AAV injections and was performed daily for five consecutive days [ 47 ], prior to the start of imaging experiments.
Treadmill assay and behavioral training
The treadmill apparatus consisted of a 150 cm long, 5 cm wide belt of Velcro (Country Brook), mounted on two 10 cm diameter wheels, supported by a custom frame (Thorlabs) [ 48 , 49 ]. Treadmill rotation, and the distance traveled by the animal, was monitored with a resolution of 3.14 mm by a rotary encoder (Avago Tech), attached to the treadmill shaft. Completion of a full lap (150 cm) was recorded using a reflective strip attached to the underside of the belt, which was detected by a photoelectric sensor (Omron). This event triggered the opening of an electromagnetic pinch valve (msscientific), leading to delivery of a drop of tap water, or 10% sucrose solution, through a spout that was accessible to the animal. Recordings of treadmill rotation and lap completion were collected by a custom circuit board with a microcontroller (AT89LP52, Atmel), which linked treadmill position to valve opening. All signals were acquired by a personal computer via a USB data acquisition board (MCC), sampled at 10 kHz and recorded with Presentation software (Neurobehavioral Systems). Five days after cranial window implantation, mice were put on a water restriction schedule (5 min/day of unrestricted access to water), which was maintained throughout behavioral training and imaging experiments. Mice were manually handled in daily sessions for 3 - 5 days before surgical procedures and, after 5 days of recovery, trained to run head-fixed on a treadmill apparatus for a water reward. The duration of training sessions increased gradually from a few minutes per day up to 1 hour per day, over a period of 2 - 3 weeks. Training was completed when animals reached the desired level of locomotor activity – typically 3 laps of the treadmill per minute. Animal training continued during the experimental phase, with at least two sessions per week, on days when experiments were not being performed.
1-photon and 2-photon imaging
All imaging was conducted using a dual widefield and 2-photon in vivo microscope (Neurolabware). Widefield flavoprotein and calcium imaging were performed with blue excitation light (470 nm, Thorlabs) through a low magnification (2x) objective lens (NA = 0.055, Edmund Optics) and collection of the emitted green light (510/84 nm filter, Semrock) with an EMCCD camera (EM-C2, QImaging; 1,004 by 1,002 pixels with 4 by 4 binning), at a rate of 10 frames per second (fps). For 2-photon imaging, a 920 nm femtosecond laser beam (Newport MaiTai DeepSee) was raster-scanned using galvo and resonant scanners (Cambridge 6215H and CRS 8K) and focused at 100 - 300 μm depth below the pial surface using a 16x lens (NA = 0.8, Nikon). Fluorescence from GCaMP6 was collected using a band-pass filter (510/84 nm, Semrock) and a GaAsP photomultiplier tube (Hamamatsu). Single imaging planes were collected at 30 fps (1,154 by 512 pixels, 620 by 380 μm field-of-view) using 20 - 60 mW laser power. Blackout material (Thorlabs) blocked stray light from the visual display entering the collection light path.
Visual stimulation
Visual stimuli were presented on a calibrated 22-inch LCD monitor (Samsung SyncMaster 2233RZ, 1,680-by-1,050 pixels resolution, 60 Hz refresh rate, average luminance 59 cd/m 2 ). The screen was positioned 20 cm in front of the right eye. The visual field covered 0 - 120 degrees central to peripheral field and ± 40 degrees lower to upper field. Stimuli were 12 degree-wide bars filled with alternating (6 Hz) black and white checkerboard patterns (0.05 cpd spatial frequency; 0 / 100% contrast), moving across the screen in one of the four cardinal directions, at a speed of 6°/s, such that a stimulus traveled across the display for approximately 20 s in the horizontal direction, or 13.4 s in the vertical direction. One experimental session consisted of 10 or 20 ‘trials’, with either one or all of the four bar directions used in every trial. Each trial was interspersed by ‘blanks’ consisting of a full gray screen (10 / 30 s at 50% luminance). To relate astrocyte responses to the timing of visual stimulation, stimulus presentation was synchronized to image acquisition by using a trigger signal from either the EMCCD camera (1-photon, 10 fps) or the slow-axis galvanometer scan pulses (2-photon, 30 fps), controlled by Presentation software (Neurobehavioral Systems).
Pupil tracking
Pupil size was measured using an infrared eye tracking camera, placed in front of the right eye. Infrared light was focused onto the eye with a far-red LED (735 nm, Thorlabs) and collimated lens (Thorlabs). Data was acquired at 30 fps with a CCD camera (AVT Prosilica GC660; Navitar Zoom 6000 lens) and StreamPix software (Norpix). Images were subsequently analyzed using custom software (MATLAB). DSP-4 administration and analysis of noradrenaline levels To deplete noradrenaline levels in the cortex, the neurotoxin DSP-4 (N-(2-chloroethyl)-N-ethyl-2-bromobenzylamine hydrochloride; Sigma) was administered using a single intraperitoneal injection of 75 mg/kg DSP-4 in saline. The dose was titrated to ensure depletion of cortical noradrenaline while not causing signs of discomfort or abnormal behavior in mice. A final session of imaging experiments was performed 72 hours post-injection. Upon completion of imaging, mice were sacrificed, brains removed, and cortical hemispheres collected. Tissue was snap-frozen in liquid N 2 and stored at −80°C until use. Five saline-injected animals were used as controls.
High-performance liquid chromatography
(HPLC) was used to confirm reduction of cortical noradrenaline levels. On the day of HPLC experiments, samples were rapidly thawed, followed by homogenization in 9 volumes (w/v) ice-cold 200 mM perchloric acid, containing 3 mM cysteine and 0.25 mM EDTA.Na 2 (as described [ 50 ]). Homogenization was performed in polypropylene tubes, using a hand-held ultrasonic processor (UP50H, Hielscher). After centrifugation (15,000 x g Av for 10 min), the resulting supernatant was transferred to HPLC vials and 20 μl was injected onto a reversed phase column (Alltima HP C18 AQ, inner diameter 4.6 mm, length 250 mm, particle size 5 μm), equilibrated in running buffer (20 mM acetic acid, 0.25 mM EDTA) [ 51 ]. After 1 min, bound analytes were eluted using a linear gradient of methanol (0 - 40% (v/v) in running buffer) with a flow rate of 1 ml/min. Signals were detected fluorimetrically (Waters 2475 multi-wavelength fluorescence detector), using an excitation wavelength of 279 nm and an emission wavelength of 320 nm. Chromatograms were analyzed with Breeze 3.20 software (Waters). Standardization was done against known amounts of external noradrenaline (Sigma). Noradrenaline was typically eluted at ∼2.5 ml (against a void volume of 2 ml). In some experiments, 0.05% (v/v) trifluoroacetic acid was added to both solvents, improving the retention of noradrenaline (∼2.8 ml), allowing cleaner separation from a faster eluting contaminant.
Quantification and Statistical Analysis
Selection of regions of interest (ROIs) All imaging data were analyzed in MATLAB (Mathworks) and ImageJ (NIH) [ 40 ]. All figures were prepared in Adobe Illustrator CS6 (Adobe). Analysis of calcium signals from 1-photon and 2-photon images was performed by (1) identifying pixels with significant calcium signals, (2) identifying ROIs within primary visual cortex, (3) summing pixel values within these ROIs, and (4) analyzing the resulting time series. For both 1-photon and 2-photon imaging, pixels showing calcium signals were defined as the 25% brightest pixels identified from the product of the mean and the standard deviation of the raw images computed across time. For 1-photon imaging, camera images were down-sampled in the x and y dimensions by a factor of 10, yielding images of 25-by-26 pixels, meaning each pixel measured approximately 200-by-200 μm in size. The strongest responsive pixel was identified by computing the ‘local’ Pearson’s correlation coefficient from time series of neighboring pixels and selecting the pixel with the highest correlation to its neighbors. Time series were down-sampled by a factor of 10 before computing the correlation. For 2-photon imaging, ROIs corresponding to individual astrocytes were outlined manually, based on a maximum intensity projection of the acquired time series, which allowed clear cell morphology to be determined. ROIs were identified from the first imaging experiment with visual stimulation. The same ROIs were used in all experiments with the same animal and the same field of view. Prior to analysis, 2-photon images were registered to correct for x-y motion using TurboReg [ 41 ].
Analysis of calcium activity time courses
Calcium activity time courses were extracted from raw images by summing image pixel intensities over each ROI and expressing the result as a fractional change. Specifically, we computed dF/F 0 , where baseline fluorescence (F 0 ) is subtracted from raw fluorescence time series data (F) and the result is divided by F 0 . F 0 was set to the 10 th percentile of F computed for each time series separately. Calcium activity time courses were smoothed with a zero-lag bidirectional lowpass filter with cutoff frequency of 3 Hz. Responses to locomotor activity and visual stimulation were quantified by comparing the maximum dF/F 0 observed in 8- to 25-s windows prior to, or after, onset of visual stimulation or locomotion. Windows for locomotion and visual stimulation were slid independently to be approximately centered on the response peak. Half-widths at half-maximum response were calculated from a subset of calcium transients with amplitudes greater than 2.5 × s.d. of dF/F 0 . Calculation of response maps 1-photon images were processed at their original frame rate of ∼10 Hz, whereas 2-photon images were down-sampled in time by a factor of 3, reducing their frame rate from ∼31 Hz to ∼10 Hz, prior to event-related averaging. Trial averages, in relation to onset of locomotion or visual stimulation, were generated for 1-photon and 2-photon images, yielding image time series that were used for generating the response maps. Response latency was visualized for every pixel by smoothing the time courses with a Savitzky-Golay filter (3 rd order, 7 sampling points wide), calculating the peak response time over a window of –5 to +25 s related to locomotion or stimulus onset - and pseudo-coloring latency using a perceptually uniform lookup table [ 52 ].
Analysis of locomotion activity
Locomotion signals from the rotary encoder were resampled at the respective frame rates of the 1-photon or 2-photon imaging stacks. Locomotion events were defined as onsets of movement preceded by a minimum of 8-s during which the animal was stationary. This interval was chosen as it has been shown to be the minimal interval required for consecutive locomotion-induced astrocyte responses of equivalent amplitudes [ 4 ]. Locomotion bouts with maximal speeds lower than 5 cm/s and shorter than 1-s duration were discarded from further analyses. Pupil diameter and arousal state Pupil dilation was used as a proxy to assess changes in the arousal state of the animals [ 14 , 16 ], relative to the onset of locomotion or presentation of visual stimuli. For that, the diameter of the pupil was detected in each image using custom code [ 20 ] by (1) cropping the image to the eye’s margins, (2) smoothing the image using a Gaussian filter, (3) contrast-enhancement using adaptive histogram equalization, (4) binarization resulting in a black-and-white image in which black pixels represent the contours of the pupil, and (5) fitting an ellipsoid to the centermost object - the pupil [ 20 ]. Pupil diameter was estimated from the equivalent diameter of the ellipsoid, applying a pixel-to-millimeter conversion assuming an eye size of approx. 3 mm. Parameters for these operations were adjusted manually for each dataset. Resulting pupil diameter time courses were resampled to the frame rates of the 1-photon imaging stacks (∼30 Hz to ∼10 Hz). Changes in pupil diameter were expressed as changes during 10-s windows after onset of locomotion or visual stimulation, relative to the average diameter in 5-s windows preceding locomotion or stimulation.
Correlation analyses
Pearson’s correlation coefficients and their 95% confidence intervals were calculated using a 1,000-fold bootstrap random sampling for the correlations between (1) peak amplitudes and average locomotion speed during visual stimulation, (2) peak amplitudes and pupil diameter changes, and (3) average locomotion speed and pupil diameter changes. Robust linear regression was used to estimate straight-line fits between peak amplitudes and pupil diameter changes, or peak amplitudes and average locomotion speed, respectively.
Statistical analyses
A two-sample Kolmogorov-Smirnov test was used to test the distributions pre- versus post-DSP-4 of (1) peak amplitudes, (2) fraction of locomotion, and (3) frequency of locomotion onsets. A one-way ANOVA was used to compare the means of the distributions pre- versus post-DSP-4 of the bootstrap result for the correlation between peak amplitudes and pupil diameter changes. A two-sample Student’s t test was used to compare the means of noradrenaline levels pre- versus post-DSP-4.
Data and Code Availability
Analysis code and raw data are available upon request from the corresponding authors Matthew Holt ( Matthew.Holt@kuleuven.vib.be ) and Vincent Bonin ( Vincent.Bonin@nerf.be ).
Lead Contact and Materials Availability
Further information and requests for resources and reagents should be directed to and will be fulfilled by the Lead Contact, Matthew Holt ( Matthew.Holt@kuleuven.vib.be ). Viral vectors generated in this study are available from Matthew Holt.
Experimental Model and Subject Details Animals
All procedures were performed in compliance with protocols approved by the Animal Ethics Committee of the University of Leuven (KU Leuven, Belgium). Experiments involved 15 male Fgfr3-iCreER T2 hemizygous mice and 3 wild-type (WT) mice bred on a C57BL/6j background (Charles River). Fgfr3-iCreER T2 mice expressed tamoxifen-inducible Cre recombinase specifically in astrocytes [ 39 ]. Genotyping was performed by PCR using primers iCre250 (5′-GAGGGACTACCTCCTGTACC-3′) and iCre880 (5′-TGCCCAGAGTCATCCTTGGC-3′). Animals were group-housed (up to five mice per cage) under standard conditions, under a 12-h:12-h light:dark cycle, with access to food and water ad libitum and only moved to individual housing after surgery. Animals were eight weeks of age or older at the time of headpost and cranial window implantation. Animals were habituated to head fixation and treadmill running (2 - 4 weeks). Their visual cortex was mapped with widefield flavoprotein imaging and injected with AAV. For Fgfr3-iCreER T2 mice, injections were immediately followed by tamoxifen treatment. Multiple 1-photon and 2-photon imaging experiments were performed for up to 20 weeks after AAV injections. In a subset of animals (N = 10 Fgfr3-iCreER T2 and 3 WT), imaging sessions were interrupted by a single dose of DSP-4 or saline (as a control). Imaging sessions resumed 72 hours after drug administration. Behavioral training was maintained throughout the experiments. At the end of a given set of experiments, animals were euthanized. For animals injected with DSP-4 (or saline), brains were removed for HPLC analysis.
Method Details Surgical procedures and cranial window implantation
All surgical procedures were performed in aseptic conditions under isoflurane anesthesia (induction 2.5%, 1 l/min O 2 ; maintenance 1%–1.5%, 0.6 l/min O 2 ) using a stereotaxic apparatus, a heating pad set to 37°C, and regular toe pinches to assess depth of anesthesia. Animals were treated with dexamethasone (8 mg/kg, intramuscular) four hours prior to surgery to prevent brain swelling. A custom-made titanium head plate and a removable cranial window were implanted to allow head fixation and provide optical access to the left posterior cortex [ 42 ]. The scalp was disinfected (70% ethanol and betadine), the skull was exposed, and the temporalis muscle was separated. The head plate was positioned over the posterior left hemisphere and attached using cyanoacrylic glue (Loctite, Henkel). Any exposed tissue or skull was covered with cyanoacrylic glue (Vetbond, 3M) and the head plate was cemented with Metabond (C&B). A 5 mm craniotomy centered over left primary visual cortex (1.6 mm anterior from lambda, 3.1 mm lateral from midline) was covered with a cranial window consisting of one 8 mm and two 5 mm circular coverslips glued concentrically together with optical glue (NOA71, Norland), and attached to the skull with dental cement (Kerr Tab 2000, KemDent). The implant was painted with a mixture of dental cement and black pigment to prevent stray light from reaching the objective. A water well made of two neoprene O-rings was attached to the head plate using cyanoacrylic glue. After surgery, mice were moved to individual housing and allowed to recover. All mice received post-operative treatment for 60 hours to minimize pain and prevent infection. Buprenorphine (0.2 mg/kg) and cefazolin (15 mg/kg) were supplied via intramuscular injection at 12-hour intervals for 2.5 consecutive days. Trimethoprim (0.1 mg/ml) and sulfamethoxazole (0.5 mg/ml) were supplied in the drinking water for a maximum of 10 days post-surgery.
Mapping of visual areas with flavoprotein imaging
To target viral vector injections, retinotopic mapping of visual areas was performed with flavoprotein imaging [ 43 , 44 ] during responses to square-wave moving stimuli (spatial frequency = 0.08 cycles per degree, temporal frequency = 4 Hz, horizontal and vertical orientations moving in four cardinal directions) presented at six screen locations (in a 2-by-3 matrix from upper-central to bottom-peripheral right visual hemifield). Each of the six stimuli filled a circular spot covering 40 degrees in visual space along both the horizontal and vertical axes and lasted 8 s. Stimuli were interleaved by equally-timed ‘blanks’ (50% luminance), with a final ‘blank’ phase of 8-s duration. This cycle was repeated 10 times. Fractional changes in fluorescence were normalized to baseline and averaged across 4-s intervals to capture the slow time course of the flavoprotein signal. The location of V1 was identified based on the characteristic decrease in flavoprotein fluorescence (relative to the pre-stimulus baseline) observed during presentation of visual stimuli, which distinguishes V1 from surrounding higher visual areas.
Viral vector administration and induction of GCaMP6 expression
Two vector systems were used to deliver GCaMP6m [ 36 ] to the visual cortex. Wild-type animals were injected with an AAV-based vector carrying membrane-tagged GCaMP under the control of an astrocyte-specific promoter (AAV5-gfaABC1D-Kmyr-GCaMP6m). AAV was produced in house , using a standard tri-transfection protocol with subsequent iodixanol-based purification. Vector titer was determined by quantitative PCR and purity assessed by SDS-PAGE and silver staining [ 45 , 46 ]. When using the Fgfr3-iCreER T2 line, animals received injections of AAV5-CAG-Flex-GCaMP6m, which was obtained from the University of Pennsylvania Vector Core. GCaMP6 expression was induced by administration of tamoxifen (see below). Three to four vector injections were performed along the border of V1 (based on flavoprotein imaging) to cover a large fraction of primary visual cortex. The cranial window was removed with a surgical drill. A microliter injection system (Nanoject II, Drummond Science) was used to inject 100 - 300 nl of a vector containing solution (approximately 9 × 10 5 to 3 × 10 6 total vector genomes), together with the fluorescent dye Alexa-568. We typically targeted astrocytes in cortical layer II/III, approximately 120 - 300 μm below the cortical surface. The solution was delivered through beveled glass capillaries (Drummond Science) with 20 - 40 μm tip diameters, at a rate of 60 nl/min. A fluorescence microscope was used to monitor the injections. A new cranial window was fixed in place and the animal was left to recover for five days. When necessary, Cre activation (leading to GCaMP6m expression) was induced by intraperitoneal injection of tamoxifen (2 mg in a mixture of 1 part ethanol - 9 parts sunflower oil; total injection volume 100 μl; Sigma). Tamoxifen administration started immediately after AAV injections and was performed daily for five consecutive days [ 47 ], prior to the start of imaging experiments.
Treadmill assay and behavioral training
The treadmill apparatus consisted of a 150 cm long, 5 cm wide belt of Velcro (Country Brook), mounted on two 10 cm diameter wheels, supported by a custom frame (Thorlabs) [ 48 , 49 ]. Treadmill rotation, and the distance traveled by the animal, was monitored with a resolution of 3.14 mm by a rotary encoder (Avago Tech), attached to the treadmill shaft. Completion of a full lap (150 cm) was recorded using a reflective strip attached to the underside of the belt, which was detected by a photoelectric sensor (Omron). This event triggered the opening of an electromagnetic pinch valve (msscientific), leading to delivery of a drop of tap water, or 10% sucrose solution, through a spout that was accessible to the animal. Recordings of treadmill rotation and lap completion were collected by a custom circuit board with a microcontroller (AT89LP52, Atmel), which linked treadmill position to valve opening. All signals were acquired by a personal computer via a USB data acquisition board (MCC), sampled at 10 kHz and recorded with Presentation software (Neurobehavioral Systems). Five days after cranial window implantation, mice were put on a water restriction schedule (5 min/day of unrestricted access to water), which was maintained throughout behavioral training and imaging experiments. Mice were manually handled in daily sessions for 3 - 5 days before surgical procedures and, after 5 days of recovery, trained to run head-fixed on a treadmill apparatus for a water reward. The duration of training sessions increased gradually from a few minutes per day up to 1 hour per day, over a period of 2 - 3 weeks. Training was completed when animals reached the desired level of locomotor activity – typically 3 laps of the treadmill per minute. Animal training continued during the experimental phase, with at least two sessions per week, on days when experiments were not being performed.
1-photon and 2-photon imaging
All imaging was conducted using a dual widefield and 2-photon in vivo microscope (Neurolabware). Widefield flavoprotein and calcium imaging were performed with blue excitation light (470 nm, Thorlabs) through a low magnification (2x) objective lens (NA = 0.055, Edmund Optics) and collection of the emitted green light (510/84 nm filter, Semrock) with an EMCCD camera (EM-C2, QImaging; 1,004 by 1,002 pixels with 4 by 4 binning), at a rate of 10 frames per second (fps). For 2-photon imaging, a 920 nm femtosecond laser beam (Newport MaiTai DeepSee) was raster-scanned using galvo and resonant scanners (Cambridge 6215H and CRS 8K) and focused at 100 - 300 μm depth below the pial surface using a 16x lens (NA = 0.8, Nikon). Fluorescence from GCaMP6 was collected using a band-pass filter (510/84 nm, Semrock) and a GaAsP photomultiplier tube (Hamamatsu). Single imaging planes were collected at 30 fps (1,154 by 512 pixels, 620 by 380 μm field-of-view) using 20 - 60 mW laser power. Blackout material (Thorlabs) blocked stray light from the visual display entering the collection light path.
Visual stimulation
Visual stimuli were presented on a calibrated 22-inch LCD monitor (Samsung SyncMaster 2233RZ, 1,680-by-1,050 pixels resolution, 60 Hz refresh rate, average luminance 59 cd/m 2 ). The screen was positioned 20 cm in front of the right eye. The visual field covered 0 - 120 degrees central to peripheral field and ± 40 degrees lower to upper field. Stimuli were 12 degree-wide bars filled with alternating (6 Hz) black and white checkerboard patterns (0.05 cpd spatial frequency; 0 / 100% contrast), moving across the screen in one of the four cardinal directions, at a speed of 6°/s, such that a stimulus traveled across the display for approximately 20 s in the horizontal direction, or 13.4 s in the vertical direction. One experimental session consisted of 10 or 20 ‘trials’, with either one or all of the four bar directions used in every trial. Each trial was interspersed by ‘blanks’ consisting of a full gray screen (10 / 30 s at 50% luminance). To relate astrocyte responses to the timing of visual stimulation, stimulus presentation was synchronized to image acquisition by using a trigger signal from either the EMCCD camera (1-photon, 10 fps) or the slow-axis galvanometer scan pulses (2-photon, 30 fps), controlled by Presentation software (Neurobehavioral Systems).
Pupil tracking
Pupil size was measured using an infrared eye tracking camera, placed in front of the right eye. Infrared light was focused onto the eye with a far-red LED (735 nm, Thorlabs) and collimated lens (Thorlabs). Data was acquired at 30 fps with a CCD camera (AVT Prosilica GC660; Navitar Zoom 6000 lens) and StreamPix software (Norpix). Images were subsequently analyzed using custom software (MATLAB). DSP-4 administration and analysis of noradrenaline levels To deplete noradrenaline levels in the cortex, the neurotoxin DSP-4 (N-(2-chloroethyl)-N-ethyl-2-bromobenzylamine hydrochloride; Sigma) was administered using a single intraperitoneal injection of 75 mg/kg DSP-4 in saline. The dose was titrated to ensure depletion of cortical noradrenaline while not causing signs of discomfort or abnormal behavior in mice. A final session of imaging experiments was performed 72 hours post-injection. Upon completion of imaging, mice were sacrificed, brains removed, and cortical hemispheres collected. Tissue was snap-frozen in liquid N 2 and stored at −80°C until use. Five saline-injected animals were used as controls.
High-performance liquid chromatography
(HPLC) was used to confirm reduction of cortical noradrenaline levels. On the day of HPLC experiments, samples were rapidly thawed, followed by homogenization in 9 volumes (w/v) ice-cold 200 mM perchloric acid, containing 3 mM cysteine and 0.25 mM EDTA.Na 2 (as described [ 50 ]). Homogenization was performed in polypropylene tubes, using a hand-held ultrasonic processor (UP50H, Hielscher). After centrifugation (15,000 x g Av for 10 min), the resulting supernatant was transferred to HPLC vials and 20 μl was injected onto a reversed phase column (Alltima HP C18 AQ, inner diameter 4.6 mm, length 250 mm, particle size 5 μm), equilibrated in running buffer (20 mM acetic acid, 0.25 mM EDTA) [ 51 ]. After 1 min, bound analytes were eluted using a linear gradient of methanol (0 - 40% (v/v) in running buffer) with a flow rate of 1 ml/min. Signals were detected fluorimetrically (Waters 2475 multi-wavelength fluorescence detector), using an excitation wavelength of 279 nm and an emission wavelength of 320 nm. Chromatograms were analyzed with Breeze 3.20 software (Waters). Standardization was done against known amounts of external noradrenaline (Sigma). Noradrenaline was typically eluted at ∼2.5 ml (against a void volume of 2 ml). In some experiments, 0.05% (v/v) trifluoroacetic acid was added to both solvents, improving the retention of noradrenaline (∼2.8 ml), allowing cleaner separation from a faster eluting contaminant.
Surgical procedures and cranial window implantation
All surgical procedures were performed in aseptic conditions under isoflurane anesthesia (induction 2.5%, 1 l/min O 2 ; maintenance 1%–1.5%, 0.6 l/min O 2 ) using a stereotaxic apparatus, a heating pad set to 37°C, and regular toe pinches to assess depth of anesthesia. Animals were treated with dexamethasone (8 mg/kg, intramuscular) four hours prior to surgery to prevent brain swelling. A custom-made titanium head plate and a removable cranial window were implanted to allow head fixation and provide optical access to the left posterior cortex [ 42 ]. The scalp was disinfected (70% ethanol and betadine), the skull was exposed, and the temporalis muscle was separated. The head plate was positioned over the posterior left hemisphere and attached using cyanoacrylic glue (Loctite, Henkel). Any exposed tissue or skull was covered with cyanoacrylic glue (Vetbond, 3M) and the head plate was cemented with Metabond (C&B). A 5 mm craniotomy centered over left primary visual cortex (1.6 mm anterior from lambda, 3.1 mm lateral from midline) was covered with a cranial window consisting of one 8 mm and two 5 mm circular coverslips glued concentrically together with optical glue (NOA71, Norland), and attached to the skull with dental cement (Kerr Tab 2000, KemDent). The implant was painted with a mixture of dental cement and black pigment to prevent stray light from reaching the objective. A water well made of two neoprene O-rings was attached to the head plate using cyanoacrylic glue. After surgery, mice were moved to individual housing and allowed to recover. All mice received post-operative treatment for 60 hours to minimize pain and prevent infection. Buprenorphine (0.2 mg/kg) and cefazolin (15 mg/kg) were supplied via intramuscular injection at 12-hour intervals for 2.5 consecutive days. Trimethoprim (0.1 mg/ml) and sulfamethoxazole (0.5 mg/ml) were supplied in the drinking water for a maximum of 10 days post-surgery.
Supplemental Information Document S1. Figures S1–S4 Document S2. Article plus Supplemental Information
📊 Figures
Figureu00a01
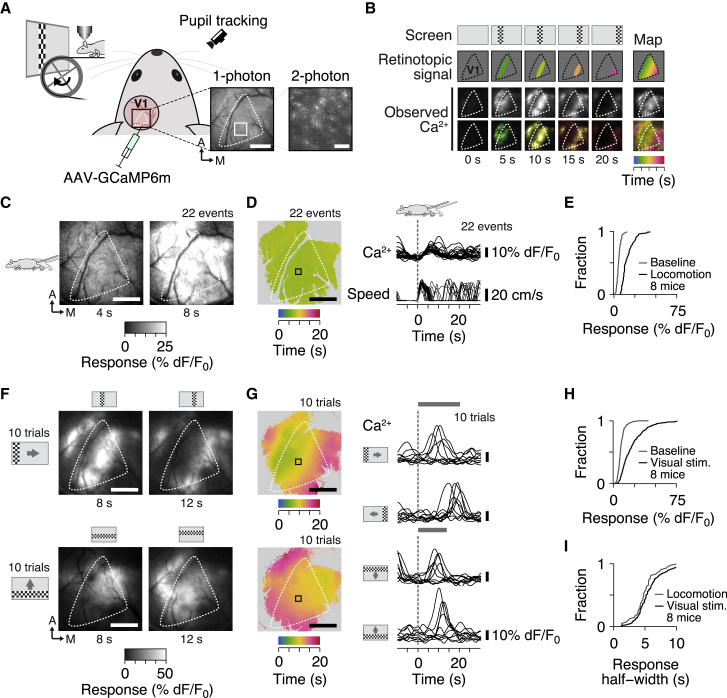
Distinct Ca 2+ Responses in Astrocytes of the Mouse Visual Cortex during Locomotion and Visual Stimulation (A) Mice were head-fixed under a dual widefield and multiphoton microscope. To stimulate the ...
Figureu00a02
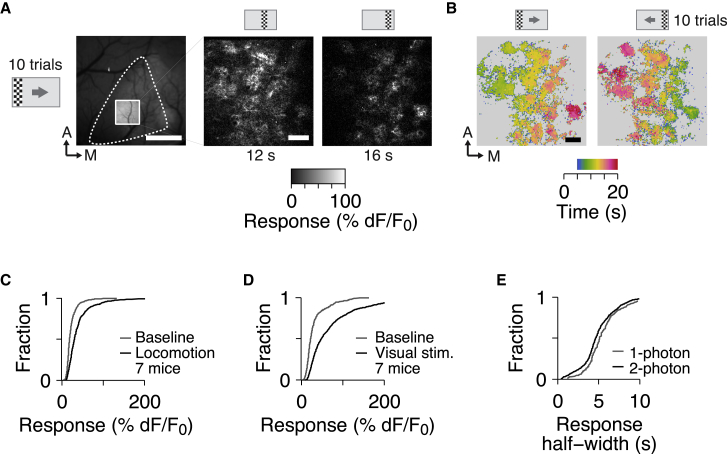
Individual Astrocytes Respond to Visual Stimulation (A) Left: example 2-photon imaging FOV (white square) at the cortical surface. Dashed line indicates V1. Center and right: 2-photon imaging at 160u0...
Figureu00a03
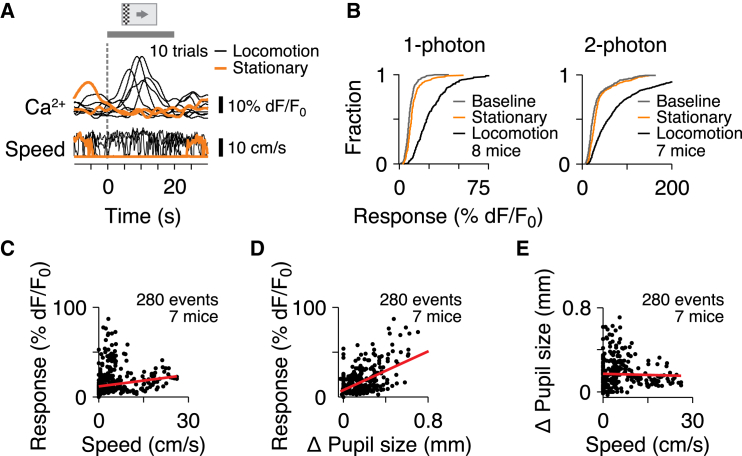
Visual Cortex Astrocytes Integrate Information on Sensory Inputs and Arousal State (A) Single-trial 1-photon GCaMP6 (top) and movement speed (bottom) traces aligned to stimulus onset (dashed line). Bl...
Figureu00a04
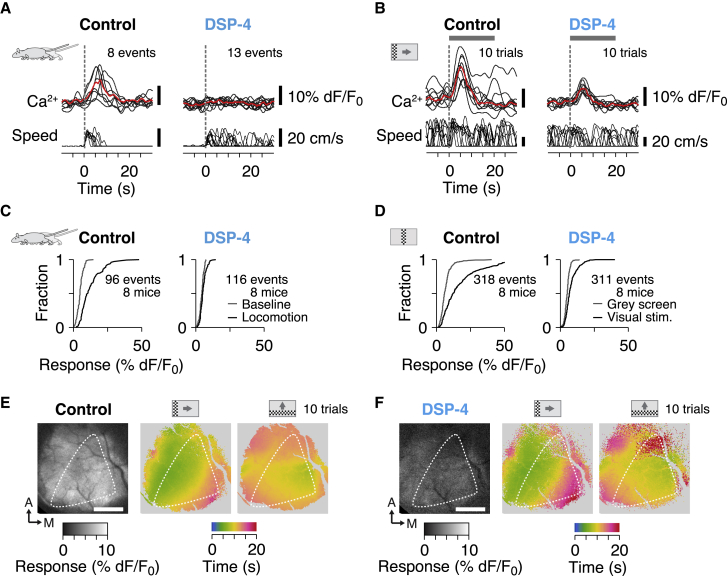
Visually Induced and Locomotion-Related Signals Operate through Distinct Mechanisms (A) Noradrenaline depletion abolishes the Ca 2+ responses associated with locomotion onset. Example Ca 2+ transients...
Figure images are served from the NIH/NLM PubMed Central Open Access Subset or Europe PMC; copyright remains with the publishers and authors.
💬 Discussion
0 commentsNo comments yet. Be the first to start a discussion!
Leave a Comment