Abstract
AbstractDirect visualization of spatiotemporal evolution of molecules and active sites during chemical transformation in individual catalyst crystal will accelerate the intuitive understanding of heterogeneous catalysis. So far, widespread imaging techniques can only provide limited information either with large probe molecules or in model catalyst of large size, which are beyond the interests of industrial catalysis. Herein, we demonstrate a feasible deep data approach via synergy of multiscale reaction-diffusion simulation and super-resolution structured illumination microscopy to illustrate the dynamical evolution of spatiotemporal distributions of gas molecules, carbonaceous species and acid sites in SAPO-34 zeolite crystals of several micrometers that are typically used in industrial methanol-to-olefins process. The profound insights into the inadequate utilization of activated acid sites and rapid deactivation are unveiled. The notable elucidation of molecular reaction-diffusion process at the scale of single catalyst crystal via this approach opens an interesting method for mechanism study in materials synthesis and catalysis.
🔬 Techniques
🔭 Microscopes
💻 Software
🧪 Sample Preparation
🏭 Microscope Brands
🧪 Reagent Suppliers
📷 Detectors
💻 Software Details
🏛️ Research Organizations (ROR)
Affiliated research institutions:
📋 Methods
Multiscale reaction–diffusion simulations
The fixed-bed reactor filled with SAPO-34 zeolites is formulated at two scales, i.e., catalyst crystal and catalyst ensemble scale. At the catalyst crystal scale, the dynamics of MTO reaction is interpreted as the contributions of adsorption, diffusion and reaction kinetics 4 , 57 , detailed mathematic modelling are introduced in Supplementary Equations 1 – 10 . The effect of retained carbonaceous species in SAPO-34 on intracrystalline diffusivity of methane, methanol, ethylene, and propylene were investigated by MD. The details of MD simulations are introduced in Supplementary Figs. 14 – 16 . The adsorption isotherms for gas components in SAPO-34 zeolites at low temperature were reported in our previous work 42 , 57 . The quantitative relation between adsorption isotherm and carbonaceous species deposited in SAPO-34 zeolites was measured by Intelligent Gravimetric Analyzer 57 . The intracrystalline diffusivities and diffusion activation energies were decoupled the effect of surface barriers 42 . The parameters at catalyst ensemble scale, e.g., catalyst lifetime, gas product distribution, relative quantity of retained acid sites and quantity of carbonaceous species, were used as feedback to determine the kinetic constants, the parameters are listed in Supplementary Table 3 . Catalyst synthesis and physicochemical characterizations The synthesis procedures of SAPO-34 zeolites with different crystal size but similar Brønsted acidity and SAPO-34 zeolite with high silica content were taken from existing recipes from open literature 58 , 59 . The phase structure of the SAPO-34 was characterized by X-ray diffraction (XRD) (Supplementary Fig. 1 ). The distribution of crystal size and morphology were observed from field emission scanning electron microscope (FESEM) (Supplementary Table 1 and Supplementary Fig. 2 ). The statistical results of chemical composition of individual SAPO-34 zeolite crystals was measured by energy dispersive X-Ray spectroscopy (EDX) (Supplementary Table 1 ). The bulk chemical composition of SAPO-34 zeolite samples was analyzed by X-ray fluorescence (XRF) (Supplementary Table 1 ). The quantity of medium and strong acid sites of bulk SAPO-34 zeolite samples was measured by NH 3 temperature programmed desorption (NH 3 -TPD) (Supplementary Table 1 and Supplementary Fig. 3 ). The N 2 adsorption/desorption was used to measure the textural property of SAPO-34 zeolites (Supplementary Fig. 4 and Supplementary Table 2 ). Catalytic performance of MTO reaction Catalytic testing of MTO was done in a fixed-bed quartz reactor with inner diameter 0.004 m at 723.2 ± 0.4 K. Weight-hourly space velocity ( WHSV ) of methanol was set to 5.0 ± 0.1 g MeOH ·g zeo. −1 ·h −1 and partial pressure of methanol to 0.28 bar by flowing N 2 . In order to ensure the relative uniform distribution of carbonaceous species along the catalyst bed (Supplementary Fig. 17 ), the high WHSV was used. Online analysis of the gas products was performed with an Agilent 7890B gas chromatography (GC) equipped with FID detector and a PoraPLOT Q-HT capillary column. Detailed experimental results are shown in Supplementary Fig. 5 .
Show full methods section
Multiscale reaction–diffusion simulations
The fixed-bed reactor filled with SAPO-34 zeolites is formulated at two scales, i.e., catalyst crystal and catalyst ensemble scale. At the catalyst crystal scale, the dynamics of MTO reaction is interpreted as the contributions of adsorption, diffusion and reaction kinetics 4 , 57 , detailed mathematic modelling are introduced in Supplementary Equations 1 – 10 . The effect of retained carbonaceous species in SAPO-34 on intracrystalline diffusivity of methane, methanol, ethylene, and propylene were investigated by MD. The details of MD simulations are introduced in Supplementary Figs. 14 – 16 . The adsorption isotherms for gas components in SAPO-34 zeolites at low temperature were reported in our previous work 42 , 57 . The quantitative relation between adsorption isotherm and carbonaceous species deposited in SAPO-34 zeolites was measured by Intelligent Gravimetric Analyzer 57 . The intracrystalline diffusivities and diffusion activation energies were decoupled the effect of surface barriers 42 . The parameters at catalyst ensemble scale, e.g., catalyst lifetime, gas product distribution, relative quantity of retained acid sites and quantity of carbonaceous species, were used as feedback to determine the kinetic constants, the parameters are listed in Supplementary Table 3 . Catalyst synthesis and physicochemical characterizations The synthesis procedures of SAPO-34 zeolites with different crystal size but similar Brønsted acidity and SAPO-34 zeolite with high silica content were taken from existing recipes from open literature 58 , 59 . The phase structure of the SAPO-34 was characterized by X-ray diffraction (XRD) (Supplementary Fig. 1 ). The distribution of crystal size and morphology were observed from field emission scanning electron microscope (FESEM) (Supplementary Table 1 and Supplementary Fig. 2 ). The statistical results of chemical composition of individual SAPO-34 zeolite crystals was measured by energy dispersive X-Ray spectroscopy (EDX) (Supplementary Table 1 ). The bulk chemical composition of SAPO-34 zeolite samples was analyzed by X-ray fluorescence (XRF) (Supplementary Table 1 ). The quantity of medium and strong acid sites of bulk SAPO-34 zeolite samples was measured by NH 3 temperature programmed desorption (NH 3 -TPD) (Supplementary Table 1 and Supplementary Fig. 3 ). The N 2 adsorption/desorption was used to measure the textural property of SAPO-34 zeolites (Supplementary Fig. 4 and Supplementary Table 2 ). Catalytic performance of MTO reaction Catalytic testing of MTO was done in a fixed-bed quartz reactor with inner diameter 0.004 m at 723.2 ± 0.4 K. Weight-hourly space velocity ( WHSV ) of methanol was set to 5.0 ± 0.1 g MeOH ·g zeo. −1 ·h −1 and partial pressure of methanol to 0.28 bar by flowing N 2 . In order to ensure the relative uniform distribution of carbonaceous species along the catalyst bed (Supplementary Fig. 17 ), the high WHSV was used. Online analysis of the gas products was performed with an Agilent 7890B gas chromatography (GC) equipped with FID detector and a PoraPLOT Q-HT capillary column. Detailed experimental results are shown in Supplementary Fig. 5 .
Characterization of acidity and carbonaceous species
The time-evolution manners of average Brønsted acidity of bulk SAPO-34 zeolites during MTO reactions were recorded by diffuse reflectance infrared Fourier transform (DRIFT) spectra as shown in Supplementary Fig. 8 . The removal of retained carbonaceous species was measured by thermogravimetric analysis (TGA) and differential thermogravimetry (DTG) (DTG profiles are shown in Supplementary Fig. 9 ). DR (diffuse reflectance) UV/vis spectra 22 , 46 were performed with a VARIAN Cary-5000 UV–Vis-NIR spectrophotometer. Spent SAPO-34 zeolites were placed in PIKE cell with a temperature controller and its lid was equipped with quartz window. 15 mg of catalyst was dissolved in 1 mL of a 20 wt% HF solution in a Teflon container for 6 h 60 . The organic compounds were extracted by addition of 1 mL CH 2 Cl 2 with 100 ppm internal standard C 2 Cl 6 for 1 h. Analysis of the extracted phase was performed on an Agilent 7890A/5975C GC/MS instrument, equipped with a HP-5 capillary column and FID detector. Then the carbonaceous species in the extracted phase were then mixed with matrix 1,8,9-anthracenetriol and further analyzed by a 15-T SolariX XR FT-ICR MS (Bruker Daltonics) 55 . The instrument was equipped with a Nd:YAG laser ( λ = 335 nm) and a time-of-flight mass analyzer in reflection mode. Positive ion mass spectra were recorded in the mass region between 200 and 3000 Da. The color changes of SAPO-34 zeolites used for MTO reaction were observed with an Olympus IX73 upright microscopy by using a ×40 0.6 NA high working-distance microscopy objective lens. Time-dependent density functional theory calculations In order to differentiate the carbonaceous species by SIM technique, TDDFT calculations 61 were performed to identify the excitation (first excitation energy, group state S 0 ) and emission (excited state S 1 ) wavelengths and understand the phosphorescence behavior of different carbonaceous species. Details are included in “time-dependent density functional theory” of Supplementary Information.
Imaging of carbonaceous species in zeolite crystals by SIM
The super-resolution imaging was carried out using a Nikon N-SIM super-resolution microscopy system with a motorized inverted microscopy ECLIPSE Ti2-E, a ×100/NA 1.49 oil immersion TIRF objective lens (CFI HP) and ORCA-Flash 4.0 sCMOS camera (Hamamatsu Photonics K.K.) 20 , 21 . The wavelengths of illumination and emission detection of SIM used in this work are 405 (detection at 435–485 nm), 488 (detection at 500–545 nm), 561 (detection at 570–640 nm), and 640 nm (detection at 663–738 nm), respectively, which can cover the characteristic area of excitation and emission wavelengths of B n + , N n + , PH n + , and PYR n + . In the measurements, each illustration channel of SIM works independently, and the corresponding detector collects the light signal of emission. Images were taken at a Z -plane of middle of zeolitic crystal. The software NIS-Elements Ar and N-SIM Analysis were used to analyze the collected images and computationally reconstruct the super-resolution image as shown in Supplementary Figs. 10 – 13 . To ensure the high-resolution of images can be obtained by SIM technique, the glass-bottomed culture dish (35-mm dish with 20-mm well) loaded with the sample has to be placed close to the objective lens. Therefore, in this work, the imaging experiments by SIM technique were not performed at reactive conditions to protect objective lens. The results of UV–vis spectra operated under reactive and non-reactive MTO conditions can potentially provide reference for SIM. Borodina et al. 47 found that the UV–vis spectra of carbonaceous species formed at high reaction temperatures (i.e., 573–773 K) show only minor changes after the cooling down to room temperature. Essentially the band of UV–vis spectra at 334 nm, which is assigned to low methylated benzene carbocations, shifts around 10 to 343 nm. Based on this, the imaging experimental results under non-reactive conditions might be used to reflect the situations under reactive conditions with good confidence, as evidenced by Fig. 3 and Supplementary Fig. 6 , in which the simulated results agree well with SIM results in qualitative.
Supplementary information Supplementary Information Peer Review File
📊 Figures
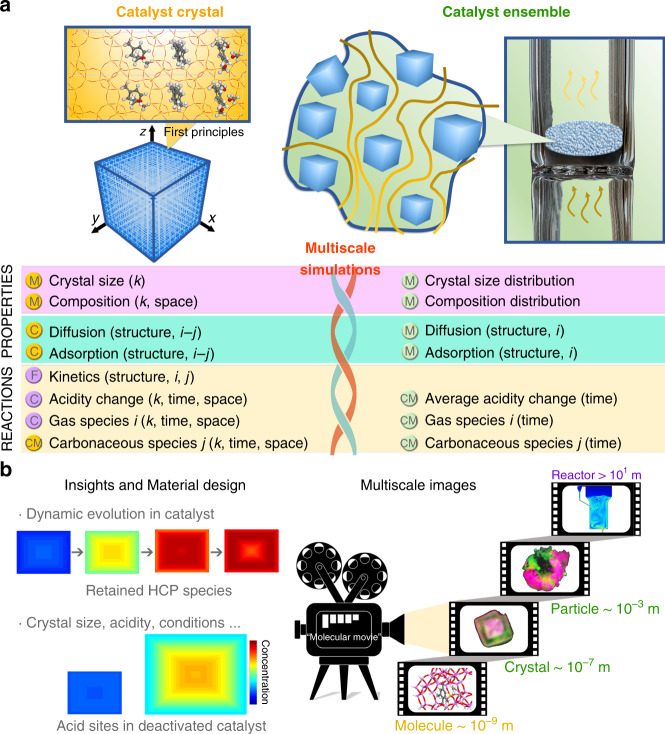
Fig. 1
Deep data integrates simulations and experiments in application for u2018molecular movieu2019.
a Implementation of the deep data approach to MTO reactions: merging experimental data into multiscale reactionu2013diffusion modelling. M is measurable, C is calculable, and F is the feedback from ex...
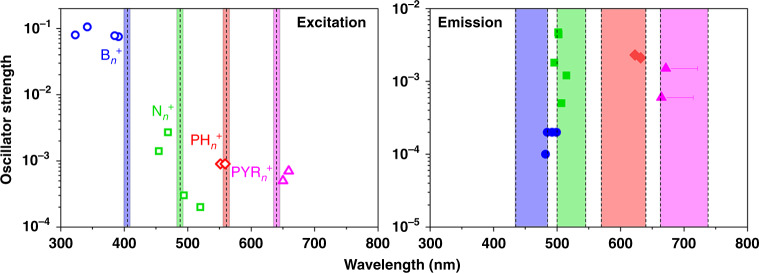
Fig. 2
Calculated excitation and emission wavelengths of charged carbonaceous species.
Simulated excitation (first excitation energies) 49 , 50 , emission (excited states) wavelengths, and oscillator strength of charged carbonaceous species in gas phase calculated at the B3LYP/6-31G (d,...
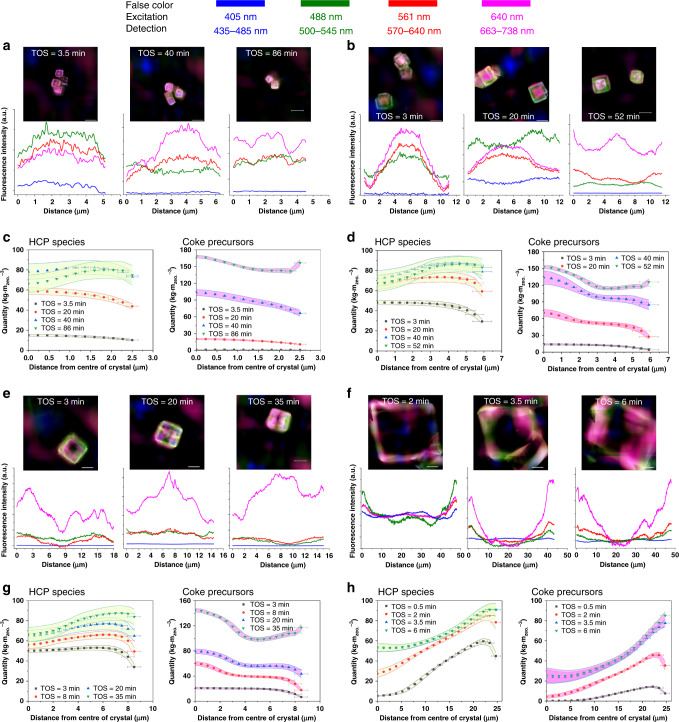
Fig. 3
SIM images and multiscale reactionu2013diffusion simulations of an SAPO-34 zeolite crystal.
The spatiotemporal distribution of carbonaceous species obtained from SIM and simulations in a , c SAPO-34-5 (4.82u2009u00b1u20090.36 u03bcm), b , d SAPO-34-12 (11.17u2009u00b1u20091.80 u03bcm), e , g...
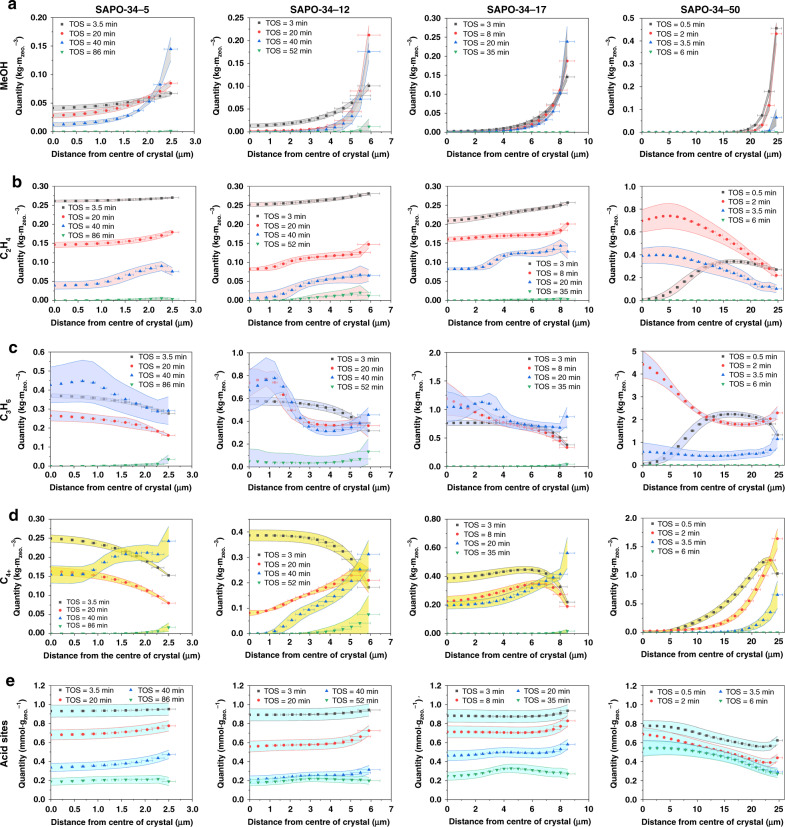
Fig. 4
Spatiotemporal evolution of gas molecules and acid sites in SAPO-34 zeolite crystals.
Simulated spatiotemporal evolution of concentration of a methanol, b ethylene, c propylene, d C 4+ , and e acid sites in SAPO-34-5, SAPO-34-12, SAPO-34-17, and SAPO-34-50 crystals during MTO reactions...
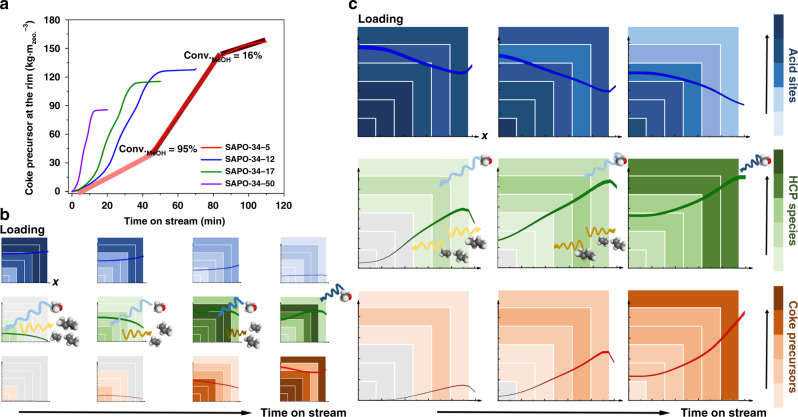
Fig. 5
Molecular reactionu2013diffusion mechanism during MTO reaction at the zeolite crystal level.
a The evolution of coke precursors at the rim of SAPO-34 zeolite crystals with different crystal size. b , c Schematics of spatiotemporal evolution of acid sites, HCP species and coke precursors durin...
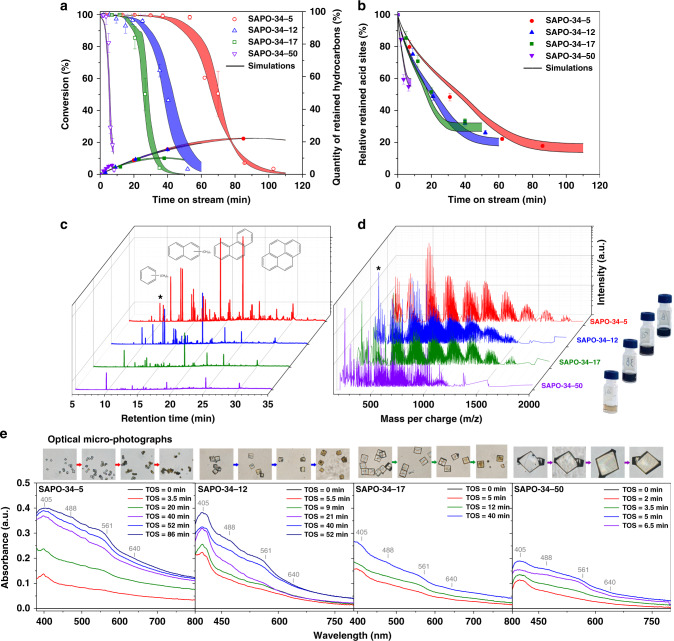
Fig. 6
Multiple spectroscopy used for monitoring MTO reaction catalyzed by SAPO-34 zeolites.
a Methanol conversion analyzed by online GC and the content of retained carbonaceous species measured by TGA. b The relatively quantitative evolution of residual Bru00f8nsted acidity inside SAPO-34 ze...
Figure images are served from the NIH/NLM PubMed Central Open Access Subset or Europe PMC; copyright remains with the publishers and authors.
💬 Discussion
0 commentsNo comments yet. Be the first to start a discussion!
Leave a Comment