Abstract
Injectisomes are multi-protein transmembrane machines allowing pathogenic bacteria to inject effector proteins into eukaryotic host cells, a process called type III secretion. Here we present the first three-dimensional structure of Yersinia enterocolitica and Shigella flexneri injectisomes in situ and the first structural analysis of the Yersinia injectisome. Unexpectedly, basal bodies of injectisomes inside the bacterial cells showed length variations of 20%. The in situ structures of the Y. enterocolitica and S. flexneri injectisomes had similar dimensions and were significantly longer than the isolated structures of related injectisomes. The crystal structure of the inner membrane injectisome component YscD appeared elongated compared to a homologous protein, and molecular dynamics simulations documented its elongation elasticity. The ring-shaped secretin YscC at the outer membrane was stretched by 30-40% in situ, compared to its isolated liposome-embedded conformation. We suggest that elasticity is critical for some two-membrane spanning protein complexes to cope with variations in the intermembrane distance. DOI:http://dx.doi.org/10.7554/eLife.00792.001.
🔬 Techniques
🔭 Microscopes
🧬 Organisms
💻 Software
✨ Fluorophores
🧪 Sample Preparation
🔬 Cell Lines
🏭 Microscope Brands
🧪 Reagent Suppliers
📷 Detectors
🔎 Objectives
💻 Software Details
📋 Protocols
💾 Data Repositories
🏛️ Research Organizations (ROR)
Affiliated research institutions:
📋 Methods
Bacterial strains, plasmids, and genetic construction E. coli BW19610 ( Howitt et al., 2006 ) used for cloning and E. coli Sm10 λ pir + used for conjugation were routinely grown in Luria broth (LB) or on LB agar (LA) plates at 37°C. Streptomycin was used at a concentration of 100 μg/ml to select for suicide vectors. All Y. enterocolitica strains are derivates of E40 ( Sory et al., 1995 ), where for biosafety reasons six effector genes were deleted, as well as the asd gene. They were routinely grown at 25°C in brain heart infusion (BHI) broth containing 35 μg/ml nalidixic acid. To allow growth of asd mutant strains, the medium was supplemented with 50 μg/ml meso-diaminopimelic acid. Shigella flexneri SC560 ( Sansonetti, 1991 ) were routinely grown at 37°C in BHI containing 100 μg/ml streptomycin. Mutator plasmid pMK3 was made by amplification of the asd 5′ region with oligos 3541/3543 and the 3′ region with oligos 3542/3544. The 5′ region was digested with Sal I/ Eco RI and the 3′ region with Eco RI/ Xba I. Both fragments together were ligated into the Sal I/ Xba I restriction site of pKNG101. To construct pMA87, flanking regions of about 250 bp just upstream and downstream of minD were amplified from purified genomic DNA from Y. enterocolitica E40 using oligonucleotides 6416/6417 and 6418/6419 respectively ( Supplementary file 1C,D ). The two fragments were joined by overlapping polymerase chain reaction (PCR), and the resulting fragment was cloned into the Sal I /Xba I restriction sites of suicide vector pKNG101 ( Kaniga et al., 1991 ). To construct pMA6, full-length yscC with a stop codon was amplified from the pYVe40 plasmid using primers 5013/5014 and introduced into the Nco I/ Eco RI restriction sites of pBAD/mycHisA. Cultures were inoculated at an optical density (OD 600 ) of 0.1 in BHI broth containing sodium oxalate (20 mM) (BHI-OX) supplemented with glycerol (4 mg/ml) and MgCl 2 (20 mM). After 2 hr of growth at 25°C, induction of the yop regulon was performed by shifting the culture to 37°C ( Cornelis et al., 1987 ). Expression of the pBAD constructs was induced by adding 0.03% L-arabinose to the culture just before the shift to 37°C. After 4 hr of incubation at 37°C, cultures were used for further analysis.
Show full methods section
Bacterial strains, plasmids, and genetic construction E. coli BW19610 ( Howitt et al., 2006 ) used for cloning and E. coli Sm10 λ pir + used for conjugation were routinely grown in Luria broth (LB) or on LB agar (LA) plates at 37°C. Streptomycin was used at a concentration of 100 μg/ml to select for suicide vectors. All Y. enterocolitica strains are derivates of E40 ( Sory et al., 1995 ), where for biosafety reasons six effector genes were deleted, as well as the asd gene. They were routinely grown at 25°C in brain heart infusion (BHI) broth containing 35 μg/ml nalidixic acid. To allow growth of asd mutant strains, the medium was supplemented with 50 μg/ml meso-diaminopimelic acid. Shigella flexneri SC560 ( Sansonetti, 1991 ) were routinely grown at 37°C in BHI containing 100 μg/ml streptomycin. Mutator plasmid pMK3 was made by amplification of the asd 5′ region with oligos 3541/3543 and the 3′ region with oligos 3542/3544. The 5′ region was digested with Sal I/ Eco RI and the 3′ region with Eco RI/ Xba I. Both fragments together were ligated into the Sal I/ Xba I restriction site of pKNG101. To construct pMA87, flanking regions of about 250 bp just upstream and downstream of minD were amplified from purified genomic DNA from Y. enterocolitica E40 using oligonucleotides 6416/6417 and 6418/6419 respectively ( Supplementary file 1C,D ). The two fragments were joined by overlapping polymerase chain reaction (PCR), and the resulting fragment was cloned into the Sal I /Xba I restriction sites of suicide vector pKNG101 ( Kaniga et al., 1991 ). To construct pMA6, full-length yscC with a stop codon was amplified from the pYVe40 plasmid using primers 5013/5014 and introduced into the Nco I/ Eco RI restriction sites of pBAD/mycHisA. Cultures were inoculated at an optical density (OD 600 ) of 0.1 in BHI broth containing sodium oxalate (20 mM) (BHI-OX) supplemented with glycerol (4 mg/ml) and MgCl 2 (20 mM). After 2 hr of growth at 25°C, induction of the yop regulon was performed by shifting the culture to 37°C ( Cornelis et al., 1987 ). Expression of the pBAD constructs was induced by adding 0.03% L-arabinose to the culture just before the shift to 37°C. After 4 hr of incubation at 37°C, cultures were used for further analysis.
Y. enterocolitica minicells generation
Mutant strains forming minicells were generated by a two-step allelic exchange ( Kaniga et al., 1991 ). The Y. enterocolitica parent was mated on a plate with E. coli Sm10 λ pir + containing the corresponding mutator plasmid. To select for integration of the mutator plasmid the conjugation mix was plated on nalidixic acid and streptomycin. In a second step, the streptomycin selection pressure was released during several generation times allowing the excision of the mutator plasmid. Plating on LB agar containing 5% sucrose allowed selection for colonies that underwent the second recombination step and had lost the mutator plasmid. These colonies were screened for the mutant allele by colony PCR. As an exception, yadA mutants were made by insertion of the entire mutator plasmid pLJM31 into yadA. To avoid wild-type revertants by excision of the plasmid, constant streptomycin selection was applied.
Secretion analysis and immunoblotting
Bacteria and supernatant (SN) fractions were separated by centrifugation at 20,800 g for 10 min at 4°C. The cell pellet was taken as total cell (TC) fraction. Proteins in the supernatant were precipitated with trichloroacetic acid 10% (wt/vol) final for 1 hr at 4°C. SN and TC fractions were separated on a 12% or 15% SDS-PAGE, respectively. In each case, proteins secreted (SN) by 3 × 10 8 bacteria or produced (TC) by 1 × 10 8 bacteria were loaded per lane. Immunoblotting was carried out using rabbit polyclonal antibody against YscD (internal number MIPA232; 1:1000). Detection was performed with the swine anti-rabbit secondary antibodies conjugated to horseradish peroxidase (1:5000; Dako), before development with the LumiGLO Reserve chemiluminescent substrate (KPL).
Fluorescence microscopy
For fluorescence imaging, about 2 µl of bacterial culture (see above) were placed on a microscope slide layered with a pad of 2% agarose in PBS. A Deltavision Spectris optical sectioning microscope (Applied Precision, Issaquah, WA) equipped with an UPlanSApo 100×/1.40 oil objective (Olympus, Tokyo, Japan) and a coolSNAP HQ CCD camera (Photometrics, Tucson, AZ) was used to take differential interference contrast (DIC) and fluorescence photomicrographs. GFP filter sets (Ex 490/20 nm, Em 525/30 nm) were used for GPF visualization. DIC frames were taken with 0.1 s and fluorescence frames with 1.0 s exposure time. Per image, a Z-stack containing 20 frames per wavelength with a spacing of 150 nm was acquired. The stacks were deconvolved using softWoRx v3.3.6 with standard settings (Applied Precision). A representative DIC frame and the corresponding fluorescence frame were selected and further processed with the ImageJ software. YscC purification and reconstitution on liposomes The pYV–cured Y. enterocolitica strain carrying plasmids pMA6 and pRS6 ( Allaoui et al., 1995 ) containing the yscC and yscW genes, respectively, was grown in BHI broth. To induce expression of yscC , bacteria were inoculated at OD 600 = 0.1 in BHI-Ox broth supplemented with glycerol (4 mg/ml), MgCl 2 (20 mM), ampicillin (100 mg/ml), nalidixic acid (25 μg/ml), and tetracycline (10 μg/ml). The culture was grown for 2 hr at room temperature, induced with 0.05% arabinose and grown for 6 hr at 37°C. The entire YscC purification was performed on ice. Bacterial cells were washed with 0.9% NaCl, resuspended in 50 mM Tris-HCl pH 8.5 and 1 mM EDTA and disrupted using a sonicator. The membrane fraction was isolated by ultracentrifugation for 1 hr at 150,000× g (4°C), and membrane proteins were solubilized in buffer containing 2% DDM (n-dodecyl-β-D-maltopyranoside, Anatrace), 50 mM Tris-HCl pH 7.8, 250 mM NaCl, 5 mM EDTA and protease inhibitor (complete protease inhibitor, Roche) for 1.5 hr at room temperature. Insoluble material was removed by ultracentrifugation for 1 hr at 150,000× g (4°C). After the addition of sucrose to a final concentration of 15% (wt/wt), the extracted membrane proteins were layered on top of a 20–40% (wt/wt) sucrose gradient in gradient buffer (0.04% DDM, 50 mM Tris-HCl pH 7.8, 250 mM NaCl, 5 mM EDTA, protease inhibitor) and centrifuged at 38,000 rpm in an SW41 rotor (Beckman) for 30 hr. Fractions containing YscC were dialyzed against chromatography buffer (0.04% DDM, 10 mM Tris-HCl pH 7.8, 100 mM NaCl, 0.1 mM EDTA) and loaded on MonoQ 5/50 GL IEC (GE Healthcare). YscC was eluted at 400–500 mM NaCl. The pure YscC oligomers were separated from YscC oligomer dimers and small contaminants by gel filtration using a Superose 6 10/300 GL column (GE Healthcare). Fractions containing YscC were stored at −20°C for electron microscopy. To reconstitute YscC into liposomes, the purified secretin (0.2 mg/ml) was mixed with DDM-solubilized E. coli polar lipids at 5:1 lipid-to-protein ratio and vigorously mixed overnight with Bio-Beads (Bio-Rad, Hercules, CA) at room temperature. Cryo-EM imaging (see below) showed that most of the proteins were facing outside of the lipid vesicles.
Sample processing for CEMOVIS
Samples we prepared according to the protocol described elsewhere, with slight modifications ( Bleck et al., 2010 ). In brief, for cryo-electron microscopy of vitrified sections (CEMOVIS), gently spun bacteria were resuspended in a final concentration of 20% dextran in phosphate buffer system (PBS, dextran: average molecular mass 40 kDa; Sigma-Aldrich). Afterwards the mixture was introduced into specimen copper tubes (Cat.# 16706871, Leica Vienna, Austria) and vitrified with an EMPACT-2 high-pressure freezer (Leica). Ultrathin sections (50–60 nm) from vitreous cells were obtained using a FC7/UC7-ultramicrotome (Leica). Sections were collected on Quantifoil grids (3.5/1), and mounted into Titan Autoloader cartridges (FEI, Eindhoven, Netherlands). Imaging was done with an FEI Titan Krios (300 kV accelerating voltage, Cs = 2.8 mm) at a nominal defocus of −6 µm; images were recorded on a Gatan US4000 CCD camera; the total electron dose for imaging was kept below 4000 e/nm 2 . CEMOVIS yielded an average inter-membrane distance of 35 nm measured between the centres of electron density ( Figure 2—figure supplement 2 ), documenting that the plunge-frozen bacteria for the injectisome structure studies had not suffered significant dehydration or changes in buffer osmolarity prior to rapid freezing. E. coli K12 minicells have an average membrane to membrane distance of slightly over 30 nm ( Liu et al., 2011 ), and the evolutionary related bacterial flagellar motors show inter-membrane distances in the range of 28–40 nm (measured from Figure 1 in reference Chen et al. [2011] ).
Cryo electron tomography
Yersinia enterocolitica cells or minicells or S. flexneri SC560 were supplemented with 5% of 10 nm gold beads, placed on holey carbon grids (Quantifoil Micro Tools GMBH, Germany), quickly vitrified using a FEI Vitrobot IV (FEI Corp, Hillsboro), and imaged at liquid nitrogen temperatures in an FEI Titan Krios (FEI Corp, Hillsboro) operated at 300 kV acceleration voltage and equipped with a GIF and an US1000 CCD camera (Gatan Inc, Pleasanton). The magnification calibration of the FEI Titan Krios and GIF/CCD detectors was verified, using a gold lattice, vitrified tabacco mosaic virus sample, and graphene ( Pantelic et al., 2011 ), and found to be precise to better than 2%. Tomograms were collected at 2 or 3° increments over a 120° range. The total electron dose was less than 10,000 electrons/nm 2 for regular tomograms and less than 20k electrons/nm 2 for focal pair tomograms ( Kudryashev et al., 2012b ). Tomograms were aligned with the aid of the gold beads using the eTomo software ( Kremer et al., 1996 ), and reconstructed using Matlab based Dynamo scripts ( Castano-Diez et al., 2012 ).
Image processing procedures for sub-volume averaging
High defocus tomographs from focal pairs and tomograms of minicells were aligned by gold marker fiducials using eTomo ( Kremer et al., 1996 ) and reconstructed by weighted back projection using custom written Matlab scripts. Central positions and directions of needles were manually determined for 421 injectisomes from the tomograms of minicells and for 1490 injectisomes from tomograms of regular sized cells acquired as focal pairs. Injectisomes were extracted to volumes of 128×128×128 voxels. Low-defocus (high resolution) particles were generated by a combination of global high- and low-defocus tilt series alignment, followed by refinement of patches of micrographs around the injectisomes. This used the ‘local feature refinement’ method described in more details in reference ( Kudryashev et al., 2012b ). From 1490 particles, 520 were selected for high-resolution processing based on having good correlation of high- and low-defocus injectisome volumes to each other. In addition, some tomograms of particles that did not contain projections of the injectisomes in all low-defocus tilt series images were also discarded. An initial average structure was produced as a sum of all injectisomes with the volumes rotated such that the needles were pointing into the same (vertical) direction. Next, multiple rounds of alignment with restricted angular rotation ranges were performed on high-defocus particles and on minicell dataset particles, considering only voxels within a mask on the needle and the outer membrane area with a pixel size of 1.48 nm ( Figure 2—figure supplement 1 ). The information about the missing wedge was used to constrain correlation during alignment of particles to the average, and appropriate Fourier component weighting was performed during generating the average at the end of each iteration. Next, two independent alignments were calculated with two different soft masks: one containing the outer membrane and the needle structures, and another one containing the cytoplasmic membrane and the needle structure ( Figure 2—figure supplement 1 ). During alignment we imposed 19-fold axial symmetry to the reference at the start of each iteration, while we applied 12-fold rotational symmetry to the final structures. The two resulting structures were aligned against each other by cross correlation maximization. Cropping them together approximately in mid-height between the two membranes produced a merged structure. The resulting volume was limited to 4 nm resolution, which was determined from gold standard Fourier Shell Correlation (FSC) processing using the FSC = 0.143 offset ( Figure 2—figure supplement 1D , and ‘Gold standard FSC image processing’). The FSC in Figure 2—figure supplement 1C was produced as an average FSC inside the two used alignment masks. The processing was done by AV3 processing package for Matlab ( Forster et al., 2005 ), in-house written scripts, and our Dynamo software tool for user-friendly sub-tomogram averaging ( http://www.dynamo-em.org ) ( Castano-Diez et al., 2012 ). For the initial alignment of YscC we manually clicked into the membrane part and inside the liposome in order to establish the initial orientation of the molecule for 282 particles. We used a featureless plane with a ball as an initial reference for the alignment, after which the half of particles with higher correlation coefficient contributed to the reference for next iteration. Volume-rendered visualizations were produced semi-automatically with Amira ( http://www.amira.com ). The reconstruction of the Y. enterocolitica injectisome will be deposited to the EMD upon acceptance of the manuscript. ‘Gold standard FSC’ image processing In order to validate the resolution of the averaged injectisome structure, we randomly separated 624 manually pre-aligned particles into two independent sets and processed them independently with the same parameters ( Scheres and Chen, 2012 ) using Dynamo, performing the following steps: Two initial reference structures were generated using the parameters of the initial manual pre-alignment. These structures were noisy and unstructured. Restricted iterative alignment of each set independently was performed, using an alignment mask on the basal bodies and the needle. A rough alignment and averaging was performed with particles from the highly defocused dataset. In subsequent iterative alignments, these particles were replaced by the ‘low defocus’ particles. During the alignments, a low pass filter at 6 nm resolution was used, and a high rotational symmetry was applied. The final independent structures for the two sets were compared by Fourier shell correlation ( Figure 2—figure supplement 1D ), indicating a resolution of ∼4 nm by the ‘gold standard’ criterion (FSC = 0.143).
MRA classification of sub-volumes Iterative multi reference alignment
(MRA) was performed on injectisome sub-volumes within wide elliptical, Gaussian smoothed mask, areas with an extra weight on the needle area. 10 initial references were produces from the average structure with an addition of low, 10% Gaussian noise. Further, starting from the alignment that produced the average structure, each of the selected particles was aligned to each reference and finally contributed only to the reference to which it had the highest correlation coefficient. The maximum angular increment allowed was 4°; the maximum shift was 2 voxels. While our reconstruction made from all injectisomes did not reveal the outer second periplasmic density layer, our MRA data showed in the majority of sub-volume class averages that outer second periplasmic layer at different positions, suggesting that its height also varies among the individual injectisomes with respect to the cytoplasmic membrane. The inner (bottom) periplasmic layer was less well visible in the class averages, suggesting a less defined contact between it and the basal body. We also tried PCA + K-means classification however it contained alignment bias while MRA was free from it due to iterative alignment. YscD production and purification for crystallization Cultures were launched from E. coli Tuner (DE3) (transformed with pUWSS2 or with pUWSS3) in LB/Amp overnight at 37°C. Cells were diluted to an OD 600 of 0.1 in 2×1L LB media with ampicillin (final concentration 100 µg/ml) at 37°C. Protein production was started by adding of 0.2 mM isopropyl-β-D-thiogalactopyranoside (IPTG) at an OD 600 of 0.6–0.8. To avoid inclusion bodies temperature was lowered to 20°C and cells were further incubated for up to 18 hr. Cells were harvested by centrifugation at 6000× g , 4°C for 15 min, and resuspended in 1× PBS. Cell lysis was carried out either by cell disrupter (Constant Systems Ltd, Kennesaw, GA) or by sonication. Cell debris was separated from protein solution by centrifugation at 16,000 rpm (rotor SS-34) for 40 min. GST-YscD variants were batch bound on Protino Glutathione Agarose 4B beats (Macherey and Nagel), which had been equilibrated in 1× PBS. Unbound protein was washed with 12 column volumes (CV) of 1× PBS and with 8 CV of protease buffer (50 mM Tris, pH 7.5, 150 mM NaCl, 1 mM DTT, 1 mM EDTA). Loaded beats were resuspended in 10 ml of protease buffer. YscD variants were cleaved from the GST-tag by addition of 200 units of PreScission Protease (GE Healthcare) and kept overnight at 4°C. The YscD 150–362 or YscD 150–347 G283P protein in the supernatant was used for further purification steps. YscD 150–362 was dialyzed in ion exchange column (IEC) buffer A (20 mM HEPES pH 7.0, 60 mM NaCl at 4°C) and impurities bound on a MonoQ 10/10 column (GE Healthcare). Flow through contained YscD 150–362 , which was concentrated and finally polished via gel filtration (Superdex 75 16/60; GE Healthcare) in IEC buffer A. In contrast YscD 150–347 G283P supernatant was directly concentrated and one step purified on a Superdex 75 26/60 size exclusion column (GE Healthcare) using the same buffer conditions as for YscD 150–362 . Pure protein fractions were pooled concentrated to 3–6 mg/ml, flash frozen in liquid nitrogen and stored at −80°C. The identity and integrity of YscD variants was confirmed by N-terminal sequencing and mass spectrometry (HZI-in house). Crystallization, data collection, and model building of YscD 150–362 YscD 150–362 crystals for micro-seeding were obtained by mixing equal volumes of YscD 150–362 (3–6 mg/ml in IEC buffer A) with precipitant solution (0.2 M NaH 2 PO 4 , 25% [wt/vol] PEG 3350) in hanging-drop vapor-diffusion crystallization trays. Crystal clusters grew in 2–3 days at 20°C. Thereafter micro-seeding techniques were applied to grow large and single crystals in 0.2 M NaH 2 PO 4 , 11–13% (wt/vol) PEG 3350 with a protein concentration of 3–6 mg/ml at 20°C. Prior to data collection crystals were stepwise cryo-protected in 20% (wt/vol) PEG 3350, 0.2 M NaH 2 PO 4 , 15% (vol/vol) glycerol. Native data were collected at 100 K at the ‘Deutsches Elektronen-Synchrotron’ (DESY, beamline X11 in Hamburg). Iodine SAD phasing was performed after a published protocol ( Dauter et al., 2000 ) using the Cu K α radiation of a Rigaku MicroMax 7HF Cu anode equipped with a Saturn 944+ detector. Therefore YscD 150–362 crystals were soaked for 30–60 s in 500 mM KI, 40% (vol/vol) glycerol, 15% (wt/vol) PEG 3350, 0.2 M NaH 2 PO 4 and immediately flash frozen. Data sets were indexed, integrated, and scaled with the XDS/XSCALE package ( Kabsch, 2010a , 2010b ). The anomalous signal of iodine (d”/σ > 1.3) was used to 2.6 Å to solve the structure with the SAS and MRSAD protocol of Auto-Rickshaw ( Panjikar et al., 2009 ). An initial model from amino acids 152–347 was built by ARP/wARP ( Morris et al., 2003 ) and manually inspected and rebuilt using COOT ( Murshudov et al., 1997 ). Refinement was carried out with Refmac5 ( Murshudov et al., 1997 ) from the CCP4 suite ( Collaborative Computational Project, 1994 ). This model was used as a search model for the native dataset of YscD 150–362 , which also poorly refined to 2.7 Å and hence was not deposited at the Protein Data Bank ( http://www.pdb.org ). Crystallization, data collection, and model building of YscD 150–347 G283P YscD 150–347 G283P crystals grew from equal volumes of protein (5.8 mg/ml in IEC buffer A) with precipitant solution (0.15 M NaH 2 PO 4 , 20% [wt/vol] PEG 3350, 60 mM NaCl) in hanging-drop vapor-diffusion crystallization trays at 20°C (EasyXtal; QIAGEN). Crystals appeared after several days and reached full size (360 × 270 µm) after 2–3 weeks. Similar to the wild-type crystals YscD 150–347 G283P crystals were sensitive for any tested cryo-protection. Hence crystals were flash-frozen in crystallization condition without any cryo-protection and a dataset collected at 100 K at the BESSY (Berlin, MX-14.1). Crystals of G283P YscD 150–347 diffracted to 1.4 Å in the same space group as YscD 150–362 , P2 1 , but with different cell dimensions (YscD 150–362 : a = 48.2 Å, b = 29.8 Å, c = 69.9 Å, α = γ = 90°, β = 97.1°; YscD 150–347 G283P: a = 38.1 Å, b = 51.7 Å, c = 50.8 Å, α = γ = 90°, β = 106°). The data set was indexed, integrated, and scaled with the XDS/XSCALE package ( Kabsch, 2010a , 2010b ). Phases were obtained with Phaser ( Mccoy et al., 2007 ), using amino acid range 152–280 from the YscD 150–362 model as search coordinates. Residues 281–347 were built manually using COOT ( Murshudov et al., 1997 ) and refined with Refmac5 ( Murshudov et al., 1997 ) from the CCP4 suite ( Collaborative Computational Project, 1994 ). The final model of YscD 150–347 G283P was deposited at the Protein Data Bank ( http://www.pdb.org; PDB code: 4alz ). Data collection and refinement statistics are displayed in Supplementary file 1A . Rational design of an YscD mutant to achieve better resolution in X-ray crystallography The initial crystal obtained from YscD 150–362 showed a resolution of 2.7 Å ( Figure 3A ). This preliminary structure, as well as sequence-based secondary structure and disorder prediction confirmed the presence of three compact α/β domains separated by flexible linkers. We correlated structure and flexibility in the YscD 150–362 by performing MD simulations of the preliminary structure (in explicit solvent). The system was subjected to geometry optimization and molecular dynamics; after 10 ns equilibration (of RMSD, density, volume) analysis was performed on the last 70 ns of simulation. The secondary structure elements in each of the three domains of YscD were conserved during the simulation, thus confirming the structural stability of the αββαβ-ring building motif. By comparing the computed atomic positional fluctuation to the experimental β-factor of the wt crystal structure we identified the motility of the third periplasmic domain as a possible cause of the poor quality of the crystal. To improve the crystal we devised a strategy to restrain the motion of the third domain without affecting the protein fold.
Essential dynamics analysis
(EDA) was performed on the MD trajectory and anisotropic network model (ANM)—normal mode analysis (NMA) (‘Materials and methods’ below) was applied to the structure and to representative snapshots of the MD simulation. By analyzing the first modes, as independently obtained by EDA and ANM-NMA, we observed that the most relevant collective motions involved bending and rocking of the third domain with respect to the first two. Moreover the most relevant modes suggested the presence of a hinge between the second and third domain, responsible of most of the protein flexibility and causing large displacements of the third domain ( Figure 3A , wt ). To assess the role of this hinge in the observed flexibility we performed a set of in silico mutations aimed at reducing the conformational freedom in YscD. We constructed a single (G283P) mutant by atomic replacement from the preliminary crystal structure and subjected the systems to the same simulation protocol and analysis as used for the wild-type protein ( Figure 3—figure supplement 3 ). The proline substitution produced a significant damping in the protein motion and a decrease in the atomic positional fluctuation of the third domain. On the basis of these results we constructed yscD 150–347 G283P. The purified mutant protein produced more regular crystals displaying an improved diffraction pattern, reaching 1.4 Å resolution, with respect to the wild-type YscD ( Figure 3—figure supplement 1 ).
Elasticity of YscD revealed by molecular simulations
The three domains are, in YscD, arranged along a straight line, while the homologous PrgH protein adopts a more compact boot-shaped arrangement. The high flexibility of YscD, as observed in molecular dynamics simulation and predicted by ANM-NMA calculations, led us to infer that the system can access both straight and bent conformations through a stretching process involving bending/rotation of the tree domains. The YscD models presented here and the available structures of PrgH may represent two possible states, selected by experimental conditions and crystal packing among a large ensemble of accessible conformations. To test the capability of YscD to access both bent and straight conformational states, we performed free and biased molecular dynamics simulations. We reconstructed the collapsed conformation based on the structure of PrgH (PDB: 3GRO; UniProtKB: P41783 ) by performing independent structural alignment between each domain (loops excluded) of YscD and PrgH; then we used MODELLER ( Fiser et al., 2003 ) to splice together the three YscD fragments and to add and relax the loops ( Fiser et al., 2000 ). The collapsed YscD was embedded in a box of water molecules and subjected to geometry optimization and molecular dynamics; after 10 ns equilibration (RMSD, density, volume), analysis was performed on a 70 ns equilibrium simulation. As a model of the straight YscD conformation we used the system constructed from the crystal structures (see above). Additionally, we tested with a similar setup and protocol the compact and straight (as in the X-ray structure) conformation of the G283P YscD mutant. The simulations showed that both straight and bent structures constitute stable conformational states for the YscD protein. As discussed above, the straight conformer showed little variation in the domain arrangement with respect to the initial X-ray structure of YscD, although oscillations of the third domain were observed throughout the simulation. The collapsed conformation diverged slightly from the PrgH structural template, mainly due to a different extension of the flexible loops, and different conformation of the first domain, causing a different domain arrangement; in particular the angle between domains one and two changes from 82° (initial geometry/PrgH) to 24 ± 6° (average during simulation) ( Figure 3A of the main text). Nonetheless, YscD showed the ability to explore a much compact arrangement, very close to the structure of PrgH. Tertiary structure elasticity explains a facile inter-conversion between extended and compact YscD states Tertiary structure elasticity, defined as the rearrangement of tertiary structure in response to mechanical force, represents the first mode of elastic response to external stimuli. To address the tertiary structure elasticity of the periplasmic domain of YscD, a model of the wild-type YscD 152–346 protein was subjected to unbiased molecular dynamics (MD) and then to steered molecular dynamics (SMD) simulations. The construction and equilibration of the initial compact conformation is reported above. Starting form the final geometry of the MD simulation (70 ns) the system was extended according to a standard SMD procedure. The Cα of Asp152 was kept fixed to its initial position while the Cα of Ans346 was slowly pulled at the constant velocity of 0.5 Å ns −1 to reduce the effects of hydrodynamic drag force ( Hsin and Schulten, 2011 ). A constant stretching force of 5 kcal mol −1 , resulting in a thermal noise deviation of 0.35 Å, was employed to pull the Cα of Ans346 along a fixed direction. The end-to-end distance was thus increased from 6.5 nm to 11.5 nm in 100 ns, with the system opposing a force of 35 ± 15 pN for the first 60 ns (100 nm extension); this value is comparable with the force computed, under similar conditions, for the protein titin ( Hsin and Schulten, 2011 ). Further stretching causes the rupture of an increasing number of hydrogen bonds within the β strands of the first and third domain, resulting in a progressive growth of the opposing force (above 150 pN). During the SMD simulation the system undergoes a complete stretching from the compact PrgH-like conformation to the fully extended conformation observed in the YscD X-ray structure. The most prominent degrees of freedom, during the extension process, are the two bending angles between neighboring domains pairs. Due to its high tertiary structure flexibility, YscD can undergo a stretching of about 5 nm without opposing significant forces. Extension of the YscD periplasmic segment has, thus, a non-negligible impact on the overall height of the basal-body. On the basis of these findings we suppose the YscD flexibility confers to the basal body the capability of reacting to variations on the periplasmic space. Molecular assembly of the YscDJ portion of the basal body A model for a 24-mer YscJ assembly (periplasmic domains) was derived by homology modeling based on the X-ray structure of the E. coli EscC homologous (PDB id: 1YJ7) ( Yip et al., 2005 ) after generating the assembly using a P6 symmetry group. The YscJ 24-mer features a compact arrangement of circular shape. The surface in contact with the outer leaflet of the inner membrane exposes charged and polar residues suitable for interaction with the lipid phosphate head-groups. Since no suitable structural template exists for the YscD ring, a particle swarm optimization procedure ( Degiacomi and Dal Peraro, 2013 ) was used to create an atomistic model of the whole inner membrane ring, as composed by a 24-mer YscD ring encircling the modeled 24-mer YscJ complex. The optimization was guided by spatial restraints extracted from the cryo-EM maps and crosslinking-derived distances from the Salmonella and Shigella D and J orthologues ( Sanowar et al., 2010 ). Namely, loose restraints based on the cryo-ET maps (height = 10 ± 2 nm, width 26 ± 2 nm, inner radius = 8 ± 2 nm) were imposed to ensure the height and width of the assembly to be smaller than, respectively, 10 nm (maximum extension of YscD prior unfolding) and 24 nm (the PrgH rings features a width of about 27 nm). 24 monomers were then distributed according to a circular symmetry imposing a radius of 8 ± 2 nm. Other loose restraints were derived from the cross-linking experiments available for the PrgH/PrgK system after sequence alignment with YscD/YscJ ( Sanowar et al., 2010 ; Schraidt et al., 2010 ), residues between 153 and 160 in YscD were forced to face the YscJ ring and, in particular the region surrounding YscJ-S214. Conformational states extracted from the simulations of the wild-type YscD monomer were used to take into account the native flexibility of YscD and eventually to build the final assembly. The protocol generated six models, all satisfying the initial restraints and producing similar YscD ring arrangement. One of those was selected and further refined by minimization to produce a final structural model of the YscD 24-mer ring interacting with the YscJ ring previously modeled. We completed the periplasmic part of the YscD ring with the transmembrane (TM) domain and the small globular cytoplasmic domain. The YscD N-terminal cytoplasmic domain has been recently crystallized for the Y. pestis homologue ( Lountos et al., 2012 ), and was modeled using this template, whereas the helical structure of the TM region and its orientation with respect to the membrane bilayer were assessed through MD simulations. The ideal helical reconstruction of the TM segment was relaxed and equilibrated in a membrane bilayer using MD simulations. These additional two domains were eventually linked to the periplasmic YscD ring structure and assembled in a 24-mer conformation. We used again our flexible docking protocol to combine the low-resolution spatial restraints obtained from the cryo-ET maps and the YscD N-terminal structure to assembly the YscD cytoplasmic 24-mer ring ( Figure 4 ).
Method details for molecular dynamics and modeling
Sequence alignments were performed using the ClustalWS algorithm and visualized/rendered with Jalview 2.7 . Jpred 3 and DisEMBL were used to perform, respectively, secondary structure and disorder predictions. The software superpose ( Krissinel and Henrick, 2004 ) from the CCP4 ( Potterton et al., 2004 ) program suite was employed to perform structural alignment based on the matching of structural motifs. Loop modeling was performed using MODELLER 9.8 ( Fiser et al., 2003 ). All molecular dynamics simulations were performed on systems assembled using the psfbgen module of VMD 1.9 ( Humphrey et al., 1996 ). The proteins were embedded in an orthorhombic box of water molecules of suitable size as to allow for a minimum distance of 12 Å between the protein and any of the box faces. The web-based H++ application ( Gordon et al., 2005 ) was used to calculate the pKa of titratable residues; since no relevant discrepancies with respect to tabulated values were found, standard protonation states were assigned. A suitable number of ions (Na+ or Cl−) were randomly placed in the box using the autoionize module of VMD as to neutralize the system’s net charge. All simulated systems were treated at the molecular mechanics (MM) level using the CHARMM22/CMAP ( MacKerell et al., 1998 ; Mackerell et al., 2004 ) force field for protein and ions. The TIP3P model ( Jorgensen et al., 1983 ) was employed for water molecules when an explicit solvation was required. Otherwise the effects of the water were accounted for by means of the generalized born (GB) implicit solvent model. The van der Waals interaction cutoff distances were set at 12 Å and long-range electrostatic forces were computed using the particle-mesh Ewald summation method with a grid size of
📊 Figures
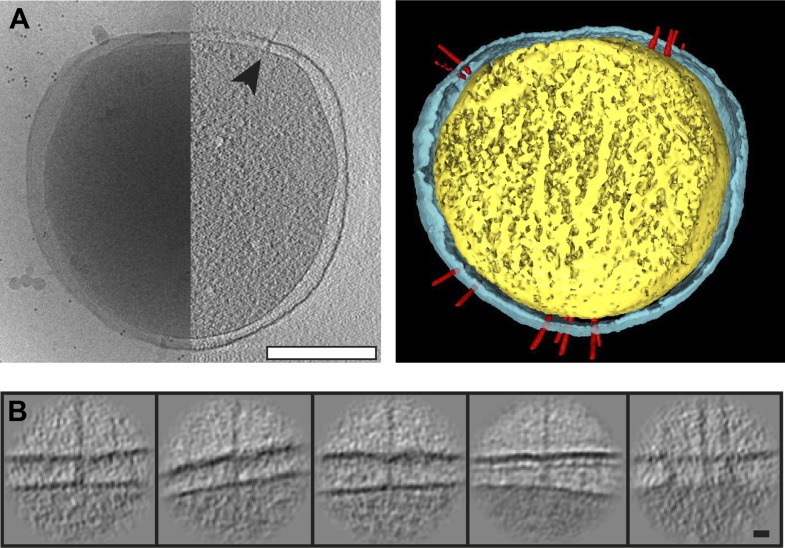
Figure 1.
Visualization of Y. enterocolitica injectisomes in situ.
( A ) Left: cryo-EM image of a Yersinianenterocolitica bacteria (left half of the panel) and a 20-nmnthick slice through a tomogram of the bacteria, showing an injectisomen(right half of the panel, bl...
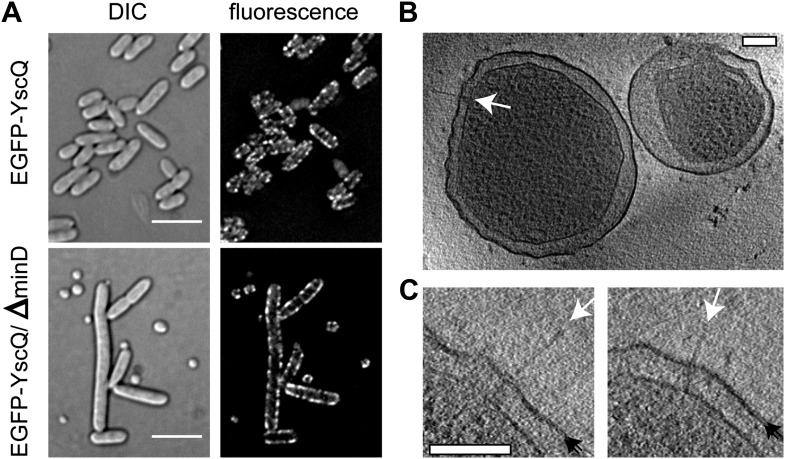
Figure 1u2014figure supplement 1.
Y. enterocolitica minicells.
( A ) Differential interference contrast (DIC) (left) andnfluorescence (right) imaging of regular (top) and minD mutant (bottom) Y. enterocolitica cells. Minicellsnappear together with extra-long bact...
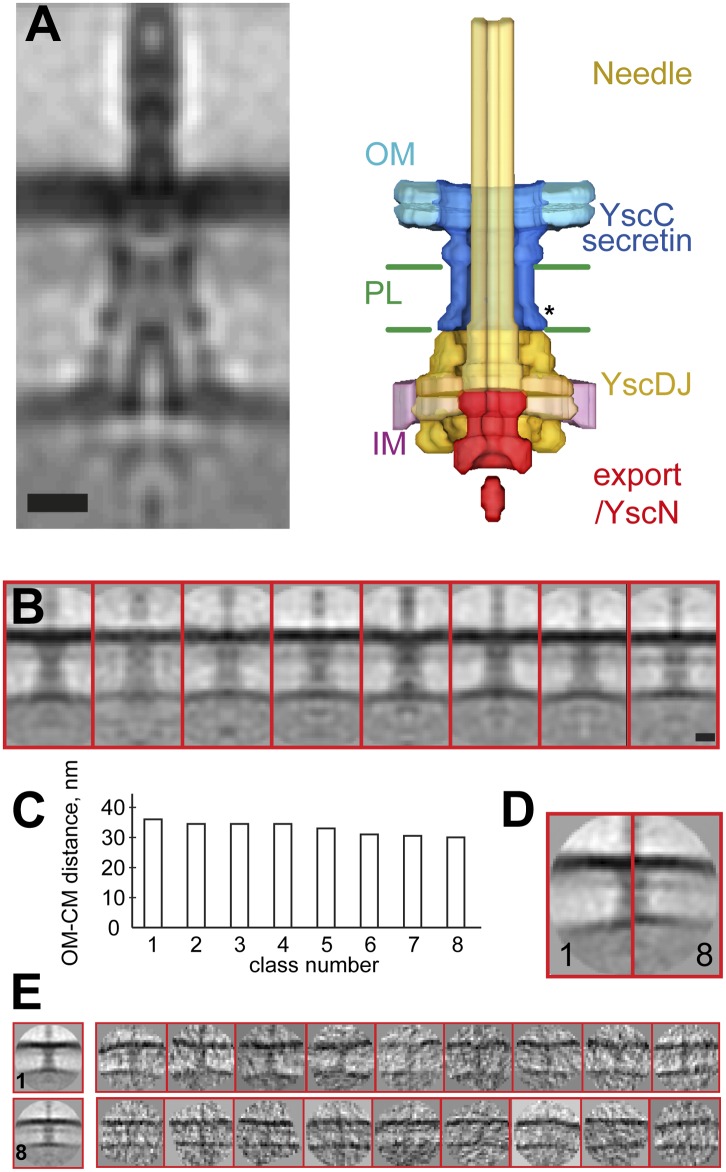
Figure 2.
Structure of the Y. enterocolitica injectisome in situ.
( A ) Slice through the average 3D structure of theninjectisome and a model with indicated components. OMu2013outernmembrane, PLu2013peptidoglycan layers, IMu2013inner membrane,n* indicates the juncti...
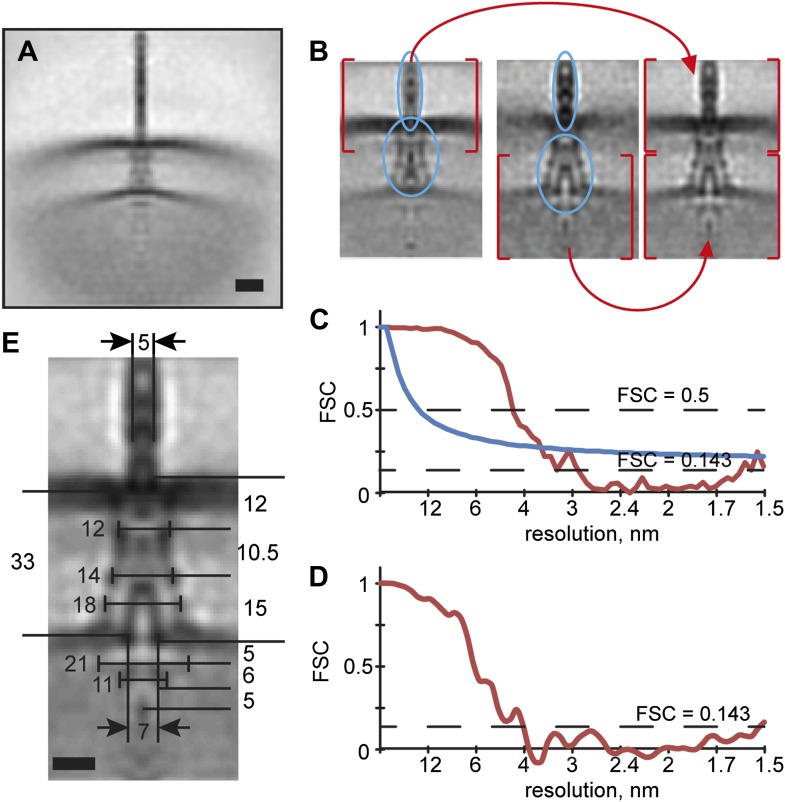
Figure 2u2014figure supplement 1.
Structural elasticity of the injectisome.
( A ) Initial alignment of the injectisomes to the commonnorigin. Scale bar: 20 nm. ( B ) A composite average isnproduced by merging two independent alignments focusing on regions at thenouter membran...
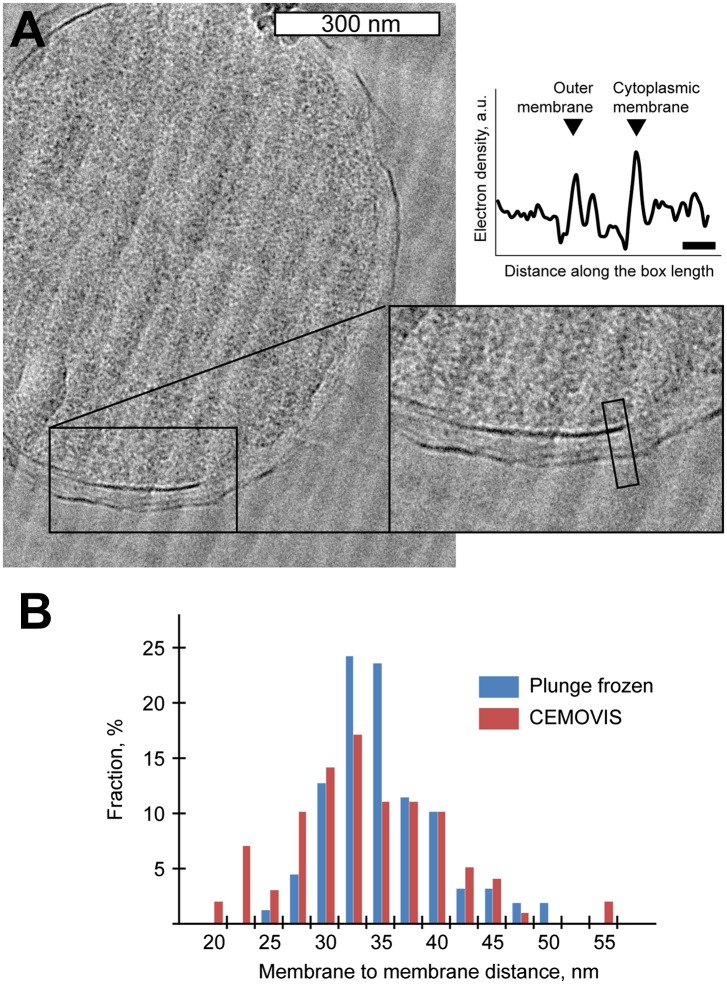
Figure 2u2014figure supplement 2.
Comparison of membrane-to-membrane distance using CEMOVIS and cryo-ET of plunge frozen Y. enterocolitica .
( A ) A micrograph from cryo-electron microscopy of vitrifiednsections (CEMOVIS) of high-pressure frozen bulk solution of Y.nenterocolitica bacteria , showing thendistance between the membranes. Inset...
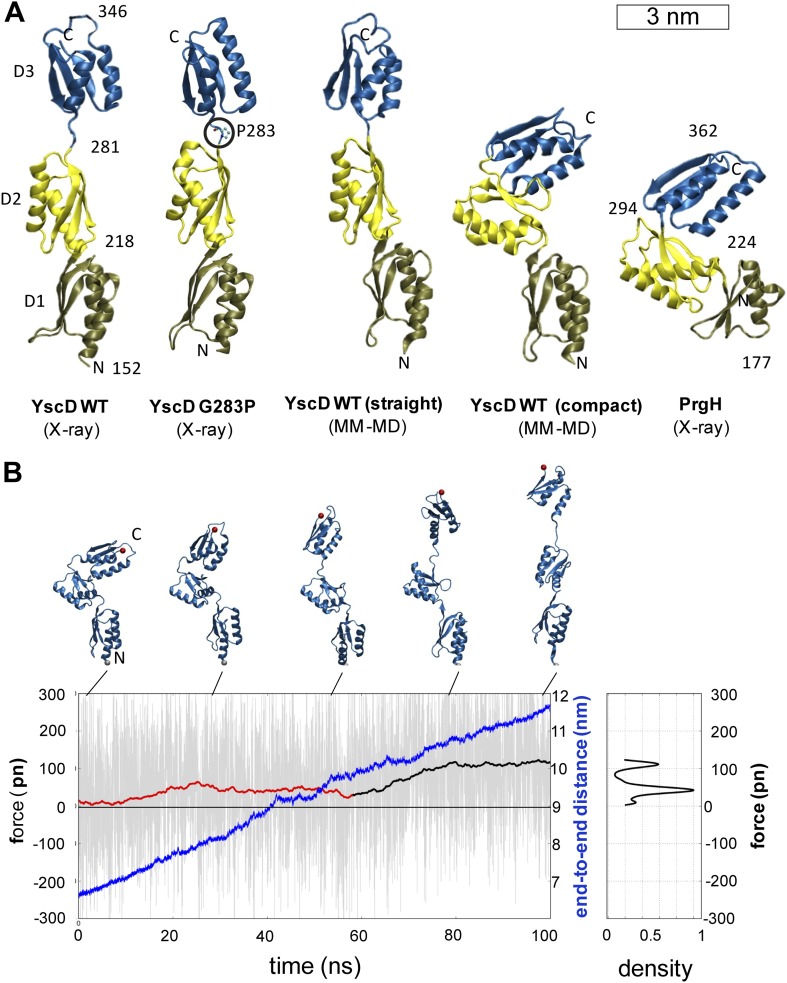
Figure 3.
Structural elasticity of YscD.
( A ) Comparison of different conformers of YscD with thenstructure of PrgH ( Spreter et al.,n2009 ); from left to right: X-ray structures of wild type andnG283P mutant (mutation highlighted by a blac...
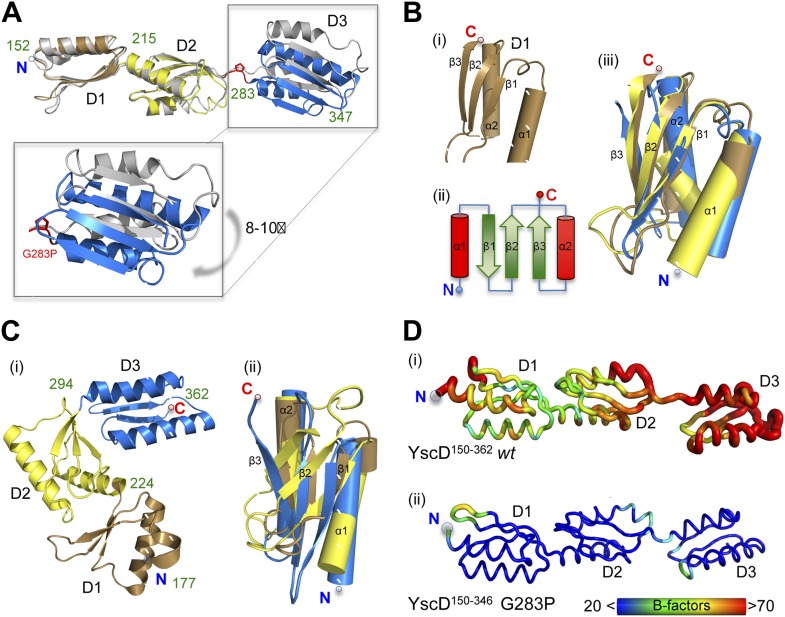
Figure 3u2014figure supplement 1.
Comparison of YscD150u2013362 wt, YscD150u2013347 G283P, and PrgH crystal structures.
( A ) Superposition of YscD 150u2013362 (grey) wt and YscD 150u2013347 G283Pn(periplasmic domain D1, D2 and D3 are colored in brown, yellow and blue,nrespectively). Domain boundaries are labeled with ...
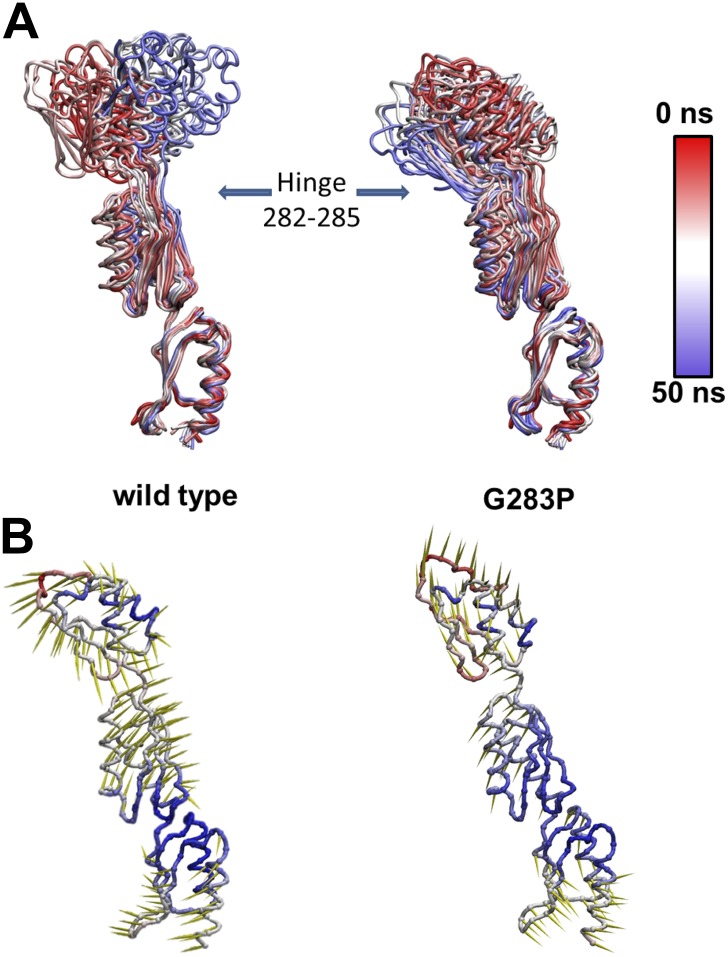
Figure 3u2014figure supplement 2.
Effect of G238P mutation on YscD elasticity.
( A ) Collection of snapshots taken from 50 ns long molecularndynamics simulation of wild type (left) and G238P mutant (right) YscDnsystems. Color is used to indicate the position of the selected snap...
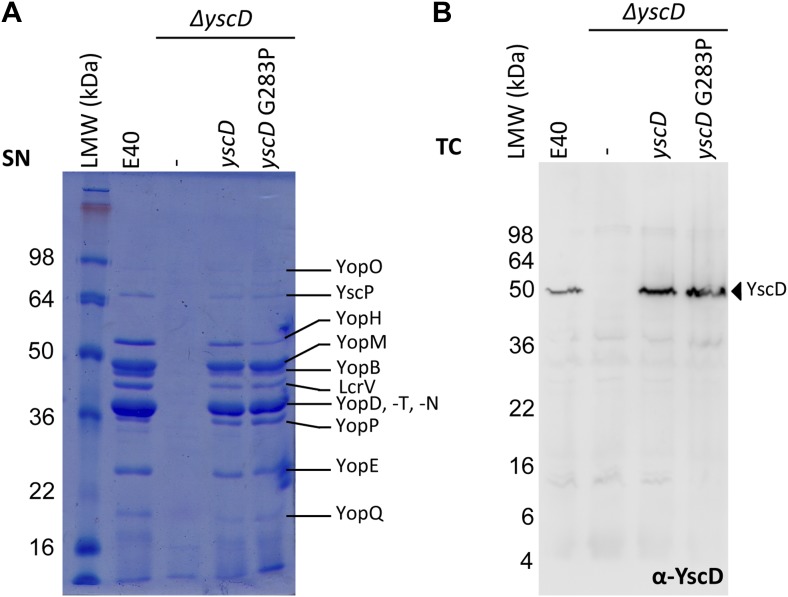
Figure 3u2014figure supplement 3.
Mutation G283P in YscD has no impact on type III secretion compared to E40 (WT) and in trans complemented YscD.
( A ) SDS-PAGE analysis of Yop secretion pattern andn( B ) immunoblot analysis (u03b1-YscD) of total cells innsecretion-permissive conditions. Culture supernatant (SN) and total cellsn(TC) were separa...
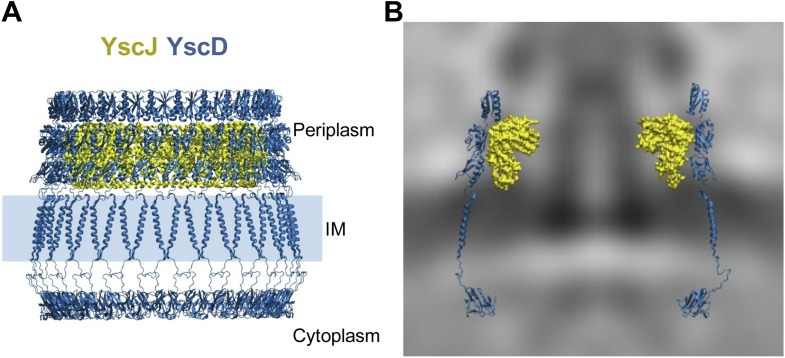
Figure 4.
Structural assembly of YscDJ ring at the basal body.
( A ) Side view of the generated 24-mer ring model of YscD (blue)nand YscJ (yellow). Each YscD subunit has been extended by the transmembranenhelix segment and the N-term cytosolic domain. The positio...
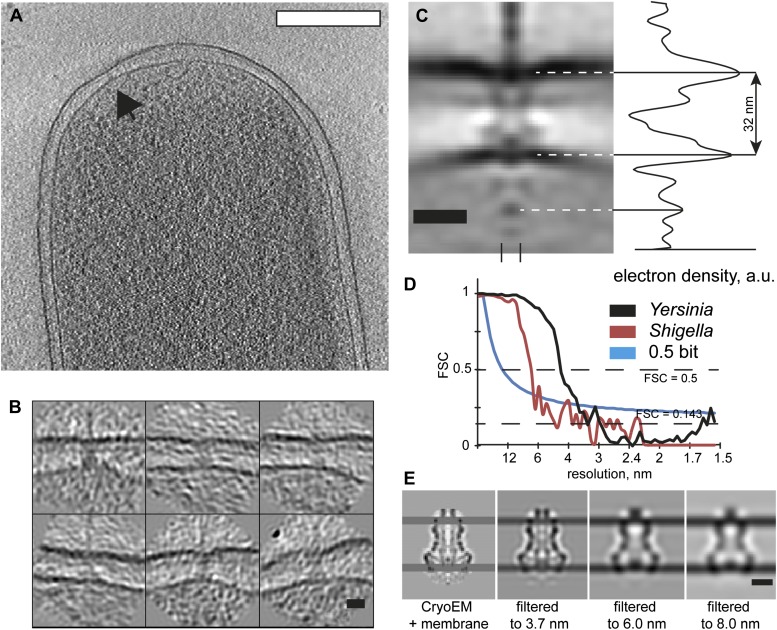
Figure 5.
Visualization and structure of the Shigella flexneri injectisomes in situ.
( A ) 30-nm thick section through a tomogram of an S.nflexneri cell. Arrow points to the basal body of an injectisome.nScale bar: 300 nm. ( B ) Typical views of S.nflexneri injectisomes oriented verti...
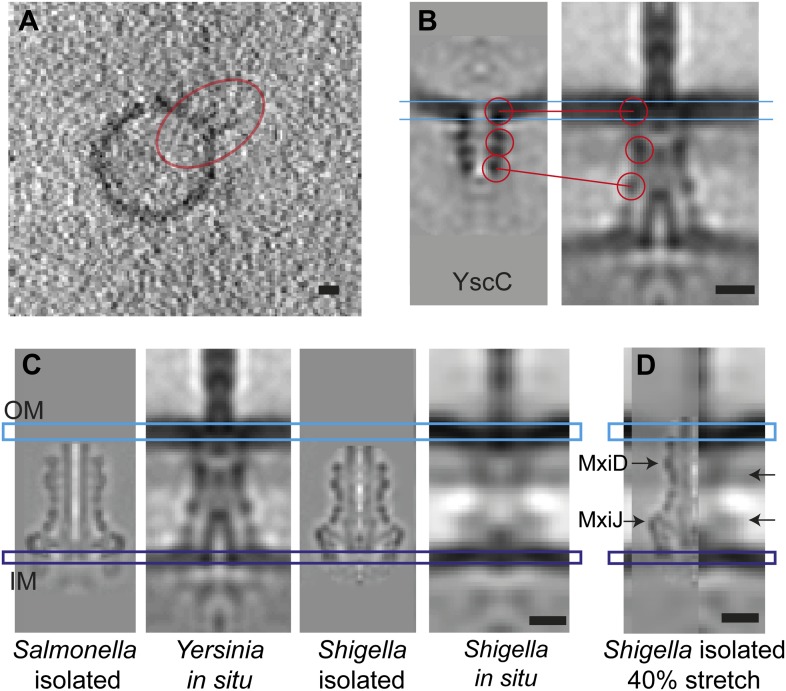
Figure 6.
Elongation of the in situ structure over the isolated versions.
( A ) 8-nm thick section through a single tomogram of an YscCnmultimer reconstituted into a lipid vesicle. ( B ) Averagenstructure of liposome-reconstituted YscC (left), and matching densities innthe ...
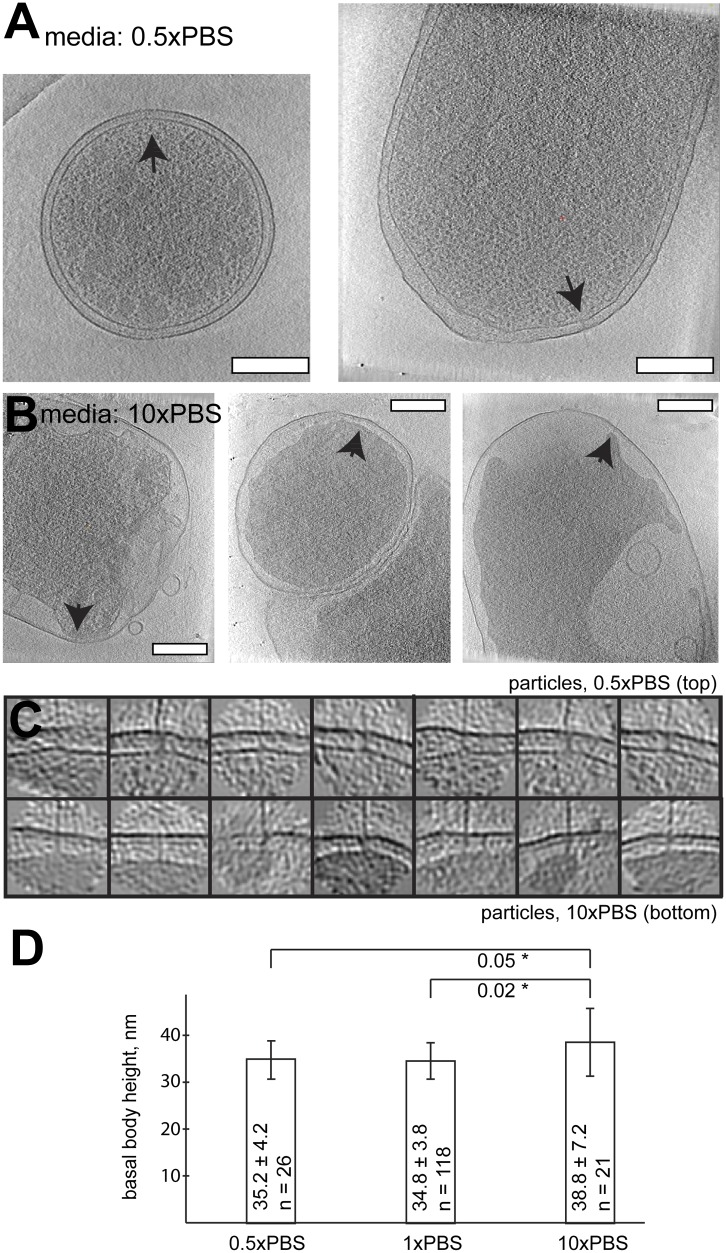
Figure 7.
Length of basal bodies of injectisomes from Y. enterocolitica exposed to media with different osmolarities.
( A , B ) Slices though tomograms of bacteria placedninto 0.5u00d7 PBS diluted with H 2 0 1:1 ( A ) and intonconcentrated 10u00d7 PBS ( B ). Black arrowheads point toninjectisomes. Scale bar in the mi...
Figure images are served from the NIH/NLM PubMed Central Open Access Subset or Europe PMC; copyright remains with the publishers and authors.
💬 Discussion
0 commentsNo comments yet. Be the first to start a discussion!
Leave a Comment