Abstract
Vibrio cholerae, the agent of cholera, is a motile non-invasive pathogen that colonizes the small intestine (SI). Most of our knowledge of the processes required for V. cholerae intestinal colonization is derived from enumeration of wt and mutant V. cholerae recovered from orogastrically infected infant mice. There is limited knowledge of the distribution of V. cholerae within the SI, particularly its localization along the villous axis, or of the bacterial and host factors that account for this distribution. Here, using confocal and intravital two-photon microscopy to monitor the localization of fluorescently tagged V. cholerae strains, we uncovered unexpected and previously unrecognized features of V. cholerae intestinal colonization. Direct visualization of the pathogen within the intestine revealed that the majority of V. cholerae microcolonies attached to the intestinal epithelium arise from single cells, and that there are notable regiospecific aspects to V. cholerae localization and factors required for colonization. In the proximal SI, V. cholerae reside exclusively within the developing intestinal crypts, but they are not restricted to the crypts in the more distal SI. Unexpectedly, V. cholerae motility proved to be a regiospecific colonization factor that is critical for colonization of the proximal, but not the distal, SI. Furthermore, neither motility nor chemotaxis were required for proper V. cholerae distribution along the villous axis or in crypts, suggesting that yet undefined processes enable the pathogen to find its niches outside the intestinal lumen. Finally, our observations suggest that host mucins are a key factor limiting V. cholerae intestinal colonization, particularly in the proximal SI where there appears to be a more abundant mucus layer. Collectively, our findings demonstrate the potent capacity of direct pathogen visualization during infection to deepen our understanding of host pathogen interactions.
🔬 Techniques
💻 Software
✨ Fluorophores
🧪 Sample Preparation
🏭 Microscope Brands
🧪 Reagent Suppliers
🔴 Lasers
💻 Software Details
🏛️ Research Organizations (ROR)
Affiliated research institutions:
📋 Methods
Bacterial strains All V. cholerae strains used in this study are streptomycin-resistant derivatives of C6706, a 1991 El Tor O1 Peruvian clinical isolate. The ΔflaA , ΔmotB , ΔtcpA , and ΔctxAB strains have been described previously [24] , [32] . The chemotaxis operon deletion strains Δche2 (strain SR28, Δvc2059-vc2065 ), Δche13 (strain SR31, Δvc1394-1406 (che1), Δvca1088-vca1096 (che2)) and Δche123 (strain SR33, Δvc1394-1406 (che1), Δvc2059-vc2065 (che2), Δvca1088-vca109 6 (che3)) were created by allelic exchange as described in [43] , [44] . GFP-labeled strains, which constitutively express GFPmut3 under the control of the lac promoter, were generated by introducing the suicide vector pJZ111 (a kind gift of Dr. Jun Zhu) into the lacZ locus as described [24] . A derivative of pJZ111 (pYM50) was generated by inserting a V. cholerae codon-optimized version of the tdTomato gene (Genscript) in place of the GFPmut3 gene. This plasmid was used to generate the strain VcRed, which constitutively expresses tdTomato. Infection assays 5-day old CD-1 mice were intragastrically inoculated as described [22] . For in vivo competition assays, 1∶1 mixtures of a GFP-labeled strain and VcRed were inoculated into each mouse (∼2×10 5 cells/mouse). After 24 h, unless otherwise noted, animals were euthanized and their small intestines removed and divided into three parts of equal length (proximal, medial and distal, ∼3.5 cm each); the central 1 cm segment of each part was removed, homogenized in LB and plated. For in vitro competition assays, 5 mL of LB containing streptomycin (200 µg/mL) were inoculated with 10 µL of the in vivo inoculum and grown at 30°C for 24 h. Serial dilutions were then plated. The number of CFUs of the GFP-labeled strain were determined by scanning the plates using a fluorescent image analyzer (Fujifilm FLA-5100). The ratio between GFP-labeled and VcRed CFUs was calculated and normalized by the ratio in the inoculum to determine the competitive index (CI). For single infection assays, ∼2.10 5 cells were inoculated into each mouse and after 24 h, the SI segments were prepared and processed as described above.
Show full methods section
Bacterial strains All V. cholerae strains used in this study are streptomycin-resistant derivatives of C6706, a 1991 El Tor O1 Peruvian clinical isolate. The ΔflaA , ΔmotB , ΔtcpA , and ΔctxAB strains have been described previously [24] , [32] . The chemotaxis operon deletion strains Δche2 (strain SR28, Δvc2059-vc2065 ), Δche13 (strain SR31, Δvc1394-1406 (che1), Δvca1088-vca1096 (che2)) and Δche123 (strain SR33, Δvc1394-1406 (che1), Δvc2059-vc2065 (che2), Δvca1088-vca109 6 (che3)) were created by allelic exchange as described in [43] , [44] . GFP-labeled strains, which constitutively express GFPmut3 under the control of the lac promoter, were generated by introducing the suicide vector pJZ111 (a kind gift of Dr. Jun Zhu) into the lacZ locus as described [24] . A derivative of pJZ111 (pYM50) was generated by inserting a V. cholerae codon-optimized version of the tdTomato gene (Genscript) in place of the GFPmut3 gene. This plasmid was used to generate the strain VcRed, which constitutively expresses tdTomato. Infection assays 5-day old CD-1 mice were intragastrically inoculated as described [22] . For in vivo competition assays, 1∶1 mixtures of a GFP-labeled strain and VcRed were inoculated into each mouse (∼2×10 5 cells/mouse). After 24 h, unless otherwise noted, animals were euthanized and their small intestines removed and divided into three parts of equal length (proximal, medial and distal, ∼3.5 cm each); the central 1 cm segment of each part was removed, homogenized in LB and plated. For in vitro competition assays, 5 mL of LB containing streptomycin (200 µg/mL) were inoculated with 10 µL of the in vivo inoculum and grown at 30°C for 24 h. Serial dilutions were then plated. The number of CFUs of the GFP-labeled strain were determined by scanning the plates using a fluorescent image analyzer (Fujifilm FLA-5100). The ratio between GFP-labeled and VcRed CFUs was calculated and normalized by the ratio in the inoculum to determine the competitive index (CI). For single infection assays, ∼2.10 5 cells were inoculated into each mouse and after 24 h, the SI segments were prepared and processed as described above.
Statistical analyses
Statistical analyses were performing with Prism (GraphPad).
Ethics statement
This study was performed in strict accordance with the recommendations in the Guide for the Care and Use of Laboratory Animals of the National Institutes of Health. All animal protocols were reviewed and approved by the Harvard Medical Area Standing Committee on Animals (protocol #04316).
Analysis of V. cholerae intestinal localization using confocal microscopy
Tissue from a subset of mice used in infection studies was analyzed via confocal microscopy (n = 3 per assay). Mice were inoculated with VcRed and/or a GFP-labeled strain as described above. Tissue samples from the proximal, medial, and distal intestine were fixed in PBS with 2% paraformaldehyde for two hours at room temperature (RT), placed in PBS with 30% sucrose for two hours at RT, mounted in tissue freezing medium (EMS), snap-frozen in dry ice-cold 2-metylbutane and sectioned (10 µm). Initially, bacteria labeled with GFP were visualized via direct detection of the fluorescent protein; however, however, we found that these signals were less stable than those obtained via immunodetection of GFP, and so most images presented here were generated via immunostaining. No difference was detected between bacterial localization observed with the two approaches. For staining, frozen sections were washed in PBS for 5–15 minutes at RT, blocked in blocking buffer (1% BSA, 5% normal donkey serum in PBS) for 1 hour at RT, stained with a primary anti-GFP antibody (Abcam, ab13970) 1/1000 in blocking buffer with 0.2% tween20 for 1 hour at RT, washed three times in PBS, stained with a FITC-coupled secondary antibody (Abcam, ab6873) 1/1000 in blocking buffer with 0.2% tween20 for 1 hour at RT, washed three times in PBS, counterstained with DAPI (1 µg/mL) and in some cases with phalloidin-alexa fluor 647 or wheat germ agglutinin (WGA)-alexa fluor 633 1/1000 (Life Technologies) for 20 min at RT and washed twice in PBS. Slides were mounted in fluorsave (calbiochem) and observed under an Olympus FluoView confocal microscope using a 20× objective or a Nikon Perfect Focus spinning disc confocal microscope. Multiple images were collected per section. Distances separating microcolonies from the base of the villi were measured using the imaging software Imaris.
Intravital two-photon microscopy
Mice were anesthetized with ketamine, xylazine, and acepromazine and placed in a supine position on a temperature-controlled heating pad. An ∼1.2 cm vertical incision was made along the midline of the abdomen through the skin and peritoneal membrane to expose the peritoneal cavity. A 1 cm loop of small intestine (proximal, medial, or distal segment) was carefully exteriorized through the peritoneum using cotton-tipped applicators to avoid tissue damage, and lightly immobilized with tissue-adhesive glue onto a heated stage. For intravital imaging, the intestinal loop was not opened along the antimesenteric border but rather left intact for the duration of the imaging procedure. Importantly, this approach best-preserved the physiology of the small intestine, including maintaining intact blood and lymphatic flow. The intestinal loop was kept hydrated by overlaying a mixture of saline/lubricant gel, and covered by a glass coverslip. Mice were given Hoechst 33342 (Sigma; 10 mg/kg i.v.) for nuclear staining in vivo, or Qtracker-655 non-targeted quantum dots (Invitrogen; 0.2 uM i.v.) to label the vasculature in vivo. In some experiments, segments of the small intestine were occluded at either end with sutures, and then surgically removed and imaged as an explant in a heated imaging chamber containing a mixture of saline/lubricant gel and covered by a glass coverslip. Time-lapse or static imaging was performed using an Ultima Two-Photon Microscope (Prairie Technologies). Two-photon excitation and second-harmonic signals were generated using a Tsunami Ti:sapphire laser with a 10-W MilleniaXs pump laser (Spectra-Physics), and outfitted with a 20× (0.95NA Olympus) water immersion objective. Two-photon excitation wavelength was tuned to 880–950 nm for optimal fluorescence excitation of fluorescent V. cholerae . Emitted light and second-harmonic signals were detected through 450/50-nm, 525/50-nm, 590/50-nm, and 665/65-nm bandpass filters for four-color imaging. Image sequences were transformed into volume-rendered z-stacks with Volocity software (Improvision) or Imaris (Bitplane). NAC treatment A 100 mg/mL N-acetyl-L-cysteine (NAC) solution was prepared fresh in PBS and its pH adjusted to 7.3 with NaOH. 2 mg/g of the NAC solution or an equivalent volume of PBS (mock) was administered by gavage to 5-day old CD-1 mice. Periodic Acid Schiff staining of intestinal mucus Tissue samples were fixed in freshly made Carnoy's fixative (60% ethanol, 30% chloroform 10% acetic acid) for one hour at room temperature, washed in 70% ethanol and stored in 70% ethanol until further processing. Samples were embedded in paraffin, sectioned and stained with periodic acid-Schiff (PAS) at the Dana Farber/Harvard Cancer Center Rodent Histology Core.
Supporting Information Figure S1 VcGreen and VcRed exhibit WT growth in vivo and in vitro. Competition assays between VcGreen (G) or VcRed (R) vs the parental strain C6706 in the SI of infant mice (in vivo) and in vitro in LB. Bars represent the geometric mean. (PDF) Click here for additional data file. Figure S2 Spatial and temporal differences in CFU recovered from the small intestine. The small intestines of infant mice co-inoculated with VcRed and VcGreen were divided into three equal parts and the central 1 cm segments of the proximal (P), medial (M) and distal (D) parts were used for plating and microscopic analyses. (A) Numbers of CFUs recovered from homogenates of each segment at 8, 16, or 24 hr PI. Mean values and SEM are plotted. (B) Confocal micrographs showing VcRed and VcGreen distribution in the proximal and medial segments at these time points. Tissue sections were counterstained with DAPI (blue) and phalloidin (gray). Scale bars = 50 µm. (PDF) Click here for additional data file. Figure S3 Confocal micrographs of intraintestinal VcRed and VcGreen. Tissue from the medial small intestines of animals coinfected with VcRed and VcGreen for 24 hr was stained with DAPI (blue) and phalloidin (gray) Individual channels showing DAPI (B, G), VcGreen (C, H), VcRed (D, I), and phalloidin (E, J) are shown, as well as merged images (A, F). Scale bars, 50 µm. (PDF) Click here for additional data file. Figure S4 High magnification confocal micrographs of intraintestinal VcRed and VcGreen, showing individual cells. Tissue from the small intestine of animals coinfected with VcRed and VcGreen for 24 hr was stained with DAPI (blue) and phalloidin (gray). Individual channels showing DAPI (B, G), VcGreen (C, H), VcRed (D, I), and phalloidin (E, J) are shown, as well as merged images (A, F). Scale bars, 10 µm (A–E) and 25 µm (F–J). (PDF) Click here for additional data file. Figure S5 Distribution of ΔflaA and ΔmotB microcolonies along the axes of intestinal villi in the proximal and distal SI segments. The distance separating microcolonies from the base of the villi was measured by confocal microscopy in tissue cross sections from three mice co-inoculated with GFP-labeled ΔflaA or ΔmotB and VcRed. Data represent the mean ±SD. The number (n) of microcolonies analyzed is indicated in the bottom right of each panel. (PDF) Click here for additional data file. Figure S6 The frequency of reversals in swimming direction of the Δche2 mutant is reduced compared with the wild type.
Images of swimming wild type and Δche2 mutant cells
(A) and reversal frequency/sec (B). Images of swimming cells were recorded and analyzed as previously described [41] . (PDF) Click here for additional data file. Figure S7 The influence of NAC treatment is no longer detectable 24 h after treatment. Confocal micrographs of longitudinal sections of the proximal, medial and distal SI from infant mice treated with PBS or NAC after 24 h. (PDF) Click here for additional data file. Video S1 Visualization of V. cholerae in the distal SI by two-photon microscopy. Video depicts VcGreen in an intact explant 24 h post orogastric inoculation. Green depicts VcGreen, white/yellow depicts intestinal villi autofluoresence. Images were acquired every 2 seconds. Video playback is at 15 frames per second. Scale bar, 10 um. Time displayed as hh:mm:ss. (MOV) Click here for additional data file. Video S2 Visualization of V. cholerae in the distal SI by two-photon microscopy. Video depicts VcGreen in an intact explant 24 h post orogastric inoculation. Green depicts VcGreen, white/yellow depicts intestinal villi autofluoresence. Images were acquired every ∼1.5 seconds. Video playback is at 15 frames per second. Scale bar, 10 um. Time displayed as hh:mm:ss. (MOV) Click here for additional data file.
📊 Figures
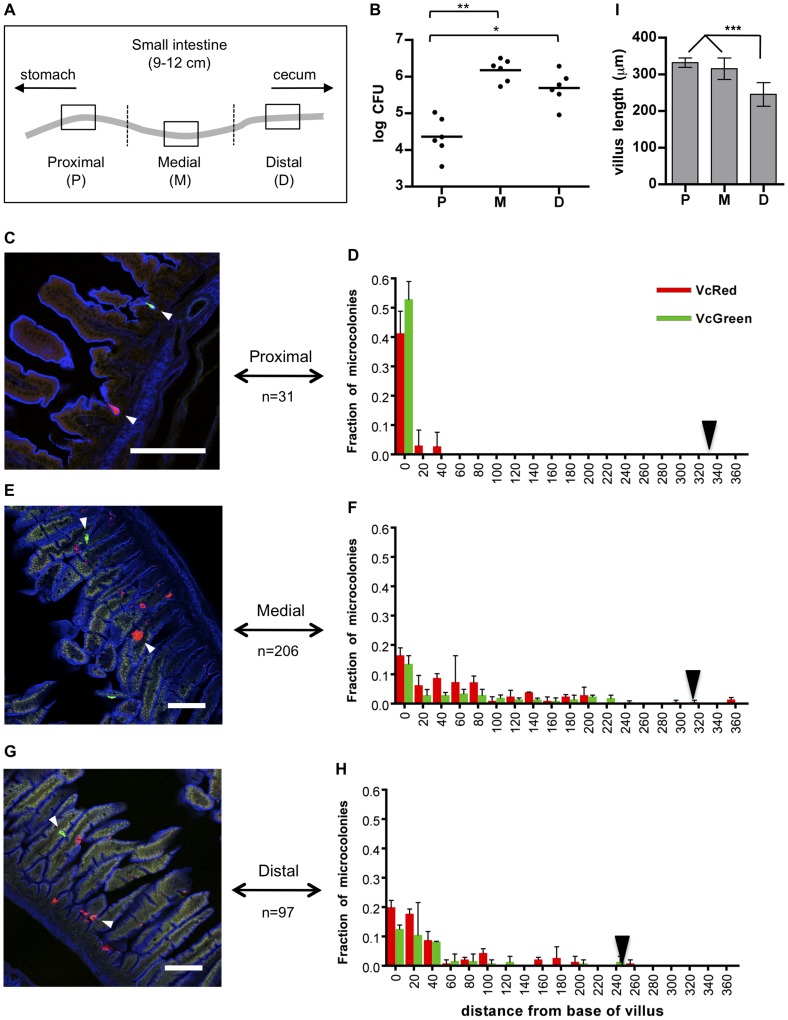
Figure 1
Distribution of fluorescently labeled V. cholerae in the infant mouse small intestine.
(A) The small intestines of infant mice co-inoculated with VcRed and VcGreen were divided into three equal parts and the central 1 cm segments of the proximal (P), medial (M) and distal (D) parts were...
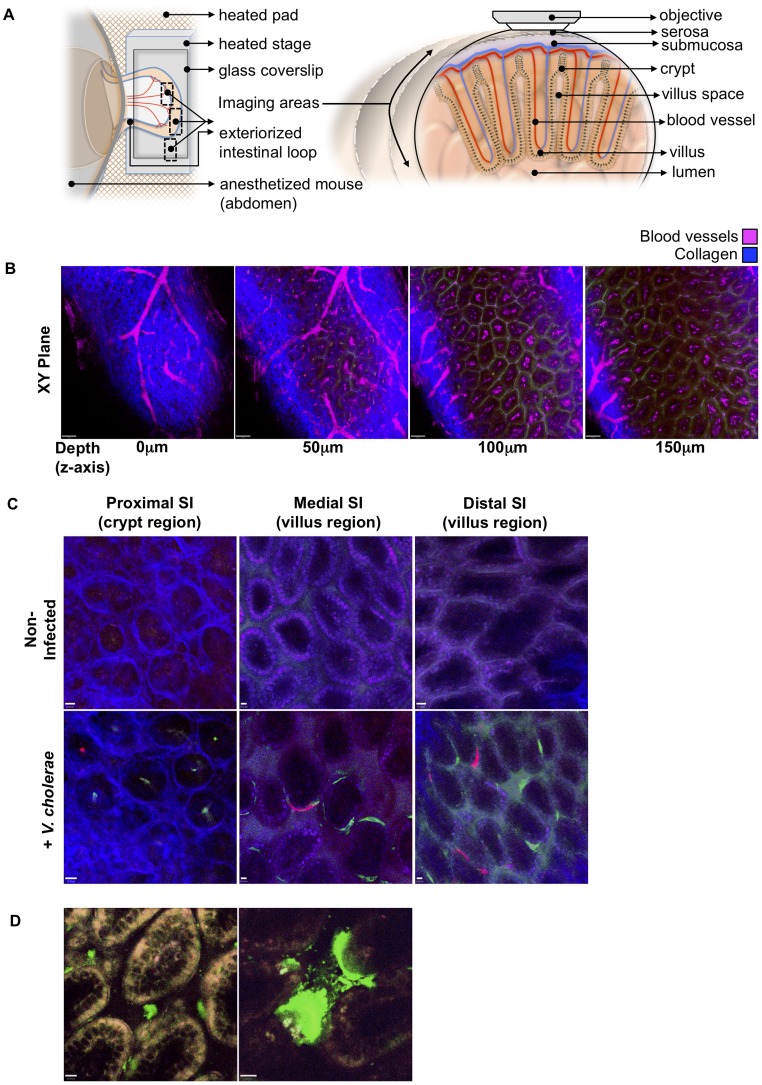
Figure 2
Detection of fluorescently labeled V. cholerae in the intact infant mouse small intestine by intravital two-photon microscopy.
(a) Schematic representation (left) of the surgical intravital imaging approach to visualize intestinal tissue by two-photo microscopy in live anesthetized mice following orogastric inoculation with V...
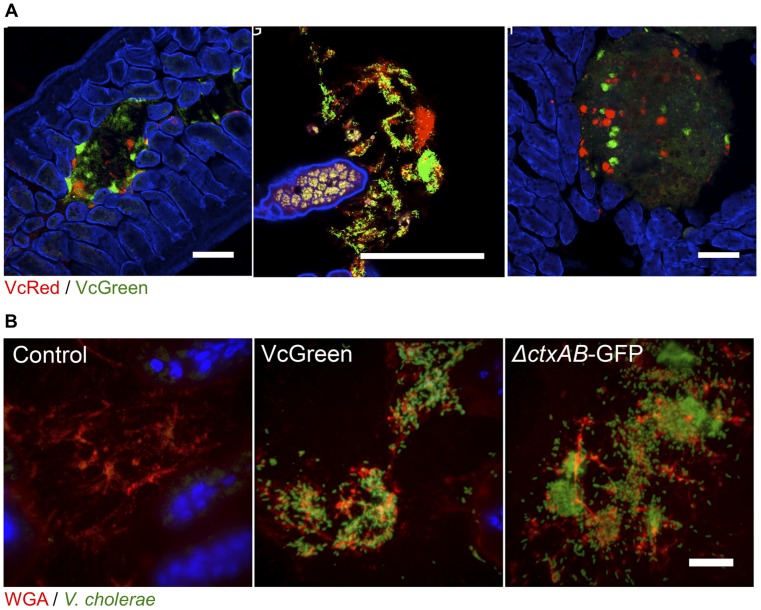
Figure 3
V. cholerae aggregates are present in the lumen of the lower SI, often associated with mucus.
(A) Each panel shows lumenal aggregates of V. cholerae (VcRed and VcGreen) from the medial or distal SI. Colonies in the right panel reside on the surface of digesta. Scale baru200a=u200a100 u00b5m. (...
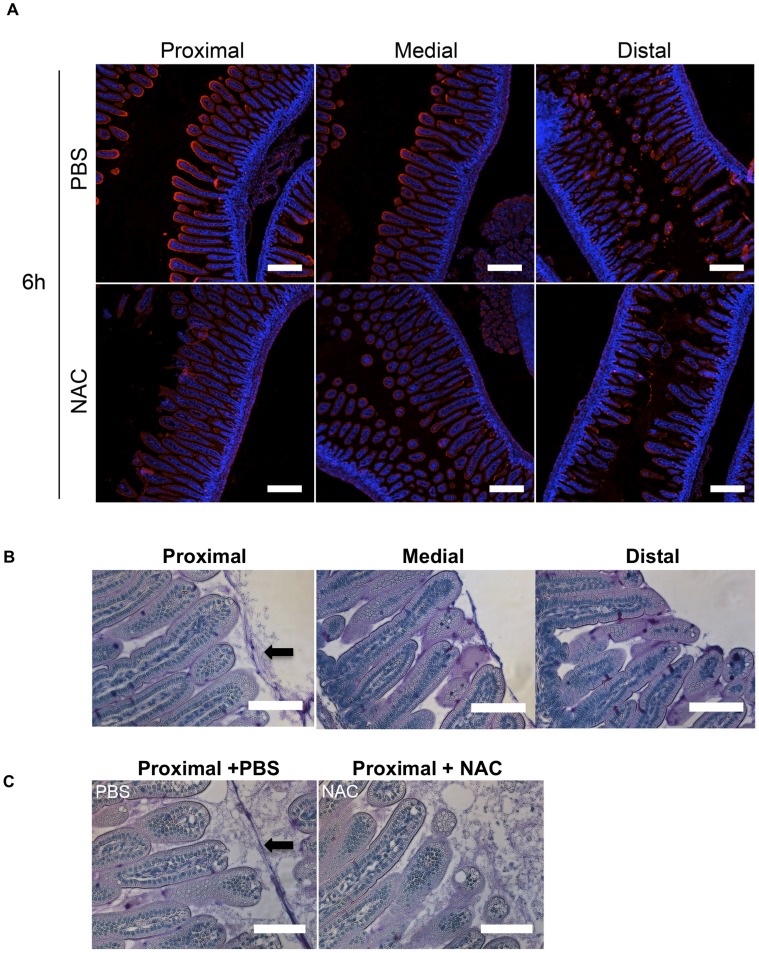
Figure 4
The intensity of WGA staining of the intestinal epithelium decreases along the length of the SI and can be reduced by N-acetyl-L-cysteine (NAC) treatment.
(A) Confocal micrographs of longitudinal sections of the proximal, medial and distal SI from infant mice treated with PBS or NAC after 6 h. The sections were stained with WGA (red) and DAPI (blue). Sc...
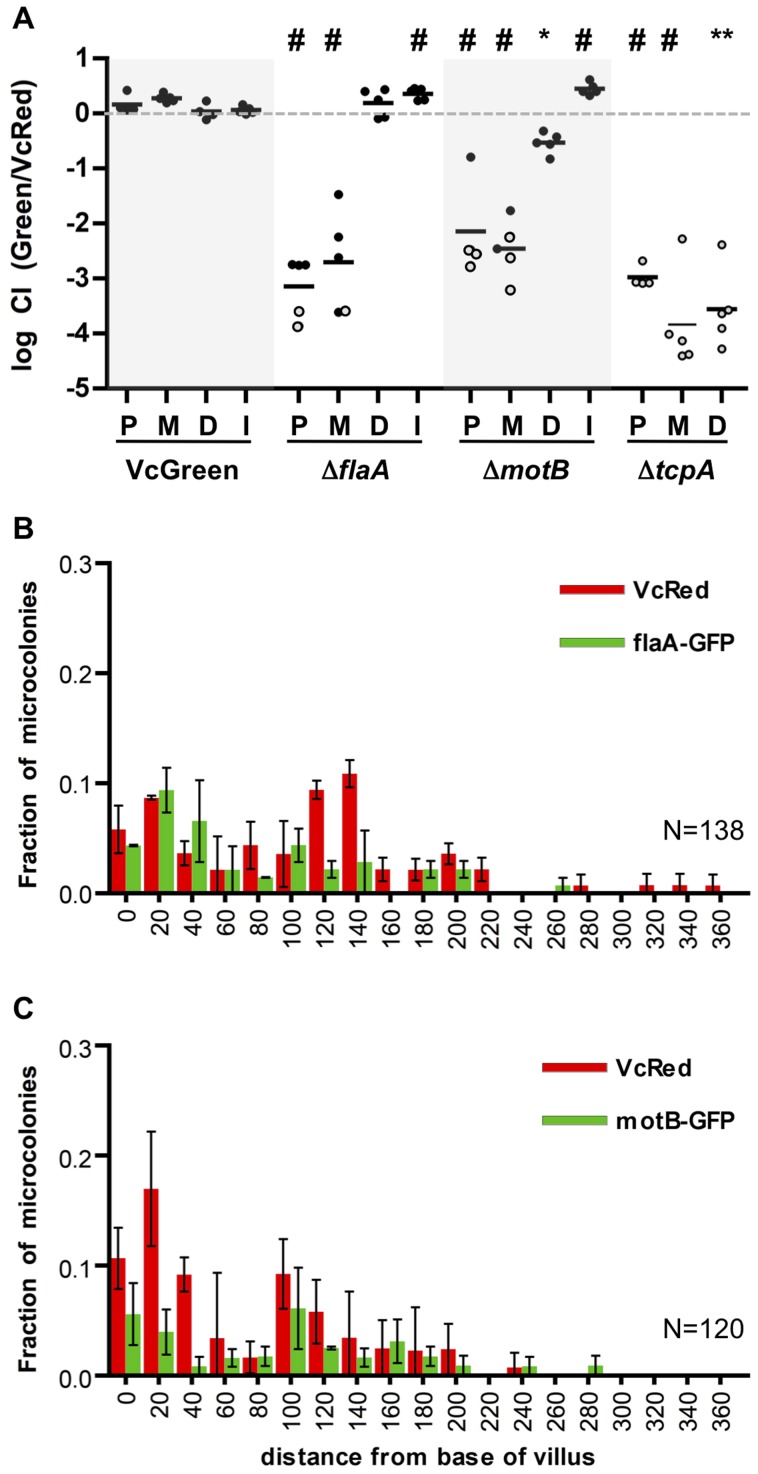
Figure 5
Differential requirements for flagellar-based motility along the SI.
(A) Competitive indices (CI) from competition assays using GFP-labeled C6706, u0394flaA , u0394motB or u0394tcpA and VcRed in the proximal (P), medial (M) and distal (D) SI segments and in vitro (I). ...
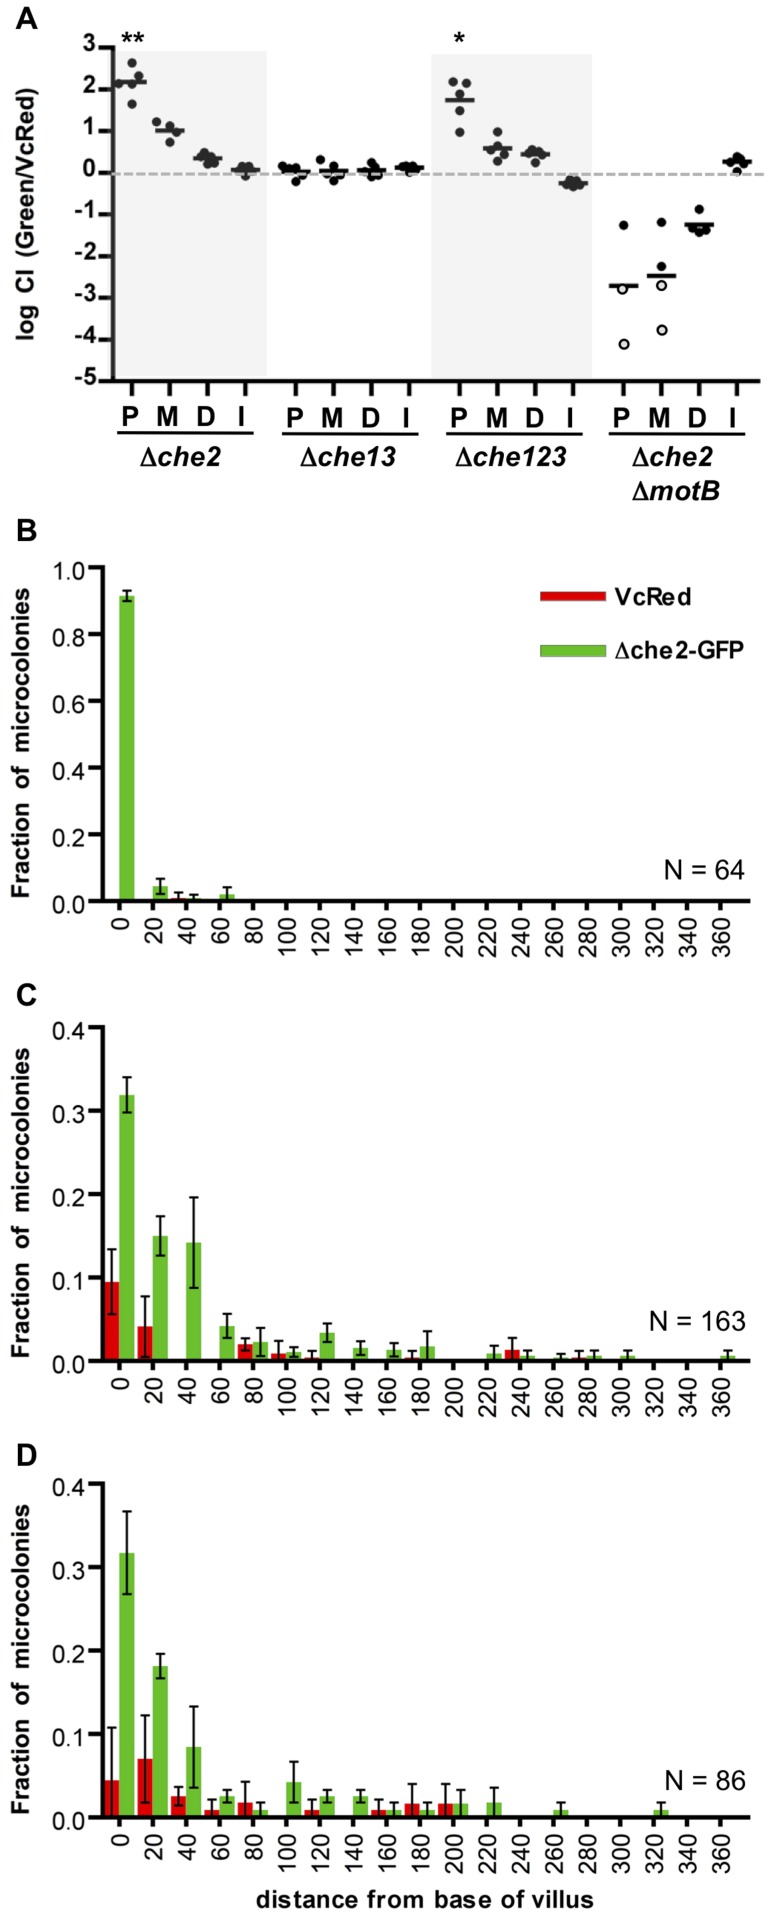
Figure 6
Chemotaxis is not required from the fine localization of V. cholerae microcolonies along the villous axis.
(A) Competition assays between GFP-labeled chemotaxis cluster deletion mutants u0394che2 (cluster 2), u0394che13 (clusters 1 and 3) or u0394che123 (all 3 clusters) and VcRed in the proximal (P), media...
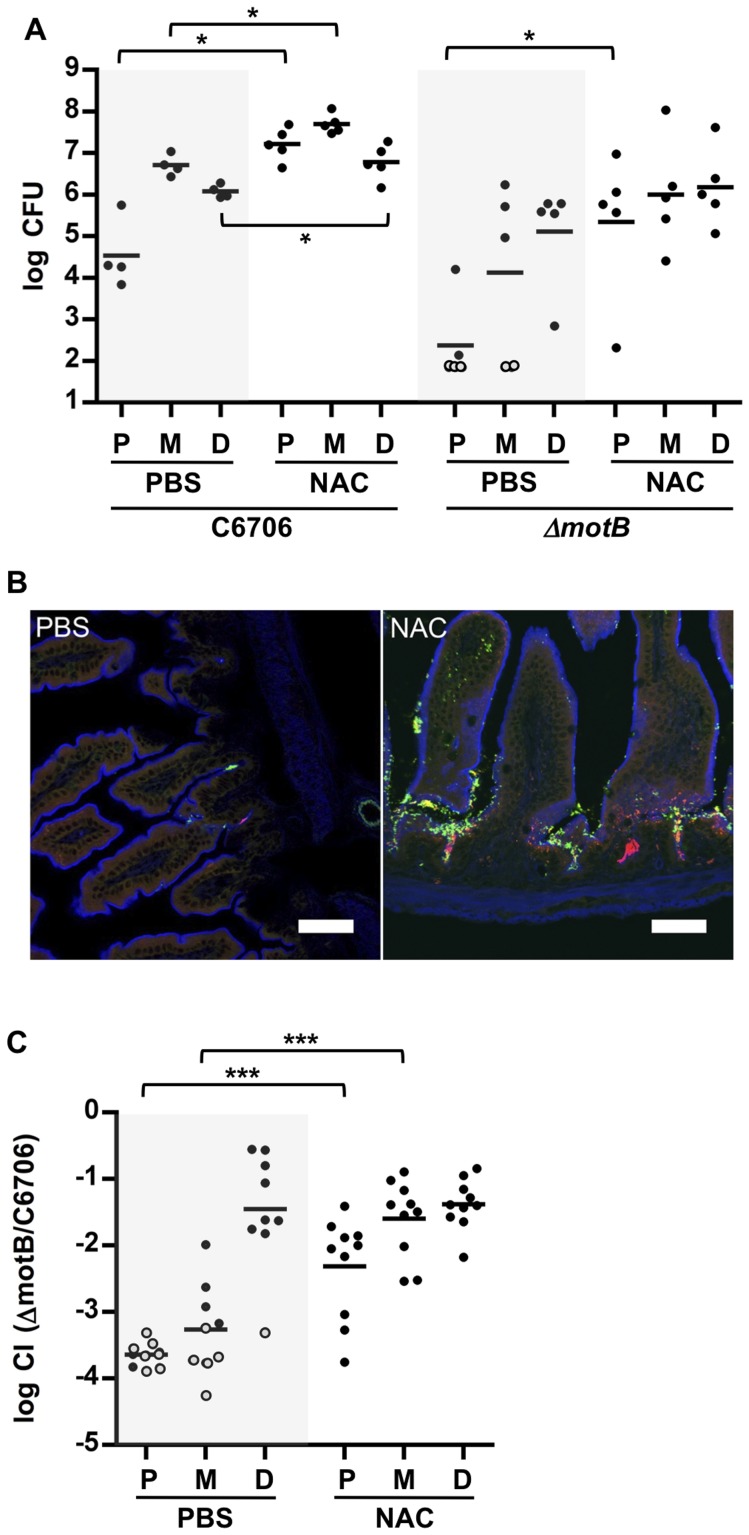
Figure 7
NAC pretreatment promotes V. cholerae intestinal colonization and reduces the requirement for motility.
(A) Numbers of CFUs recovered from homogenates of the proximal (P), medial (M) and distal (D) segments of infant mice treated with PBS (black) or NAC (red) 30 minutes prior to inoculation with C6706 o...
Figure images are served from the NIH/NLM PubMed Central Open Access Subset or Europe PMC; copyright remains with the publishers and authors.
💬 Discussion
0 commentsNo comments yet. Be the first to start a discussion!
Leave a Comment