Abstract
Late endosome-resident interferon-induced transmembrane protein 3 (IFITM3) inhibits fusion of diverse viruses, including Influenza A virus (IAV), by a poorly understood mechanism. Despite the broad antiviral activity of IFITM3, viruses like Lassa virus (LASV), are fully resistant to its inhibitory effects. It is currently unclear whether resistance arises from a highly efficient fusion machinery that is capable of overcoming IFITM3 restriction or the ability to enter from cellular sites devoid of this factor. Here, we constructed and validated a functional IFITM3 tagged with EGFP or other fluorescent proteins. This breakthrough allowed live cell imaging of virus co-trafficking and fusion with endosomal compartments in cells expressing fluorescent IFITM3. Three-color single virus and endosome tracking revealed that sensitive (IAV), but not resistant (LASV), viruses become trapped within IFITM3-positive endosomes where they underwent hemifusion but failed to release their content into the cytoplasm. IAV fusion with IFITM3-containing compartments could be rescued by amphotericin B treatment, which has been previously shown to antagonize the antiviral activity of this protein. By comparison, virtually all LASV particles trafficked and fused with endosomes lacking detectable levels of fluorescent IFITM3, implying that this virus escapes restriction by utilizing endocytic pathways that are distinct from the IAV entry pathways. The importance of virus uptake and transport pathways is further reinforced by the observation that LASV glycoprotein-mediated cell-cell fusion is inhibited by IFITM3 and other members of the IFITM family expressed in target cells. Together, our results strongly support a model according to which IFITM3 accumulation at the sites of virus fusion is a prerequisite for its antiviral activity and that this protein traps viral fusion at a hemifusion stage by preventing the formation of fusion pores. We conclude that the ability to utilize alternative endocytic pathways for entry confers IFITM3-resistance to otherwise sensitive viruses.
🔬 Techniques
💻 Software
✨ Fluorophores
🧪 Sample Preparation
🔬 Cell Lines
🏭 Microscope Brands
🧪 Reagent Suppliers
🔎 Objectives
💻 Software Details
💾 Data Repositories
🏛️ Research Organizations (ROR)
Affiliated research institutions:
📋 Methods
Cell lines, plasmids and reagents We obtained HEK 293T/17, Cos7 and human lung epithelial A549 cells from ATCC (Manassas, VA). TZM-bl cells were obtained from NIH AIDS Research and Reference Reagent Program. 293T cells stably expressing IFITM1, IFITM2 or IFITM3 were a gift from Dr. Shan-Lu Liu, Ohio State University [ 22 ]). Cells were maintained in Dulbecco’s Modified Eagle Medium (DMEM, Cellgro, Mediatech, Masassas, VA) containing 10% heat-inactivated Fetal Bovine Serum (Hyclone Laboratories, Logan, UT or Atlanta Biologicals, Flowery Branch, GA) and 1% penicillin/streptomycin from Gemini Bio-products (West Sacramento, CA). For HEK 293T/17 cells the growth medium was supplemented with 0.5 mg/ml G418 (Genesee Scientific, San Diego, CA). DMEM without phenol red was purchased from Life Technologies (Grand Island, NY).
Live Cell Imaging Buffer
(LCIB) and Fluorobrite TM DMEM were purchased from Life Technologies (Grand Island, NY). Stable cell lines expressing fluorescently-tagged IFITM3 used for imaging analysis were obtained by transducing with VSV-G pseudotyped viruses encoding wild-type or the 2M mutant (F75/78A) IFITM3 [ 21 ] or with the Vector pQCXIN (Clontech) and selecting with 1 mg/ml G418. Following selection, cells were maintained in 0.5 mg/ml G418. Stable cell lines expressing unlabeled and fluorescently-tagged IFITM3 used for bulk fusion assays were obtained by transducing with VSV-G pseudotyped viruses encoding wild-type IFITM3 with the Vector pQXCIP (Clontech) and selecting with 1.5 μg/ml puromycin. The pR8ΔEnv, pR9ΔEnv, BlaM-Vpr, pcRev, pMDG-VSV-G, MLV-Gag-Pol, HIV-1 Gag-mCherry (encoding an uncleavable mCherry fluorescent tag used in fixed cell co-localization experiments), IFITM3/pQCXIP, F75/78A IFITM3/pQCXIN expression vectors were described previously [ 15 , 21 , 43 , 75 ]. The mCherry-2xCL-YFP-Vpr (mCherry fused to YFP-Vpr through a cleavable linker containing two HIV protease cleavage sites– 2xCL), as described previously [ 50 ], was used for single particle tracking of fusion events in live cells. The pCAGGS vectors encoding influenza H1N1 WSN HA and NA were provided by Drs. Donna Tscherne and Peter Palese (Icahn School of Medicine, Mount Sinai) [ 76 ]. The LASV GPc plasmid was a gift from Dr. F.-L. Cossett (Université de Lyon, France) [ 77 ]. To internally label human IFITM3 (accession NM_021034 ) with EGFP, sites likely permissive to insertions were identified based on sequence alignments of human and mouse IFITM family proteins. An EGFP cassette flanked by two linkers was created by PCR (forward primer TCAAGGAGGAGCACGAGGTGGCTGTGCTGGGGGCGCCCCACAACCCTGCTCCCGGCGGAGGAAGCGGCGGAGTGAGCAAGGGCGAGGAGC; reverse primer GACGACATGGTCGGGCACGGAGGTCTCGCTGCGGATGTGGATCACGGTGGATCCGCCTCCGCTTCCGCCCTTGTACAGCTCGTCCATGCC) and inserted using Gibson assembly into KasI/BsaBI-cut IFITM3 cDNA. The resulting protein has amino acids 41 (P) and 42 (T) of wild-type IFITM3 removed. The cloning of IFITM3-imNeonGreen (IFITM3-imNG), and IFITM3-imTFP1 (IFITM3-imTFP1) into pQCXIN (Clontech) and pQXCIP (Clontech) retroviral expression vectors were done in two steps. In the first step, the EGFP in IFITM3-iEGFP/pLVX Tet on construct was replaced either with mNeonGreen or mTFP1 by overlapping PCR. The IFITM3-iEGFP/pLVX Tet on construct contain an EcoRI restriction site in the 5’ of the IFITM3-iEGFP cDNA and a BsrgGI in the 3’ of GFP cDNA that facilitated the replacement of GFP. The 5’ of IFITM3 cDNA was amplified by PCR using forward primer P1 (containing EcoRI restriction site) TACCACTTCCTACCCTCGTAAAGAATTCGCCACCATGAATCACACTGTCCAAACCTTC, and reverse primer P2: TGTGGTCTCCTCGCCCTTGCTCACTCCGCCGCTTCCTCCGCCGGGAGC. The mTFP1 fragment was amplified using forward primer P3: GCTCCCGGCGGAGGAAGCGGCGGAGTGAGCAAGGGCGAGGAGACCACA (complementary to P2), and the reverse primer P3 (containing BsrgGI restriction site) GATCCGCCTCCGCTTCCGCCCTTGTACAGCTCGTCCATGCCGTCGGTGGAATT. The fragments were purified, mixed and the overlapping PCR was perfomed using the forward primer P1 and the reverse primer P3. The final PCR fragment and IFITM3-iEGFP/pLVX Tet on were digested with EcoRI and BsrgGI restriction enzymes, purified and ligated. In the second step, the IFITM3-imTFP was amplified by PCR with forward primer P4 (containing AgeI restriction site) GCAGGAATTGATCCGCGGCCGCACCGGTAGGCCACCATGAATCACACTGTCCAAACCTTC, and reverse primer P5 (containing EcoRI restriction site) AGGGGTGGGGCGGGGGGGGGCGGAATTCTTAGTGATGGTGATGGTGATGGCCTTG, digested with AgeI and EcoRI restriction enzymes, purified and ligated into pQCXIN or pQXCIP vectors. For IFITM3-imNeonGreen construct the overlapping PCR was done using IFITM3-imTFP/pQCXIN construct as template and the AgeI and BamHI restriction sites. The 5’ of IFITM3 cDNA was amplified by PCR using forward primer P5 (containing AgeI restriction site) GCAGGAATTGATCCGCGGCCGCACCGGTAGGCCACCATGAATCACACTGTCCAAACCTT, and reverse primer P6: ATCCTCCTCGCCCTTGCTCACCATTCCGCCGCTTCCTCCGCCGGGAGC. The mNeonGreen cDNA was amplified with forward primer P7: GCTCCCGGCGGAGGAAGCGGCGGAATGGTGAGCAAGGGCGAGGAGGAT (complementary to P6), and reverse primer (containing BamHI restriction site) CGCTGCGGATGTGGATCACGGTGGATCCGCCTCCGCTTCCGCCCTTGTACAGCTCGTCCATGCCCA. Purified PCR fragments were mixed and the overlapping PCR was done using the forward primer containing AgeI restriction site and the reverse primer containing BamHI restriction site. The fragment and IFITM3-imTFP1 plasmid were digested with AgeI and BamHI , purified and ligated. The F75/F78A IFITM3-imTFP1 (2M-IFITM3-imTFP1) mutants was obtained by Quick-change site-directed mutagenesis (Stratagen, La Jolla, CA) using IFITM3-imTFP1/pQCXIN as template. Alexa Fluor 647-NHS ester (AF647) and the lipophilic dye SP-DiIC 18 (1,1'-Dioctadecyl-6,6'-Di(4-Sulfophenyl)-3,3,3',3'-Tetramethylindocarbocyanine) were purchased from Invitrogen/Life Technologies (Grand Island, NY). The LASV fusion inhibitor ST-193 was purchased from Aurum Pharmatech (Franklin Park, NJ). Amphotericin B (AmphoB) was obtained from Quality Biological (Gaithersburg, MD). Primary antibodies used were rabbit directed at the N-terminus of IFITM3 (Abgent, San Diego, CA), mouse anti-tubulin from Sigma (St. Louis, MO), HIV-1 IG serum (NIH AIDS Research and Reference Reagent Program), and rabbit anti-WSN Influenza R2376 (a generous gift from Dr. David Steinhauer, Emory University). Secondary antibodies used were rabbit anti-mouse IgG(H+L)-HRP (EMD Millipore), mouse anti-rabbit IgG(H+L)-HRP (EMD Millipore), and goat anti-human IgG-HRP (H+4) (Thermo Scientific).
Show full methods section
Cell lines, plasmids and reagents We obtained HEK 293T/17, Cos7 and human lung epithelial A549 cells from ATCC (Manassas, VA). TZM-bl cells were obtained from NIH AIDS Research and Reference Reagent Program. 293T cells stably expressing IFITM1, IFITM2 or IFITM3 were a gift from Dr. Shan-Lu Liu, Ohio State University [ 22 ]). Cells were maintained in Dulbecco’s Modified Eagle Medium (DMEM, Cellgro, Mediatech, Masassas, VA) containing 10% heat-inactivated Fetal Bovine Serum (Hyclone Laboratories, Logan, UT or Atlanta Biologicals, Flowery Branch, GA) and 1% penicillin/streptomycin from Gemini Bio-products (West Sacramento, CA). For HEK 293T/17 cells the growth medium was supplemented with 0.5 mg/ml G418 (Genesee Scientific, San Diego, CA). DMEM without phenol red was purchased from Life Technologies (Grand Island, NY).
Live Cell Imaging Buffer
(LCIB) and Fluorobrite TM DMEM were purchased from Life Technologies (Grand Island, NY). Stable cell lines expressing fluorescently-tagged IFITM3 used for imaging analysis were obtained by transducing with VSV-G pseudotyped viruses encoding wild-type or the 2M mutant (F75/78A) IFITM3 [ 21 ] or with the Vector pQCXIN (Clontech) and selecting with 1 mg/ml G418. Following selection, cells were maintained in 0.5 mg/ml G418. Stable cell lines expressing unlabeled and fluorescently-tagged IFITM3 used for bulk fusion assays were obtained by transducing with VSV-G pseudotyped viruses encoding wild-type IFITM3 with the Vector pQXCIP (Clontech) and selecting with 1.5 μg/ml puromycin. The pR8ΔEnv, pR9ΔEnv, BlaM-Vpr, pcRev, pMDG-VSV-G, MLV-Gag-Pol, HIV-1 Gag-mCherry (encoding an uncleavable mCherry fluorescent tag used in fixed cell co-localization experiments), IFITM3/pQCXIP, F75/78A IFITM3/pQCXIN expression vectors were described previously [ 15 , 21 , 43 , 75 ]. The mCherry-2xCL-YFP-Vpr (mCherry fused to YFP-Vpr through a cleavable linker containing two HIV protease cleavage sites– 2xCL), as described previously [ 50 ], was used for single particle tracking of fusion events in live cells. The pCAGGS vectors encoding influenza H1N1 WSN HA and NA were provided by Drs. Donna Tscherne and Peter Palese (Icahn School of Medicine, Mount Sinai) [ 76 ]. The LASV GPc plasmid was a gift from Dr. F.-L. Cossett (Université de Lyon, France) [ 77 ]. To internally label human IFITM3 (accession NM_021034 ) with EGFP, sites likely permissive to insertions were identified based on sequence alignments of human and mouse IFITM family proteins. An EGFP cassette flanked by two linkers was created by PCR (forward primer TCAAGGAGGAGCACGAGGTGGCTGTGCTGGGGGCGCCCCACAACCCTGCTCCCGGCGGAGGAAGCGGCGGAGTGAGCAAGGGCGAGGAGC; reverse primer GACGACATGGTCGGGCACGGAGGTCTCGCTGCGGATGTGGATCACGGTGGATCCGCCTCCGCTTCCGCCCTTGTACAGCTCGTCCATGCC) and inserted using Gibson assembly into KasI/BsaBI-cut IFITM3 cDNA. The resulting protein has amino acids 41 (P) and 42 (T) of wild-type IFITM3 removed. The cloning of IFITM3-imNeonGreen (IFITM3-imNG), and IFITM3-imTFP1 (IFITM3-imTFP1) into pQCXIN (Clontech) and pQXCIP (Clontech) retroviral expression vectors were done in two steps. In the first step, the EGFP in IFITM3-iEGFP/pLVX Tet on construct was replaced either with mNeonGreen or mTFP1 by overlapping PCR. The IFITM3-iEGFP/pLVX Tet on construct contain an EcoRI restriction site in the 5’ of the IFITM3-iEGFP cDNA and a BsrgGI in the 3’ of GFP cDNA that facilitated the replacement of GFP. The 5’ of IFITM3 cDNA was amplified by PCR using forward primer P1 (containing EcoRI restriction site) TACCACTTCCTACCCTCGTAAAGAATTCGCCACCATGAATCACACTGTCCAAACCTTC, and reverse primer P2: TGTGGTCTCCTCGCCCTTGCTCACTCCGCCGCTTCCTCCGCCGGGAGC. The mTFP1 fragment was amplified using forward primer P3: GCTCCCGGCGGAGGAAGCGGCGGAGTGAGCAAGGGCGAGGAGACCACA (complementary to P2), and the reverse primer P3 (containing BsrgGI restriction site) GATCCGCCTCCGCTTCCGCCCTTGTACAGCTCGTCCATGCCGTCGGTGGAATT. The fragments were purified, mixed and the overlapping PCR was perfomed using the forward primer P1 and the reverse primer P3. The final PCR fragment and IFITM3-iEGFP/pLVX Tet on were digested with EcoRI and BsrgGI restriction enzymes, purified and ligated. In the second step, the IFITM3-imTFP was amplified by PCR with forward primer P4 (containing AgeI restriction site) GCAGGAATTGATCCGCGGCCGCACCGGTAGGCCACCATGAATCACACTGTCCAAACCTTC, and reverse primer P5 (containing EcoRI restriction site) AGGGGTGGGGCGGGGGGGGGCGGAATTCTTAGTGATGGTGATGGTGATGGCCTTG, digested with AgeI and EcoRI restriction enzymes, purified and ligated into pQCXIN or pQXCIP vectors. For IFITM3-imNeonGreen construct the overlapping PCR was done using IFITM3-imTFP/pQCXIN construct as template and the AgeI and BamHI restriction sites. The 5’ of IFITM3 cDNA was amplified by PCR using forward primer P5 (containing AgeI restriction site) GCAGGAATTGATCCGCGGCCGCACCGGTAGGCCACCATGAATCACACTGTCCAAACCTT, and reverse primer P6: ATCCTCCTCGCCCTTGCTCACCATTCCGCCGCTTCCTCCGCCGGGAGC. The mNeonGreen cDNA was amplified with forward primer P7: GCTCCCGGCGGAGGAAGCGGCGGAATGGTGAGCAAGGGCGAGGAGGAT (complementary to P6), and reverse primer (containing BamHI restriction site) CGCTGCGGATGTGGATCACGGTGGATCCGCCTCCGCTTCCGCCCTTGTACAGCTCGTCCATGCCCA. Purified PCR fragments were mixed and the overlapping PCR was done using the forward primer containing AgeI restriction site and the reverse primer containing BamHI restriction site. The fragment and IFITM3-imTFP1 plasmid were digested with AgeI and BamHI , purified and ligated. The F75/F78A IFITM3-imTFP1 (2M-IFITM3-imTFP1) mutants was obtained by Quick-change site-directed mutagenesis (Stratagen, La Jolla, CA) using IFITM3-imTFP1/pQCXIN as template. Alexa Fluor 647-NHS ester (AF647) and the lipophilic dye SP-DiIC 18 (1,1'-Dioctadecyl-6,6'-Di(4-Sulfophenyl)-3,3,3',3'-Tetramethylindocarbocyanine) were purchased from Invitrogen/Life Technologies (Grand Island, NY). The LASV fusion inhibitor ST-193 was purchased from Aurum Pharmatech (Franklin Park, NJ). Amphotericin B (AmphoB) was obtained from Quality Biological (Gaithersburg, MD). Primary antibodies used were rabbit directed at the N-terminus of IFITM3 (Abgent, San Diego, CA), mouse anti-tubulin from Sigma (St. Louis, MO), HIV-1 IG serum (NIH AIDS Research and Reference Reagent Program), and rabbit anti-WSN Influenza R2376 (a generous gift from Dr. David Steinhauer, Emory University). Secondary antibodies used were rabbit anti-mouse IgG(H+L)-HRP (EMD Millipore), mouse anti-rabbit IgG(H+L)-HRP (EMD Millipore), and goat anti-human IgG-HRP (H+4) (Thermo Scientific).
Pseudovirus production and labeling
Pseudoviruses were produced by transfecting HEK 293T/17 cells with JetPRIME transfection reagent (Polyplus-transfection, Illkirch-Graffenstaden, France). For all pseudovirus productions the transfection reagent/DNA containing medium was replaced with fresh phenol red-free medium after ~14 hrs. Viruses were harvested ~48 hrs post-transfection, and cellular debris were removed by centrifuging at 230x g for 10 min. The collected viruses were passed through a 0.45 μm polyethersulfone filter (PES, VWR) to further clear cellular debris and virus aggregates, aliquoted and stored at -80°C. The infectious titers (~10 6 IU/ml) were determined using serial dilutions of the inoculum in TZM-bl cells using a β-galactosidase assay. To produce the pseudoviruses for co-localization analysis, HEK293T/17 cells were grown to ~60–70% confluency in a 6-well culture dish and transfected with 0.8 μg pR8ΔEnv, 0.4 μg pcRev, 0.5 μg HIV-1 Gag-mCherry (Not cleaved by protease) and 0.8 μg GPc-Lassa or 0.4 μg each of WSN HA- and NA-expressing plasmids, respectively. For single viral fusion experiments in live cells, dual-labeled LASVpp was made by transfecting the HEK293T/17 cells grown to ~60–70% confluency in a 6-well culture dish using 0.8 μg pR9ΔEnv, 0.2 μg pcRev, 0.2 μg mCherry-2pxCLYFP-Vpr and 1 μg GPc-Lassa plasmids. Similarly, dual-labeled IAVpp were produced using 4 μg pR9ΔEnv, 1 μg pcRev, 1 μg mCherry-2xCL-YFP-Vpr and 2.5 μg each of WSN HA- and NA-expressing plasmids for transfection of ~60% confluent cells in a 100 mm dish. The purified viruses were diluted 10-fold in PBS without calcium or magnesium (PBS-/-, Cellgro, Mediatech), bound to poly-L-lysine coated 8-well chamber cover slips (LabTek, MA), and imaged to estimate the co-labeling efficiency which was over 90% for all pseudoviruses used for this study. To generate VSV-G pseudotyped viruses encoding fluorescently-tagged IFITM3, HEK293T/17 cells grown in 6-well plate were transfected with 0.3 μg of VSV-G plasmid, 0.6 μg MLV-Gag-Pol plasmid, and 1.1 μg of either an empty pQXCIN or pQXCIP vector, or containing IFITM3-imNG, IFITM3-imTFP1, or 2M-IFITM3-imTFP1. For intraviral IFITM3 pseudovirus production, HEK293T/17 cells grown in 100-mm dishes were transfected with 2 μg of pCAGGS H1N1 HA/NA, 3 μg pR9ΔEnv, 1.5 μg BlaM-Vpr, 0.5 μg pcRev, and 5 μg of either empty Vector pQCXIP, IFITM3, or 2M-IFITM3 using JetPRIME reagent. The viral supernatants cleared of cellular debris as described above, were concentrated 10x, using Lenti-X Concentrator (Clontech, Mountain View, CA). Following overnight concentration with Lenti-X, virus was precipitated by centrifuging at 1439x g for 45 min, 4°C, resuspended in DMEM without phenol red or FBS, and stored at -80°C. For lipid mixing (hemifusion) experiments, influenza virus surface proteins and membrane were co-labeled with AF647 and with the lipophilic dye SP-DiIC 18 , respectively. Briefly, 100 μg of the purified IAV A/PR/8/34 virus (2 mg/ml, Charles River, CT) was mixed with 50 μM AF647 in 150 mM freshly prepared sodium bicarbonate buffer, pH 9.0. The labeling reaction was allowed to proceed at room temperature with tumbling in the dark for 30 min. Next, 5.8 μL of 1.75 mM SP-DiI 18 was added to this reaction, while gently vortexing and viruses further incubated at room temperature in the dark for 1 hr with shaking. The AF647 was quenched by adding 2 μL of 1 M Tris-buffer, pH 7.0. The labeled viruses were purified from excess dyes on a Nap-5 gel filtration column (GE Healthcare) that was equilibrated with 50 mM HEPES, pH 7.4, 145 mM NaCl at room temperature. The fractions containing labeled viruses were passed through a 0.45 μm filter to remove any large lipid and/or virus aggregates. The purified viruses were bound to poly-L-lysine coverslips and imaged to quantify their co-labeling efficiency which was at least 55%, determined as the percentage of AF647 labeled viruses that showed detectable signal (under the high self-quenching concentrations) of SP-DiI 18 . The viruses were aliquoted into tubes, flash-frozen, and stored at -80°C until use.
Virus cell fusion assay
The β-lactamase (BlaM) assay for virus-cell fusion were performed as described previously [ 30 , 43 ]. Briefly, pseudoviruses containing a β-lactamase-Vpr chimera (BlaM-Vpr) were bound to target cells by centrifugation at 4°C for 30 min at 1550x g . Unbound viruses were removed by washing with DMEM without phenol red supplemented with 20 mM HEPES (GE Healthcare Life Sciences). Fusion was initiated by shifting to 37° o C for 2 hours, after which cells were placed on ice and loaded with the CCF4-AM substrate (Life Technologies) and incubated overnight at 11°C. The cytoplasmic BlaM activity (ratio of blue to green fluorescence) was measured using a SpectraMaxi3 fluorescence plate reader (Molecular Devices, Sunnyvale, CA). p24 ELISA and Western blotting The p24 content of viral stocks was determined by ELISA, as described previously [ 78 ]. Whole cell lysates were harvested in RIPA Buffer (Sigma) supplemented with protease inhibitors (Complete Protease Inhibitor Cocktail, Roche), incubated on ice for 10 min, and cleared by centrifugation at 16,000x g for 5 min. Total protein was measured using a bicinchoninic acid assay (BCA, Pierce) and normalized protein was loaded onto 4–15% polyacrylamide gels (Bio-Rad, Hercules, CA). Precision Plus Protein Standards (Kaleidoscope Bio-Rad) were used as molecular weight markers. Proteins were transferred onto a nitrocellulose membrane, blocked in 10% Blotting-grade Blocker (Bio-Rad) in PBS-T (phosphate buffered saline with 0.1% Tween-20) for 30 min at room temperature. Membranes were incubated in primary antibodies overnight at 4°C in 5% Blotting-grade Blocker with gentle shaking: rabbit anti-IFITM3 (1:500), mouse anti-tubulin (1:3000), human HIV-IG) (1:2000), and rabbit anti-WSN Influenza R2376 (1:100). After washing membranes with PBS-T at room temperature, Horseradish peroxidase-conjugated (HRP) goat anti-rabbit, rabbit anti-mouse, and goat anti-human secondary antibodies were added in 5% Blotting-grade Buffer for 1 h at room temperature with gentle shaking. Following PBS-T washing of membranes, ECL Prime chemiluminescence reagent (GE Healthcare) was used for protein detection.
Cell-cell fusion
The effector Cos7 cells were transfected with the Lassa virus GPc expression vector. Briefly, cells were grown on 35 mm culture dishes to ~60% confluency and transfected with 4 μg GPc expression vector using a calcium-phosphate protocol [ 22 ]. After 48 hours following transfection, cells were loaded with 1.3 μM of the green cytoplasmic Calcein-AM dye (Invitrogen). In parallel, 293T cells or their derivatives stably expressing human IFITM1, IFITM2 or IFITM3 [ 22 ] were labeled with 30 μM of the blue cytoplasmic dye CMAC (Invitrogen). Effector and target cells were washed, detached from the culture dishes using a non-enzymatic solution, resuspended in PBS++, mixed at a 1:1 ratio and co-plated onto 8-well chamber slides. After incubating for 30 min at room temperature, cells were exposed to a pH 5.0 buffer at 37°C for 20 min, and the resulting cell-cell fusion was measured by visual inspection under a fluorescent microscope, as described in [ 22 ]. Ten fields of view each containing 10–12 heterologous cell pairs were examined in each well. 3D co-localization of IAV and LASV with IFITM3-containing compartments A549 cells expressing IFITM3-imNG were cultured on collagen-coated 8-chamber coverslips (Lab-Tek, NY #1.5 glass) in Fluorobrite DMEM to ~60–80% confluency. The cells were chilled by placing on ice for 10 min, followed by aspirating the media and washing with cold phosphate buffered saline with calcium and magnesium (PBS+/+). Cells were inoculated with a 5-fold dilution of the mCherry-labeled IAV or LASV pseudoviruses in 100 μL of cold LCIB supplemented with 2% FBS, and viruses were allowed to bind to cells by incubation at 4°C for 90 min. Unbound viruses were removed by washing with cold PBS+/+, and virus entry was initiated by adding 200 μL pre-warmed (37°C) LCIB. The slides were incubated at 37°C for varied times followed by fixation with 4% paraformaldehyde (PFA) in PBS-/- for 10 min at 37°C. For the zero time-point, cells were fixed with PFA immediately following the initial virus binding step at 4°C. After fixation, PFA was washed away with PBS-/- a few times and cells were imaged. For co-localization analysis, the fixed cells were imaged on DeltaVision Elite (GE Healthcare) widefield microscope, using an Olympus PlanApoN 60x/1.42 NA oil immersion objective. Multiple Z-stacks with a spacing of 0.1 μm covering the entire thickness of the cells were acquired using a standard GFP/Cherry filter set. Deconvolution of the Z-stacks was done post acquisition to improve the signal-to-background ratio of the IFITM3-mNeonGreen vesicles and of mCherry labeled viruses using SoftWorX (DeltaVision, GE Healthcare). The deconvolved Z-stacks were used for quantitative volume based (voxel based) co-localization analysis using a custom protocol in the image analysis program Volocity (Perkin Elmer, Waltham, MA). Briefly, after background subtraction, the IFITM3 containing vesicles were identified as objects. mCherry virus particles with a size/volume threshold of 0.512 μm 3 (corresponding to a 2x2x2 voxel) and that were associated with IFITM3-expressing cells were identified. A virus particle was considered co-localized with IFITM3 when at least 50% of its volume overlapped within an IFITM3 expressing object. For every time point, at least 4 different fields of view containing multiple cells were imaged and the mean values of the % co-localization calculated. Fixed cell imaging A549 IFITM3-imNG, IFITM3-imTFP1, or 2MIFITM3-imTFP1 cells were seeded onto 35 mm collagen-coated glass-bottom Petri dishes (MatTek, MA) one day prior to imaging and cultured in DMEM without phenol red supplemented with 10% FBS, penicillin, and streptomycin. Following a wash with room temperature PBS, cells were fixed in 3.5% paraformaldehyde in PBS for 10 min. For imaging with LysoTracker™, cells were seeded as above and incubated with 30 nM LysoTracker™ Red DND-99 (ThermoFisher) diluted in pre-warmed LCIB supplemented with 2% FBS for 30 min prior to fixation. Images were acquired on a DeltaVision microscope using an Olympus UPlanFluo 40x/1.3 NA oil immersion objective (Olympus, Japan). Multiple Z-stacks with a spacing of 0.1 μm covering the entire thickness of the cells were acquired and deconvolved.
Single-virus imaging in live cells
A549 cells were seeded onto 35 mm collagen-coated glass-bottom Petri dishes (MatTek, MA) one day before imaging and cultured in Fluorobrite DMEM supplemented with 10% FBS, penicillin, streptomycin and L-glutamine. Before imaging, the cells were pre-chilled on ice and washed with ice-cold PBS+/+. A small amount of viral suspension (~1 μL) diluted in 60 μL of cold LCIB was added to the cells and spinoculated at 1550x g at 4°C for 20 min. After spinoculation, the cells were washed twice with PBS +/+ to remove any unbound viruses and a small volume (~150 μL) of ice-cold LCIB was added to the cells. Viral entry was initiated by adding 2 mL of pre-warmed (37°C) LCIB containing 2% FBS, and cells were imaged immediately on DeltaVision microscope equipped with a temperature and humidity-controlled chamber. Every 6–8 sec, at least three Z-stacks spaced by 1.5–2 μm were acquired to cover the thickness of cells using Olympus 40x UPlanFluo 40x/1.3 NA oil objective (Olympus, Japan). The three-color viral fusion experiments were done with A549 cells expressing IFITM3-imTFP1 or 2M-imTFP1 using a standard CFP/YFP/Cherry filter set (Chroma, VT), while a TRITC/FITC/Cy-5 filter set was used for the three-color lipid mixing experiments with IFITM3-mNeonGreen expressing cells. LCIB in all the experiments was supplemented with 2% FBS.
Single-virus event annotation and tracking
The time-lapse Z-stack movies are visually inspected as maximum intensity projections, using ImageJ, and the ROI manager tool was used to annotate the single fusion or hemifusion events (observed as color change or DiI intensity increase). The sets of waiting times for hemi/fusion obtained from multiple movies are combined from experiments done on different days, sorted and plotted as cumulative probability curves that show the kinetics of the event. Acquired image series were converted to maximum intensity projections and annotated particles were tracked using either Volocity (GE Healthcare) or ICY image analysis software (icy.bioimageanalysis.org). Fluorescently labeled viral particles were identified using the spot detection algorithm and tracked in 3D to determine fluorescence intensities at every time point. With three-color imaging to track double-labeled viral particles that co-traffic with fluorescently-labeled IFITM3 compartments, single Z-planes in which the viral particle trafficked were used so that background subtraction could be performed using the ICY spot tracking algorithm. The local background was determined by dilating the identified objects corresponding to viral particles by two pixels. The difference between the integrated intensities of the particle and the dilated surrounding gave the intensity surrounding the particle, from which an average per pixel local background was calculated. This was used to obtain the background-corrected intensity of the particle at every time point, which is plotted in the time traces as shown in the figures. Lipid dequenching (hemifusion) assay For the lipid mixing experiments, SP-DiI 18 dequenching curves for the individual viruses were obtained by tracking particles, either using the AF647 channel or the DiI channel. The dequenching ratios and times were manually obtained from time traces that show at least 4-fold increase in SP-DiI 18 intensity. The dequenching ratio was calculated as ratio of the mean SP-DiI 18 intensity before the rise of the signal and the mean intensity after completion of dequenching. The dequenching time was measured as time taken to reach an intensity plateau from the time of initial rise in intensity. The traces showing multi-phase increase in SP-DiI 18 signal in IFITM3 expressing cells were excluded from the calculation of dequenching ratios and times.
Supporting information S1 Fig Expression of fluorescently labeled IFITM3 constructs in A549 cells. Stable cell lines constitutively expressing IFITM3-imNG ( A ), IFITM3-imTFP1 ( B ), or 2M-IFITM3-imTPF1 ( C ) were fixed and counterstained with Hoechst and imaged. Scale bars 27 μm. ( D ) The fraction of cells expressing IFITM3-imNG, IFITM3-imTFP1, and 2M-IFITM3-imTFP1. The total number of analyzed cells (identified by Hoechst staining) was 411, 405, and 323, respectively. (TIF) Click here for additional data file. S2 Fig IFITM3 expression does not affect the kinetics of IAV hemifusion but can slow down lipid mixing. (A) Kinetics of DiI dequenching in Vector and IFITM3 expressing A549 cells. The waiting times to onset of DiI dequenching were determined by single particle tracking and plotted as cumulative distributions. (B) Images showing lipid mixing between IAV co-labeled with SP-DiI 18 (green) and AF647 (red) and an endosome in A549-IFITM3-imNG (blue) cells. Dequenching of SP-DiI 18 occurs as a result of HA-mediated lipid mixing. Scale bar 3.1 μm. (C) Fluorescence traces for the IAV hemifusion event in (A) that co-traffics with an IFITM3+ compartment, with a biphasic increase in intensity of SP-DiI 18 , suggesting the possibility of transient closure of the fusion pore or transition from a hemifusion structure that is more restrictive to lipid diffusion to a fusion pore. The reference AF647 signal remains steady. (TIF) Click here for additional data file. S3 Fig IAVpp fusion can occur in the vicinity of IFITM3-positive compartments. (A) Time series images showing fusion of IAVpp in an IFITM3-imTFP1 expressing A549 cell. IAVpp comes in close proximity with an IFITM3+ vesicle, but does not co-traffic with it, and fusion occurs in the vicinity of the IFITM3+ endosome. (B) Fluorescence traces of the particle tracked in (A) show the fusion event around 15 min. Inset : The close-up view of the trace on the right shows that the IAV particle does not consistently (for more than 5 consecutive frames or 30 sec) co-traffic with the IFITM3+ endosome prior to fusion. (C) 3-dimensional trajectories of the virus and endosome marked in panel A. (See S7 Movie ). (TIF) Click here for additional data file. S4 Fig Analysis of acidity of IFITM3-imTFP1 containing endosomes. (A) Images of stable A549 cell lines constitutively expressing IFITM3-imTFP1 incubated with 30 nM LysoTracker Red DND-99 (LTRed) for 30 min at 37°C prior to fixation in 3.5% paraformaldehyde. The enlarged boxed area is shown on the right. Scale bar 3 μm. (B) Average sum intensities for each above-background IFITM3-imTFP1 and LysoTracker™ spots from 13 randomly selected cells were analyzed. The average fractions of double-positive endosomes normalized to the total IFITM3-imTFP1 or LysoTracker (LTRed) spots are shown. (TIF) Click here for additional data file. S5 Fig Kinetics of IAVpp fusion. (A) Kinetics of IAVpp fusion events in Vector, IFITM3-imTFP1, 2M-IFITM3-imTFP1, and IFITM3-imTFP1 cells treated with 1 μM AmphoB. A total of 90, 12, 36, and 23 fusion events were annotated out of 4248, 4133, 2487, and 921 total viral particles in Vector, IFITM3-imTFP1, 2M-IFITM3-imTFP1, and IFITM3-imTFP1 cells treated with AmphoB, respectively. The kinetics of IAVpp fusion in IFITM3-imTFP1 cells is slower than in 2M-IFITM3-imTFP1 and IFITM3-imTFP1 cells treated with AmphoB. (TIF) Click here for additional data file. S6 Fig Kinetics of LASVpp fusion. (A) Cumulative distribution of waiting times to single LASVpp fusion in A549 Vector or IFITM3-imTFP1 (IFITM3+) cells. A total of 53 fusion events were annotated in Vector cells from 2931 particles; a total of 15 fusion events occurred in IFITM3-imTFP1 cells from 1683 particles. (B) Kinetics of LASVpp escape from inhibition by NH 4 Cl (40 mM) added at indicated times post-infection. Virus fusion was measured by the BlaM assay. Data points are means and STD of combined duplicate measurements from two independent experiments. The somewhat slower kinetics of fusion observed by the bulk BlaM assay (B) relative to single virus imaging-based fusion kinetics (A) is likely due to the limited time of imaging and difficulties with reliable detection of late fusion events by single particle tracking. (TIF) Click here for additional data file. S7 Fig IFITM3-containing extracellular vesicles do not modulate IAVpp fusion. ( A ) Illustration of the experimental protocol for testing the effect of extracellular medium containing cell-derived IFITM3-containing vesicles on IAV fusion (top) and measurements of IAVpp fusion with A549 cells, using a BlaM assay (bottom). Control and IFITM3 containing IAVpp (also containing BlaM-Vpr) were prepared as in Fig 8 . In control experiments, HEK293T/17 cells were transfected with an empty vector or IFITM3 expressing vector. Equal volumes of superntatants collected from the mock and IFITM3 transfected cells were mixed in equal volumes with IAVpp prior to incubation with A549 cells and fusion was measured by the BlaM assay. Data are means and SEM based on two independent experiments performed in triplicate. ( B ) Western blot analysis of IAVpp and extracellular vesicles corresponding to the protocol in (A). Left: Extracellular media containing control IAVpp, IAVpp produced by IFITM3-expressing cells and/or vesicles derived from control or IFITM3-transfected cells were collected, concentrated with LentiX, as decribed in (A) lysed, subjected to SDS-PAGE and analyzed with anti-IFITM3 antibody. Middle/right: Western blots of control and IFITM3-containing viruses using anti-p24 or anti-influenza WSN antibodies. (TIF) Click here for additional data file. S1 Movie IAV lipid mixing in A549 Vector cells. Dequenching of SP-DiI 18 (green) upon entry of IAV co-labeled with AF647 (red) into A549 Vector cells. Increase in SP-DiI 18 fluorescence is indicated by a white arrow around 22 min. Scale bar 4.5 μm. Movie is slowed to 0.2x speed (22–24 min) to emphasize the onset of dequenching. (Related to Fig 2B and 2C ). (AVI) Click here for additional data file. S2 Movie Dynamics of fluorescent IFITM3-positive endosomes in A549 cells. Trafficking of IFITM3-imTFP1 (blue) constitutively expressed in A549 cells. Scale bar 11 μm. (AVI) Click here for additional data file. S3 Movie Lipid mixing in A549 IFITM3-imNG cells. Movie showing the dequenching of SP-DiI 18 (green) upon entry of IAV co-labeled with AF647 (red) in IFITM3-imNG cells (blue). The increase in SP-DiI 18 fluorescence is indicated by a white arrow around 35 min. Scale bar 4.5 μm. Movie is slowed to 0.2x speed from 35–38 min. (Related to Fig 2D–2F ). (AVI) Click here for additional data file. S4 Movie IAV pseudovirus fusion in A549 Vector cells. IAVpp containing A549 Vector cells were infected with mCherry-2xCL-YFP-Vpr labeled IAVpp which fuses at 30 min, as indicated by the loss of mCherry signal (white arrow). Movie is slowed to 0.2x speed to highlight the fusion event at 30–31 min. Scale bar 2.2 μm. (Related to Fig 3B and 3C ) (AVI) Click here for additional data file. S5 Movie IAV pseudovirus co-trafficking with an IFITM3-positive endosome. A549 IFITM3-imTFP1 cells were inoculated with IAVpp containing mCherry-2xCL-YFP-Vpr. Movie shows the co-trafficking of the viral particle with an IFITM3+ endosome (starting at 7:07 min), merger with additional IFITM3+ endosomes at 10:07 and 43:37 min (white arrows), but no fusion. Movie is slowed to 0.2x speed from 7–12 min and 40–45 min. Scale bar 3.4 μm. (Related to Fig 3D–3F ). (AVI) Click here for additional data file. S6 Movie IAV pseudovirus fusion outside of an IFITM3+ endosome. IAVpp was prepared as in S5 Movie . IAVpp seemingly encounters an IFITM3+ endosome at around 23 min (white arrow) but does not co-traffic with it. Fusion occurs at 31:25 without any detectable IFITM3+ signal associated with the particle. Movie is slowed to 0.2x speed at 23- and 31-min. Scale bar 3.3 μm. (Related to Fig 3G–3I ). (AVI) Click here for additional data file. S7 Movie IAV pseudovirus fusion associated with apparently transient IFITM3-positive endosome colocalization. IAVpp was prepared as in Supplemental Movies S5 and S6. IAVpp only transiently overlaps with an IFITM3+ endosome at 15:25, as indicated by the white arrow. Fusion occurs just shortly thereafter, at 15:49 but without any detectable IFITM3+ signal associated with the virus. Movie is slowed to 0.2x speed from 14–17 min. Scale bar 2.2 μm. (Related to S3 Fig ). (AVI) Click here for additional data file. S8 Movie IAV pseudovirus fusion with an IFITM3-positive endosome in cells treated with Amphotericin B. IAVpp was labeled with mCherry-2xCL-YFP-Vpr and added to A549-IFITM3-imTFP1 cells treated with 1 μM AmphoB. Movie depicts a viral particle entering an IFITM3+ endosome at around 33 min (white arrow) and co-trafficking until fusion at 42 min (loss of mCherry signal, white arrow). Movie is slowed to 0.2x speed at 34–46 and 42-44min. Scale bar 2.1 μm. (Related to Fig 4C and 4D ). (AVI) Click here for additional data file. S9 Movie IAV pseudovirus fusion in a cell expressing inactive IFITM3 mutant. IAVpp was prepared with mCherry-2xCL-YFP-Vpr and added to cells expressing the 2M-IFITM3-imTFP1 mutant. The viral particle does not co-traffic with any local IFITM3-positive maxima, and fuses at around 19 min (white arrow). Movie is slowed to 0.2x speed from 18–21 min. Scale bar 4.1 μm. (Related to Fig 4E and 4F ). (AVI) Click here for additional data file. S10 Movie LASV pseudovirus fusion in A549 cells. LASVpp was labeled with mCherry-2xCL-YFP-Vpr and added to A549 Vector cells. The particle undergoes YFP quenching at around 32 min (white arrow) and fusion at around 44 min, as indicated by the sudden loss of mCherry and de-quenching of YFP (white arrow). Movie is slowed to 0.2x speed at 32–35 min and 43–45 min. Scale bar 4.0 μm. (Related to Fig 5B and 5C ). (AVI) Click here for additional data file. S11 Movie LASV pseudovirus fusion in A549 cells expressing IFITM3-imTFP1. LASVpp does not co-traffic with IFITM3-imTFP1-positive endosomes and subsequent viral fusion occurs at sites without any local IFITM3-imTFP1 maxima. YFP quenching occurs at around 14 min (white arrow) and fusion occurs at around 46 min (white arrow), as indicated by the sudden loss of mCherry and dequenching of YFP. Movie is slowed to 0.2x speed at 13–16 min and 45–46 min. Scale bar 3.1 μm. (Related to Fig 6A and 6B ). (AVI) Click here for additional data file. S12 Movie LASV pseudovirus content release from within an IFITM3 containing endosome. LASVpp co-trafficking with an IFITM3-imTFP1-positive endosome and fusion occurring at 14:49, as indicated by the white arrow. Movie is slowed to 0.2x speed from 14–15 min. Scale bar 1.6 μm. (Related to Fig 6E and 6F ). (AVI) Click here for additional data file.
📊 Figures
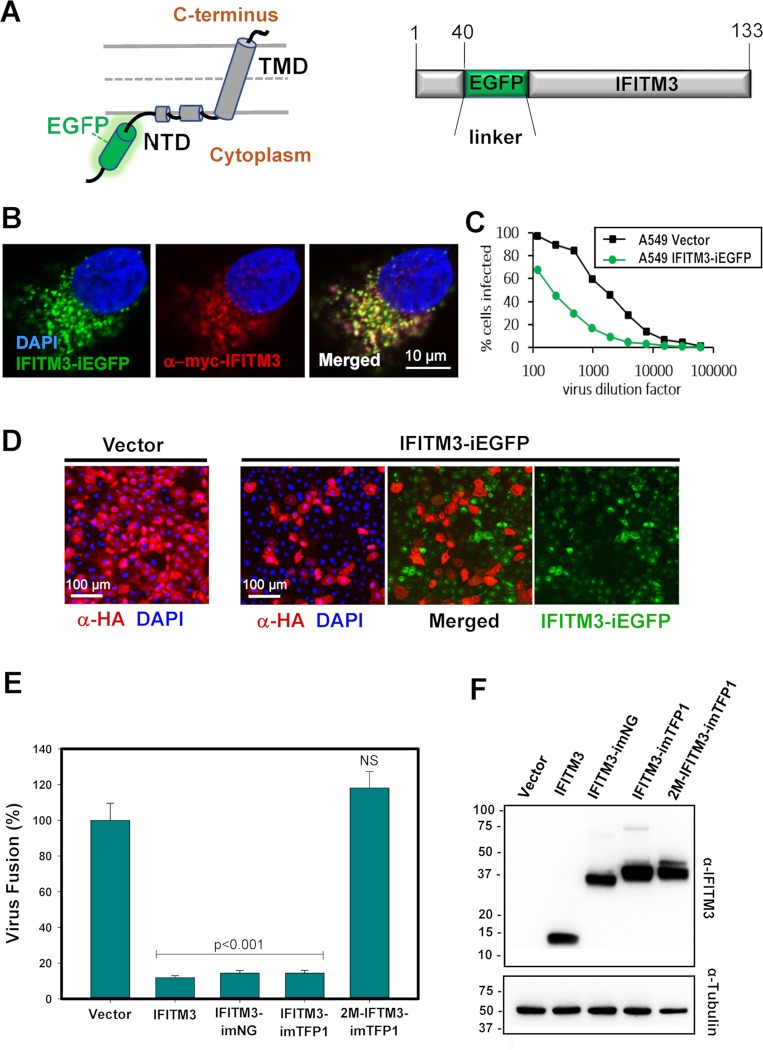
Fig 1
Construction and validation of IFITM3 tagged with florescent proteins.
(A) Cartoon and schematic representation of IFITM3-iEGFP fusion protein. EGFP flanked with flexible linkers (GGGSGG) was inserted after residue 40 of IFITM3. NTD, N-terminal domain, TMD, transmembrane...
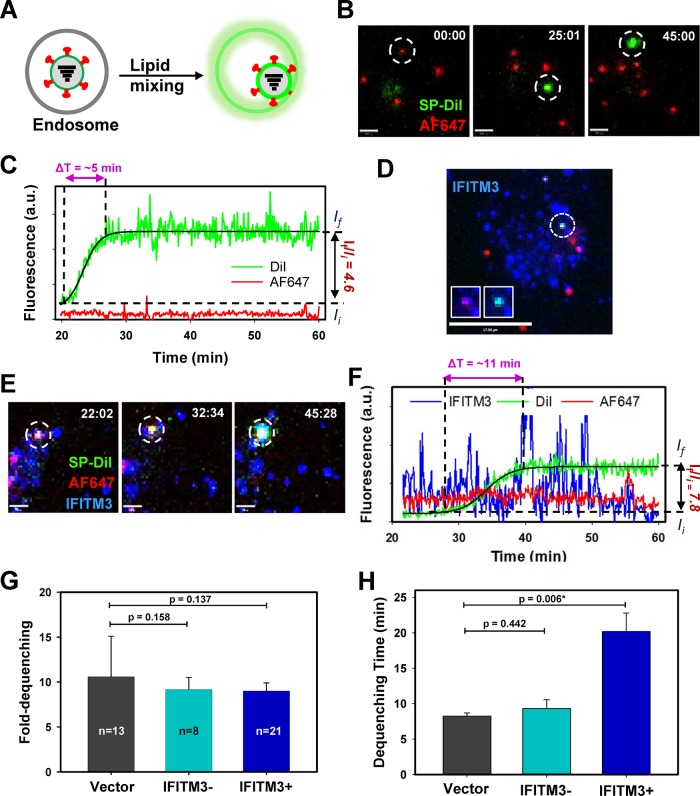
Fig 2
Fluorescent IFITM3 does not restrict IAV lipid mixing.
(A) Schematic showing the single-virus hemifusion assay by monitoring dequenching of a lipophilic dye (SP-DiI 18 , colored green) resulting from lipid mixing between a virus and an endosome, yielding ...
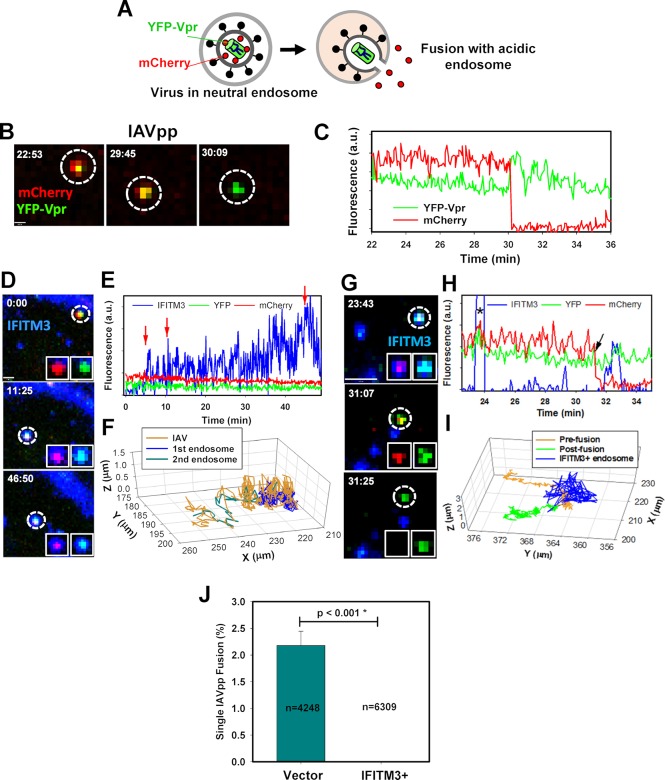
Fig 3
IFITM3 co-traffics with IAV and restricts viral fusion.
(A) Schematic illustration of the single-virus fusion assay. Pseudoviruses bearing influenza virus HA and NA glycoproteins (IAVpp) are co-labeled with mCherry-2xCL-YFP-Vpr. Membrane fusion resulting i...
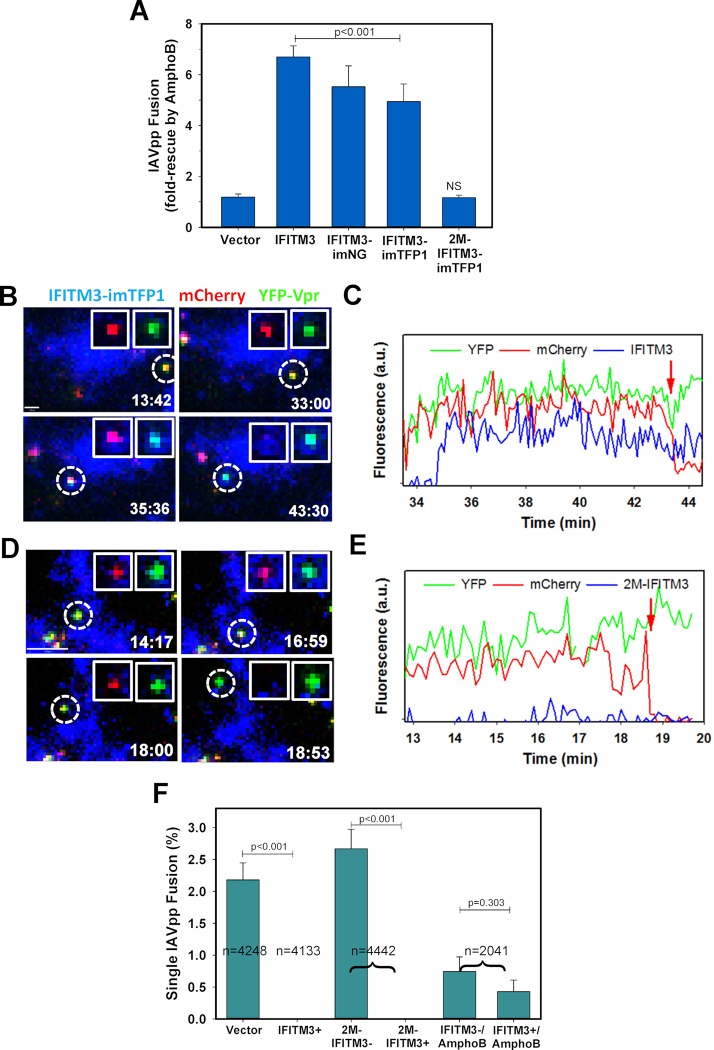
Fig 4
Amphotericin B treatment allows IAV fusion with IFITM3-containing endosomes.
(A) AmphoB rescues IAVpp fusion with IFITM3 expressing cells. IAVpp carrying BlaM-Vpr were used to infect A549 Vector, IFITM3, IFITM3-imNeonGreen (IFITM3-imNG), IFITM3-imTFP1, or 2M-IFITM3-imTFP1 cell...
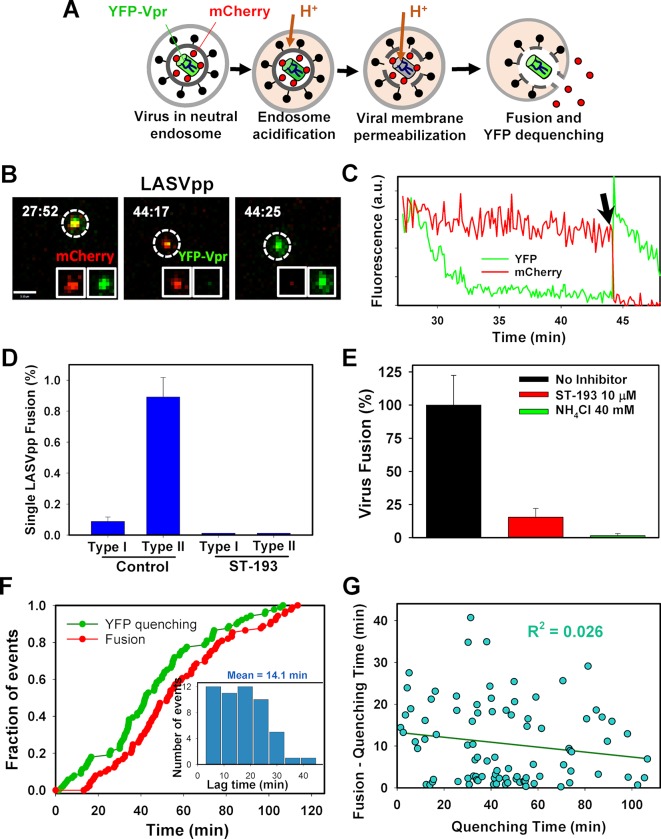
Fig 5
LASV pseudovirus fusion with A549 cells is preceded by a virus membrane permeabilization step.
(A) Illustration of the fusion event depicting different stages of LASV fusion with an endosome. The YFP signal is quenched in an acidic endosome, due to viral membrane permeabilization, prior to fusi...
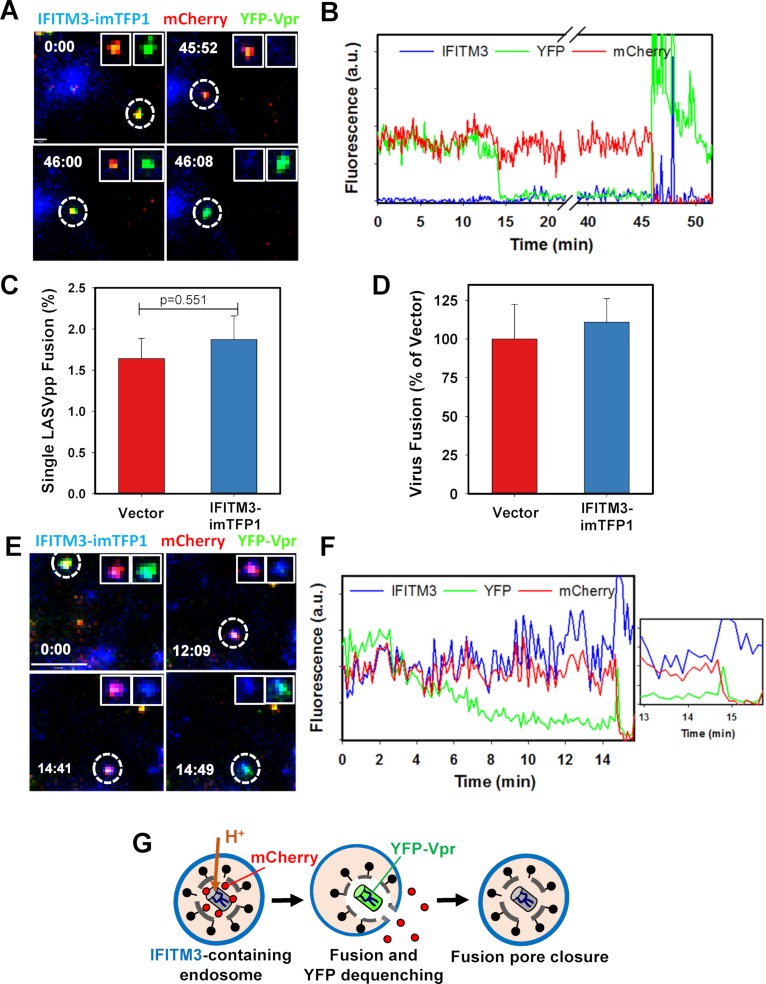
Fig 6
LASV pseudoviruses fuse with endosomes lacking IFITM3.
LASVpp labeled with mCherry-2xCL-YFP-Vpr were allowed to enter and fuse with A549-IFITM3-imTFP1 cells. (A) Images of a single LASVpp fusion just prior to transient colocalization with an IFITM3-imTFP1...
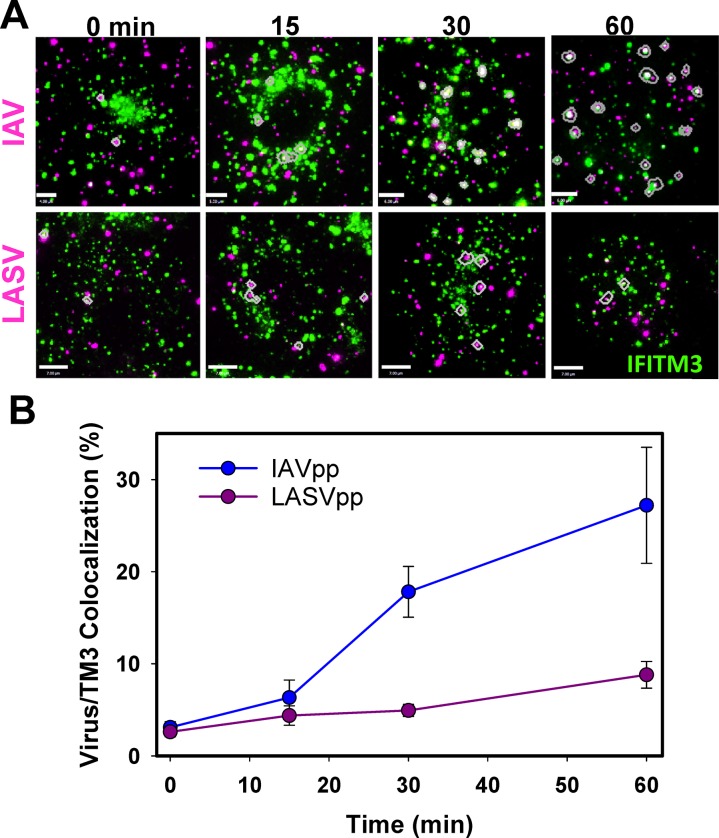
Fig 7
IAV but not LASV particles colocalize with IFITTM3-containing vesicles.
A549 cells expressing IFITM3-imNG were incubated in the cold for 1.5 hr with particles pseudotyped with IAV HA/NA or LASV GPc and labeled with HIV-1 Gag-mCherry (red). Cells were washed to remove unbo...
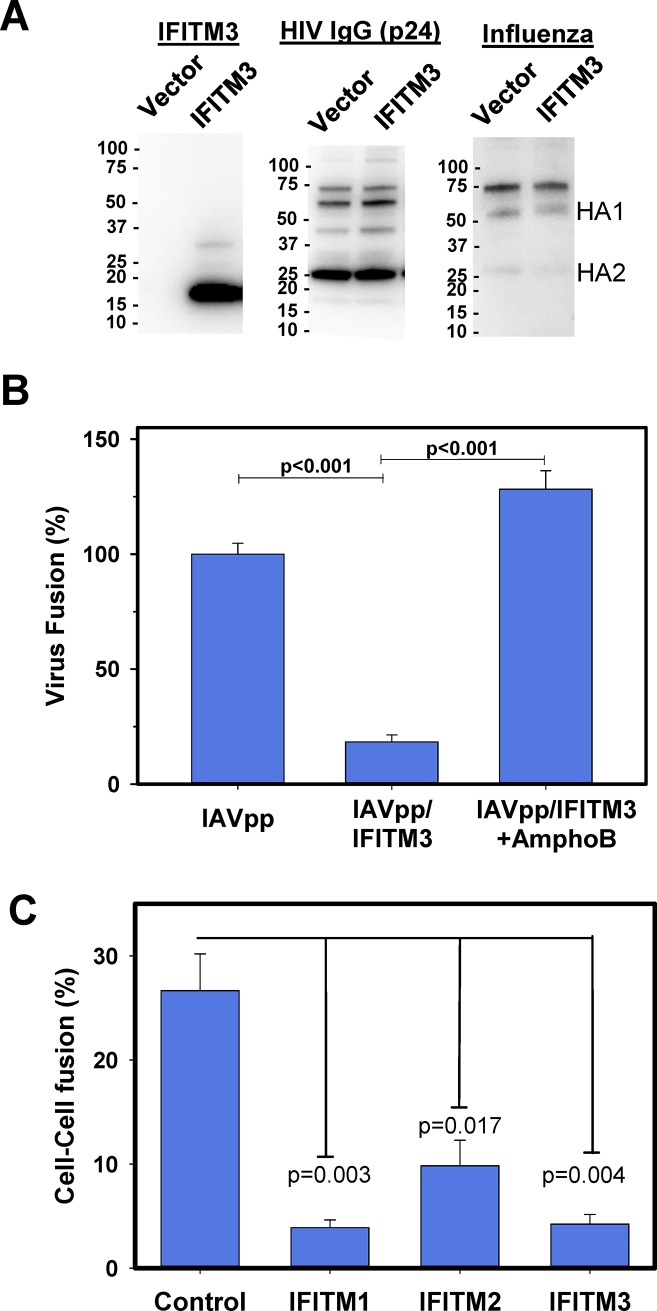
Fig 8
IFITM3 proximity to viral fusion proteins allows virus restriction.
(A-D) IFITM3 incorporates into virions and restricts viral fusion in A549 cells. (A) Western blot of control and IFITM3-containing IAVpp prepared through co-transfection of 293T/17 cells with addition...
Figure images are served from the NIH/NLM PubMed Central Open Access Subset or Europe PMC; copyright remains with the publishers and authors.
💬 Discussion
0 commentsNo comments yet. Be the first to start a discussion!
Leave a Comment