Abstract
Kinesin-1, the founding member of the kinesin superfamily of proteins, is known to use only a subset of microtubules for transport in living cells. This biased use of microtubules is proposed as the guidance cue for polarized transport in neurons, but the underlying mechanisms are still poorly understood. Here, we report that kinesin-1 binding changes the microtubule lattice and promotes further kinesin-1 binding. This high-affinity state requires the binding of kinesin-1 in the nucleotide-free state. Microtubules return to the initial low-affinity state by washing out the binding kinesin-1 or by the binding of non-hydrolyzable ATP analogue AMPPNP to kinesin-1. X-ray fiber diffraction, fluorescence speckle microscopy, and second-harmonic generation microscopy, as well as cryo-EM, collectively demonstrated that the binding of nucleotide-free kinesin-1 to GDP microtubules changes the conformation of the GDP microtubule to a conformation resembling the GTP microtubule.
🔬 Techniques
🔭 Microscopes
🧬 Organisms
💻 Software
✨ Fluorophores
🧪 Sample Preparation
🔬 Cell Lines
🏭 Microscope Brands
🧪 Reagent Suppliers
🔴 Lasers
📷 Detectors
🔎 Objectives
🎨 Filters
💻 Software Details
💾 Data Repositories
🏛️ Research Organizations (ROR)
Affiliated research institutions:
📋 Methods
Snapshot analyses of KIF5 localization in various cells
Cell lines (Vero, HeLa, and MDCK) were obtained from RIKEN cell bank (RCB0001, RCB0007, and RCB0995, respectively) and maintained in high-glucose DMEM (Wako) supplemented with 10% FBS (Thermo Fisher) and antibiotics (penicillin-streptomycin; Thermo Fisher). The expression plasmid was constructed by inserting the coding sequence for aa 1–560 of mouse KIF5C using the EcoRI and SalI sites in the multiple cloning site of pEGFP-N1 (Clontech). The cells were transfected with Transfectin (Bio-Rad) or X-treme gene (Roche) and plated to the glass bottom dish (MatTek) coated with Matrigel (BD) for HeLa and MDCK or collagen (Cellmatrix type-IA, Nitta Gelatin) for Vero. The transfected cells were observed within 12–16 h after transfection, and only cells with low expression levels were selected for the observation, because asymmetric distribution of KIF5 tended to be less clear in cells with higher expression levels, particularly more than 24 h after transfection. The cells were observed under an atmospheric CO 2 environment in L15 medium (Gibco) supplemented with 10% FBS. For HeLa and MDCK cells, an inverted microscope IX71 (Olympus) was used for observation with a 100× objective lens (UPlan SApo 100×/1.40; Olympus) and an EMCCD camera Luca (Andor) using μManager ( Edelstein et al., 2010 ) as the controlling software. Images of Vero cells were taken with the same objective lens on an inverted microscope (IX81; Olympus). MetaMorph software (Molecular Devices) was used to control the microscope and camera (sCMOS camera ORCA FLASH 4.0; Hamamatsu). Images were pseudocolored using ImageJ.
Show full methods section
Snapshot analyses of KIF5 localization in various cells
Cell lines (Vero, HeLa, and MDCK) were obtained from RIKEN cell bank (RCB0001, RCB0007, and RCB0995, respectively) and maintained in high-glucose DMEM (Wako) supplemented with 10% FBS (Thermo Fisher) and antibiotics (penicillin-streptomycin; Thermo Fisher). The expression plasmid was constructed by inserting the coding sequence for aa 1–560 of mouse KIF5C using the EcoRI and SalI sites in the multiple cloning site of pEGFP-N1 (Clontech). The cells were transfected with Transfectin (Bio-Rad) or X-treme gene (Roche) and plated to the glass bottom dish (MatTek) coated with Matrigel (BD) for HeLa and MDCK or collagen (Cellmatrix type-IA, Nitta Gelatin) for Vero. The transfected cells were observed within 12–16 h after transfection, and only cells with low expression levels were selected for the observation, because asymmetric distribution of KIF5 tended to be less clear in cells with higher expression levels, particularly more than 24 h after transfection. The cells were observed under an atmospheric CO 2 environment in L15 medium (Gibco) supplemented with 10% FBS. For HeLa and MDCK cells, an inverted microscope IX71 (Olympus) was used for observation with a 100× objective lens (UPlan SApo 100×/1.40; Olympus) and an EMCCD camera Luca (Andor) using μManager ( Edelstein et al., 2010 ) as the controlling software. Images of Vero cells were taken with the same objective lens on an inverted microscope (IX81; Olympus). MetaMorph software (Molecular Devices) was used to control the microscope and camera (sCMOS camera ORCA FLASH 4.0; Hamamatsu). Images were pseudocolored using ImageJ.
Time-course analysis of KIF5 localization in Vero cells
Vero cells were transfected and plated to a collagen-coated glass-bottom dish as described above. The cells were observed with a total internal reflection fluorescence microscope with a Plan-Apo 60×/NA 1.42 oil objective (Olympus) and an sCMOS camera (Zyla4.2; Andor) on an IX83 microscope (Olympus). The system was controlled with MetaMorph. Each cell was examined every 30 min for 6 h. For each time point of observation, 300 frames of images were recorded at 10 Hz for 30 s The trajectories of KIF5C movement were shown as the SD map ( Reed et al., 2006 ) of each 300-frame image sequence using ImageJ.
Protein sample preparation
Tubulin was purified from porcine brain through four cycles of polymerization and depolymerization using 1 M Pipes buffer (1 M Pipes-KOH, 1 mM EGTA, and 1 mM MgCl 2 , pH 6.8) for effective removal of microtubule-associated proteins ( Castoldi and Popov, 2003 ). The labeled tubulin was prepared by incubating polymerized microtubule with tetramethylrhodamine succinimidyl ester (C-1171; Life Technologies), Alexa Fluor 647 NHS Ester (A-20106; Life Technologies), or NHS-LC-biotin (21336; Life Technologies) for 30 min at 37°C ( Desai and Mitchison, 1998 ). Then, we purified functional labeled tubulin using two cycles of polymerization and depolymerization. The K351 KIF5C motor domain and K560 KIF5C dimer recombinants were expressed in BL21-CodonPlus(DE3)-RIL (Agilent) and Sf9 cells, respectively ( Okada and Hirokawa, 1999 ). Both expressed KIF5C proteins were then purified using their His 6 tag by TALON metal affinity resin (Clontech). For fluorescent imaging, K351 was labeled with DY-647-maleimide (Dyomics; Okada and Hirokawa, 1999 ). Excess DY-647 was removed using the Micro Bio-Spin 30 size exclusion column (Bio-Rad). GMPCPP was prepared enzymatically from GMPCP (M3170; Sigma-Aldrich) together with nucleotide diphosphate kinase (N0379; Sigma-Aldrich) and then purified using a Mono Q 5/50 GL column (GE Healthcare; Hyman et al., 1992 ).
Fluorescent microscopy
The nonlabeled tubulin, tetramethylrhodamine-labeled tubulin, and biotin-labeled tubulin were copolymerized to yield microtubules with a rhodamine and biotin labeling ratio of 2% and 3%, respectively. For GMPCPP microtubules, we repeated three cycles of GMPCPP uptake in the presence of 0.2 mM GMPCPP to obtain microtubules with over 90% occupancy of GMPCPP in β-tubulins ( Yajima et al., 2012 ). To prepare GDP microtubules, tubulins were copolymerized in the presence of 1 mM GTP. Then, the buffer was exchanged for GPEM buffer (100 mM Pipes-KOH, 30% [vol/vol] glycerol, 2 mM MgSO 4 , and 1 mM EGTA, pH 6.9) by centrifugation. To ensure GTP hydrolysis in the microtubule, GDP microtubules were used for the experiments after more than 3 h of incubation at room temperature. The glass chambers for observation were prepared as follows. After sonication in 1 N KOH and plasma treatment (Diener), the surface of the cover glasses (C022221S; Matsunami Glass) was silanized with N -2-(aminoethyl)-3-aminopropyl-triethoxysilane (KBE-603; Shin-Etsu Chemical) and then incubated with 200 mg/ml NHS-PEG (ME-050-TS; NOF) with or without 1 mg/ml NHS-PEG-biotin (BI-050-TS; NOF) for 3 h at room temperature to make PEG-biotin–coated or PEG-coated glasses ( Yokota et al., 2009 ). The PEG-biotin–coated glass and the PEG-coated glass were separated using a 30-µm layer of double-sided tape (5603; Nitto-Denko) to make the flow chamber. Microtubules were immobilized on the PEG-biotin–coated glass surface via Neutravidin (31000; Thermo Fisher), and the glass surface was then blocked with imaging solution (45 mM Pipes-KOH, 2 mM MgSO 4 , 1 mM EGTA, 1% [wt/vol] Pluronic F-127, 1 mg/ml casein, 1 mM d-biotin, 2 mM dithiothreitol, 0.2 mg/ml glucose oxidase, 40 µg/ml catalase, 1 mM glucose, and 30% [vol/vol] glycerol, pH 7.2). Finally, K351-DY-647 or K560-GFP was added to the imaging solution and introduced into the chamber. The images of microtubules were observed under total internal reflection fluorescence microscopy (IX81) with a 100× objective lens (UPlanSApo, NA 1.40, oil; Olympus) and recorded at the frame rate of 10 frames per second using an iXon3 EM CCD camera (Andor) and MetaMorph software. During observation, the temperature of the chamber was kept at 37°C. The images were processed for background subtraction and further analysis using ImageJ.
Statistical analyses
The distribution of the landing rates ( Fig. 1, G–I ) and the bound head density ( Fig. 2, B and D ) was analyzed using a expectation-maximization algorithm for Gaussian mixture model using mclust package ( Scrucca et al., 2016 ) in R ( Ihaka and Gentleman, 1996 ). P values for comparison of motility parameters ( Fig. 1, G–L ), microtubule elongation rates ( Fig. 5 C ), and SHG signals ( Fig. 6, D and E ) were calculated by a nonparametric multiple comparison test (Steel–Dwass) using the pSDCFlig function in the NSM3 package ( Schneider et al., 2018 ) in R.
Fluorescent speckle microscopy
GDP microtubules labeled with DY-647 and biotin were prepared as described above and then shortened to be less than 2 µm long by pipetting. These microtubule seeds were immobilized on a PEG-biotin–coated glass surface via Neutravidin. After washing with the imaging solution, we introduced the solution containing 6 µM tubulin, 120 nM tetramethylrhodamine-labeled tubulin, 1 mM GTP, and 1 mM MgSO 4 into the chamber to polymerize the tubulins at the ends of the immobilized microtubules. Following incubation at 37°C for 2 min, the solution in the chamber was changed to 6 µM tubulin, 120 nM DY-647–labeled tubulin, 1 mM GTP, and 1 mM MgSO 4 and then washed out with the imaging solution immediately after the change. To make multiple DY-647–labeled speckles in the microtubule, we repeated this tubulin polymerizing procedure four times. Then, the imaging solution containing 0.5% (wt/vol) methylcellulose (Methocel MC; Sigma-Aldrich) was introduced in the chamber to suppress fluctuation of the microtubules. The microtubules were observed using the aforementioned microscopy system with 0.5-s exposure. The central positions of the DY-647 speckles were determined by 2D Gaussian fitting of the image using Mark2 software (provided by K. Furuta, National Institute of Information and Communications Technology, Kobe, Japan; Furuta and Toyoshima, 2008 ). The SD of the determined position was 10 nm. To measure the compaction of the elongated GDP microtubule, KIF5C was washed out by 0.2-µl/s constant flow of buffer containing 300 mM K-Pipes, 40% (vol/vol) glycerol, 1 mM EGTA, 1 mM ATP, 2 mM MgSO 4 , 2 mM dithiothreitol, 0.2 mg/ml glucose oxidase, 40 µg/ml catalase, 1 mM glucose, and 0.1% Pluronic F-127, pH 7.2, using a Cavro syringe pump (30062929; Tecan). To measure the microtubule depolymerization rate, the solution in the assay chamber was replaced by imaging solution without glycerol, and microtubules were then observed under microscopy. X-ray fiber diffraction 187 µM tubulin dimer was polymerized in polymerization buffer (20 mM Pipes-KOH, 1 mM EGTA, and 2 mM MgSO 4 , pH 6.6) with 2 mM GTP or 0.5 mM GMPCPP and 2 mM MgSO 4 . After incubation at 37°C, 10 mM dithiothreitol, 2 mM ATP, 2 mM MgSO 4 and 1% (wt/vol) methylcellulose (Methocel MC) were added to the microtubule specimen. After centrifugation at 14,000 g for 30 s to remove air bubbles, the specimen was placed in the space between a quartz disc and a ring-shaped coverslip. Microtubules were oriented under shear flow by rotating the quartz disc at 10–16 rotations per second. A synchrotron radiation x-ray beam at BL45XU beamline ( Fujisawa et al., 2000 ) of SPring-8 (Japan Synchrotron Radiation Research Institute) irradiated the oriented microtubules ( Kamimura et al., 2016 ). The diffraction images were recorded with a Pilatus 300K-W detector system (Dectris) with 30-s exposure. KIF5C and 1 mM AMPPNP were added to the space between the disc and the coverslip 20–40 s before taking the images. We used a 4.97-nm signal obtained from lead stearate to calibrate the spacing of diffraction peaks. Images were processed for background subtraction using ImageJ. The tubulin axial periodicity was determined by fitting the intensity of the fourth-diffraction peak with a Lorentzian function. The error bars in Fig. 4 indicate the full width at half maximum (FWHM) of the fitted function.
Sample preparations for the SHG microscopy
Xenopus laevis egg and sperm were gifts from H. Inomata (RIKEN, Hyogo, Japan). Permeabilized Xenopus sperm nuclei ( Desai et al., 1999 ) were immobilized on a surface of a KOH-washed quartz coverslip. Following wash of the surface by 7 mg/ml casein, aster-like microtubule formation was initiated by incubating the nuclei with the M-phase egg extract ( Field et al., 2014 ) for 5 min at 37°C. Excess egg extract was washed out with 500 mM Pipes-KOH, 10 mM MgCl 2 , 5 mM EGTA, and 30% (vol/vol) glycerol, pH 6.9. After exchanging buffer with GPEM50 (50 mM Pipes-KOH, 1 mM EGTA, 2 mM MgSO 4 , and 30% [vol/vol] glycerol, pH 6.7), 15 µM tubulin (including 2% of Alexa Fluor 647–labeled tubulin) with 1 mM GTP and 0.7 mg/ml casein was introduced into the chamber. The chamber was incubated at 37°C for 20 min to polymerize microtubules. Finally, the chamber was washed with GPEM50, and K351 with or without 1 mM AMPPNP was introduced into the chamber. SHG microscopy The SHG data were acquired using a custom-built microscope based on a Nikon TE2000-U ( Fig. 6 B ; Kaneshiro et al., 2018 Preprint ). The sample was illuminated by a mode-locked Ti/sapphire laser (Chameleon Vision II; Coherent, Inc.) with an 810-nm wavelength, 80-MHz repetition rate, and 200-fs pulse duration through a Glan-laser polarizing prism (GL10-B; Thorlabs), high-speed polarization controller (350-160 and 350-80; Conoptics, Inc.), and a 40× dry objective lens (NA 0.95, CFI Apo; Nikon). The emitted light was detected with a photon-counting photomultiplier tube module (H10680-210; Hamamatsu Photonics) through a 100× objective lens (NA 1.45, CFI Apo, oil; Nikon) and filters (FF01-680/SP and FF01-405/10-25; Semrock). The SHG intensity data on the incident polarization angle ( θ ) were fitted with the following theoretical function to obtain three fitting parameters α , χ zzz , and χ zxx : I ( θ ; α , χ z z z , χ z x x ) = [ χ z z z cos 2 ( θ − α ) + χ z x x sin 2 ( θ − α ) ] 2 + [ 2 χ z x x cos ( θ − α ) sin ( θ − α ) ] 2 , where α denotes the angle of average orientation of a microtubule bundle and χ zzz and χ zxx are two components of SHG susceptibility tensor ( Psilodimitrakopoulos et al., 2013 ; Kaneshiro et al., 2018 Preprint ). Grid preparation and cryo-EM data collection The KIF5C motor domain (mouse KIF5C residues 1–345 and a His 7 tag) was purified by immobilized metal affinity chromatography and cation exchange chromatography (AKTA Explorer 10S, RESOURCE S column; GE Healthcare). The purified KIF5C was dialyzed against and concentrated in a buffer (10 mM Hepes-NaOH, pH 7.4, 100 mM NaCl, 1 mM MgCl 2 , and 20% [wt/vol] sucrose), frozen in liquid N 2 , and stored at −80°C. For GDP microtubule complexed with KIF5C (KIF5C–MT(GDP)), tubulin was diluted to 80 µM by PEM buffer (20 mM Pipes-KOH, pH 6.6, 1 mM EGTA, and 2 mM MgSO 4 ), incubated on ice for 5 min in PEM buffer with 1 mM GTP and 1 mM MgSO 4 , and polymerized at 37°C for 30 min. At the end of polymerization, 0.1 mM MgSO 4 , 10 mM DTT, and 0.1 mM ATP for KIF5C(ATP)–MT(GDP) or 0.1 mM AMPPNP for KIF5C(PNP)–MT(GDP) were mixed into the microtubule solution. After 5 min, K351 diluted to 500 µM by a dilution buffer (10 mM Hepes-NaOH, pH 7.4, 50 mM NaCl, and 1 mM MgCl 2 ) was added to microtubule solution to a final 20% molar ratio to tubulin. A 4-µl drop of KIF5C–MT(GDP) (40 µM tubulin) was placed onto a glow-discharging holey carbon grid (R2/2; Quantifoil) and applied in a semiautomated vitrification device (Vitrobot Mark IV; FEI) with 100% humidity at 27°C. After 30 s, a 9-µl drop of 40 µM KIF5C solution containing 5 mM ATP or AMPPNP, or 10 U/ml apyrase for KIF5C(ø)–MT(GDP), was added on a drop of microtubule. After 60 s, the remaining solution on the grid was wicked away with a piece of Whatman no. 1 filter paper and the grid was plunge-frozen into liquid ethane. GMPCPP microtubule complexed with nucleotide-free KIF5C (KIF5C(ø)–MT(GMPCPP)) was prepared as previously described ( Morikawa et al., 2015 ) using the Vitrobot. Data acquisition was performed using a 200-kV field emission cryo-EM (Tecnai Arctica; FEI) at 78,000-fold nominal magnification with an FEI Falcon II direct detection camera under low-dose conditions using the data-acquisition software Serial EM ( Mastronarde, 2005 ). All data were collected as a movie with seven subframes with a total electron dose of 50 e −1 /Å 2 at a pixel size of 1.28 Å/pixel. The defocus range of the dataset was set to −1.5 to −2.5 µm.
Image processing and 3D reconstruction of cryo-EM images
The movie data were processed for motion correction with the software MotionCorr ( Li et al., 2013 ). Motion-corrected and summed images were analyzed its defocus and astigmatism by using CTFFIND3 ( Mindell and Grigorieff, 2003 ) and images without significant drift and astigmatism were used for further analysis. Images of a 14-protofilament KIF5C-MT complex were selected and semiautomatically straightened using the “unbend” program of Ruby-Helix ( Metlagel et al., 2007 ). Segments were extracted at a spacing of 80 Å using a box size of 768 × 768 pixels. The stack file combined by the addtostack command of IMOD ( Kremer et al., 1996 ) was then applied to the seam-search scripts ( Zhang and Nogales, 2015 ). We used EMD-6353, the kinesin-decorated GDP microtubule, as the 3D reference model to precisely separate α-tubulin and β-tubulin ( Zhang et al., 2015 ). Local refinement was performed twice using Frealign version 9 ( Grigorieff, 2007 ), followed by determination of seam position. Using refined alignment particles with the correct seam, 3D structures were reconstructed assuming pseudohelical symmetry (HP) and no symmetry (C1). The helical parameters for three-start tubulin monomers (twist and rise) were measured using the Relion helix toolbox program ( Scheres, 2012 ) from the C1 reconstruction and applied to the next HP reconstruction. Two rounds of seam search were performed to obtain the final reconstruction. The resolution was analyzed by Fourier shell correlation ( Van Heel, 1987 ). Local resolutions were estimated with ResMap program ( Kucukelbir et al., 2014 ). A negative B-factor (−120 and −200) was applied to sharpen the final map using Bfactor program (included with the FREALIGN distribution; Grigorieff, 2016 ).
Atomic model fitting
For microtubules, the atomic structure of tubulin (Protein Data Bank accession no. 3J6F ; Alushin et al., 2014 ) was fitted rigidly by monomer into the cryo-EM densities using the Fit in Map tool in UCSF Chimera ( Pettersen et al., 2004 ; KIF5C(PNP)–MT(GDP): ccc = 0.96, KIF5C(ø)–MT(GDP): ccc = 0.96, KIF5C(ATP)–MT(GDP): ccc = 0.95, KIF5C(ø)–MT(GMPCPP): ccc = 0.94). For KIF5C, the atomic structures of the KIF5 motor domain (Protein Data Bank accession nos. 4HNA [ATP form] and 4LNU [nucleotide-free form]; Gigant et al., 2013 ; Cao et al., 2014 ) were rigid-body fitted (KIF5C(PNP)–MT(GDP): ccc = 0.92 [ 4HNA ]; KIF5C(ø)–MT(GDP): ccc = 0.94 [ 4LNU ]). Accession numbers Cryo-EM maps and the fitted atomic coordinates have been deposited in the Electron Microscopy Data Bank and Protein Data Bank under the accession codes EMD-6779 and 5XXT (KIF5C(ø)–MT(GDP)), EMD-6781 and 5XXV (KIF5C(PNP)–MT(GDP)), EMD-6782 and 5XXW (KIF5C(ATP)–MT(GDP)), and EMD-6783 and 5XXX (KIF5C(ø)–MT(GMPCPP)), respectively. Online supplemental material Fig. S1 shows the stochastic and transient asymmetric distribution of kinesin in nonneuronal cells. Fig. S2 shows hyperstabilization of GDP microtubules by KIF5C. Fig. S3 shows compaction of the elongated GDP microtubule after kinesin removal. Fig. S4 shows resolution and statistics for the cryo-EM reconstructions. Fig. S5 shows the position of the elements of a kinesin–microtubule surface.
Table
S1 lists numbers of samples and events for Fig. 1 (G–L) .
Table
S2 lists statistics for the mixed Gaussian fitting in Fig. 1 (G–I) .
Table
S3 lists multiple comparison statistics by Steel–Dwass test.
Table
S4 lists numbers of microtubules and kinesin molecules for Fig. 2 .
Table
S5 shows statistics for the mixed Gaussian fitting in Fig. 2 B .
Table
S6 shows statistics for the mixed Gaussian fitting in Fig. 2 D . Video 1 shows KIF5C dimer molecules (magenta) moving along GDP and GMPCPP microtubules (green). Video 2 shows depolymerization kinetics of GDP microtubules in the presence of KIF5C monomer (K351). Video 3 shows a comparison of the microtubule lattices between KIF5C(PNP)–MT(GDP) and KIF5C(ø)–MT(GDP). Video 4 shows a comparison of the microtubule lattices between KIF5C(PNP)–MT(GDP) and KIF5C(ATP)–MT(GDP). Video 5 shows a comparison of the microtubule lattices between KIF5C(PNP)–MT(GDP) and KIF5C(ø)–MT(GMPCPP).
Online supplemental material Fig. S1 shows the stochastic and transient asymmetric distribution of kinesin in nonneuronal cells. Fig. S2 shows hyperstabilization of GDP microtubules by KIF5C. Fig. S3 shows compaction of the elongated GDP microtubule after kinesin removal. Fig. S4 shows resolution and statistics for the cryo-EM reconstructions. Fig. S5 shows the position of the elements of a kinesin–microtubule surface.
Table
S1 lists numbers of samples and events for Fig. 1 (G–L) .
Table
S2 lists statistics for the mixed Gaussian fitting in Fig. 1 (G–I) .
Table
S3 lists multiple comparison statistics by Steel–Dwass test.
Table
S4 lists numbers of microtubules and kinesin molecules for Fig. 2 .
Table
S5 shows statistics for the mixed Gaussian fitting in Fig. 2 B .
Table
S6 shows statistics for the mixed Gaussian fitting in Fig. 2 D . Video 1 shows KIF5C dimer molecules (magenta) moving along GDP and GMPCPP microtubules (green). Video 2 shows depolymerization kinetics of GDP microtubules in the presence of KIF5C monomer (K351). Video 3 shows a comparison of the microtubule lattices between KIF5C(PNP)–MT(GDP) and KIF5C(ø)–MT(GDP). Video 4 shows a comparison of the microtubule lattices between KIF5C(PNP)–MT(GDP) and KIF5C(ATP)–MT(GDP). Video 5 shows a comparison of the microtubule lattices between KIF5C(PNP)–MT(GDP) and KIF5C(ø)–MT(GMPCPP).
Supplementary Material Supplemental Materials (PDF) Video 1 Video 2 Video 3 Video 4
📊 Figures
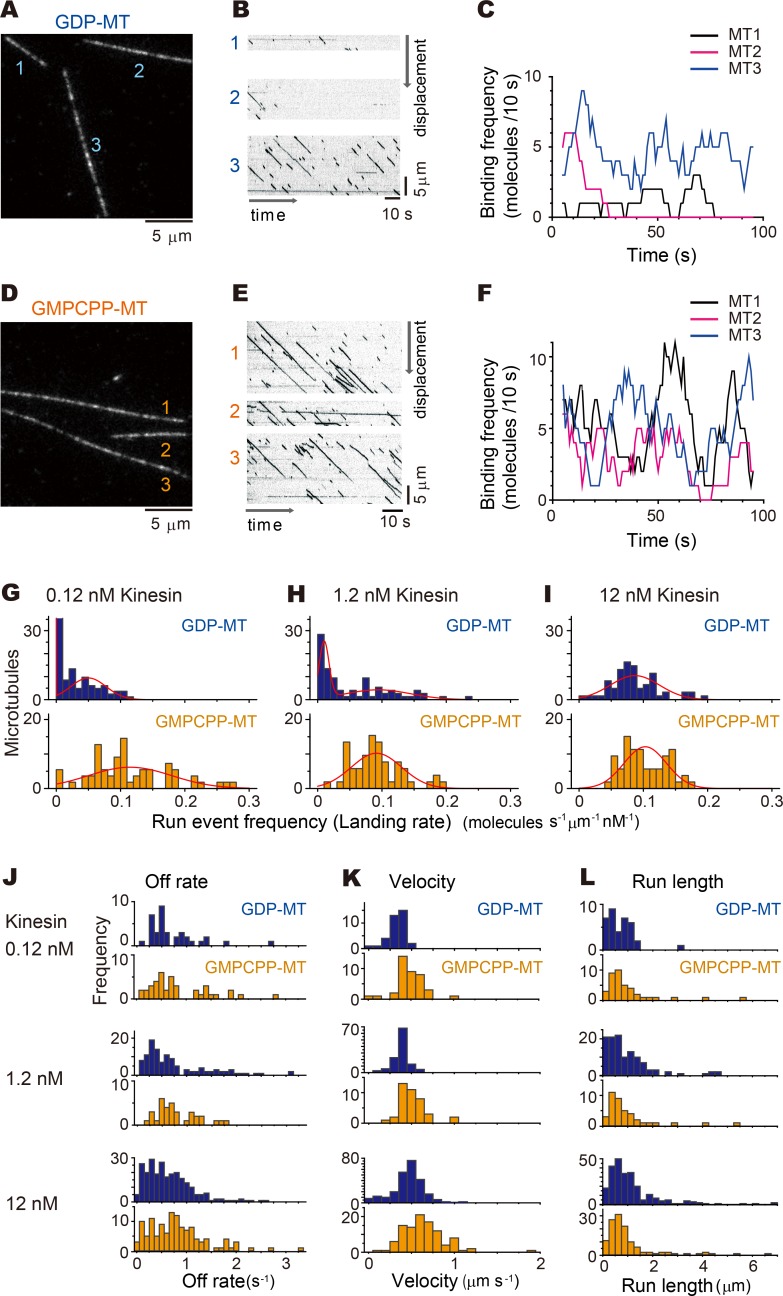
Figure 1.
Biased use of a subset of GDP microtubules in vitro. (Au2013F) GDP microtubules (GDP-MT; Au2013C) or GMPCPP microtubules (GMPCPP-MT; Du2013F) were anchored by sparsely (three or four sites per microme...
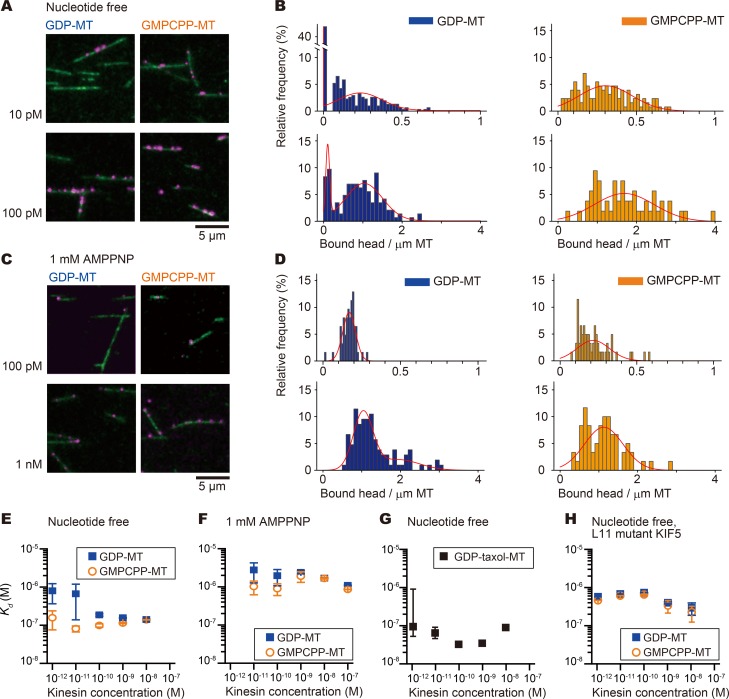
Figure 2.
Cooperative binding of KIF5C to GDP microtubules. (Au2013D) The binding affinity of the KIF5C motor domain (monomer) to GDP or GMPCPP microtubules (MTs) was examined using single-molecule assays in th...
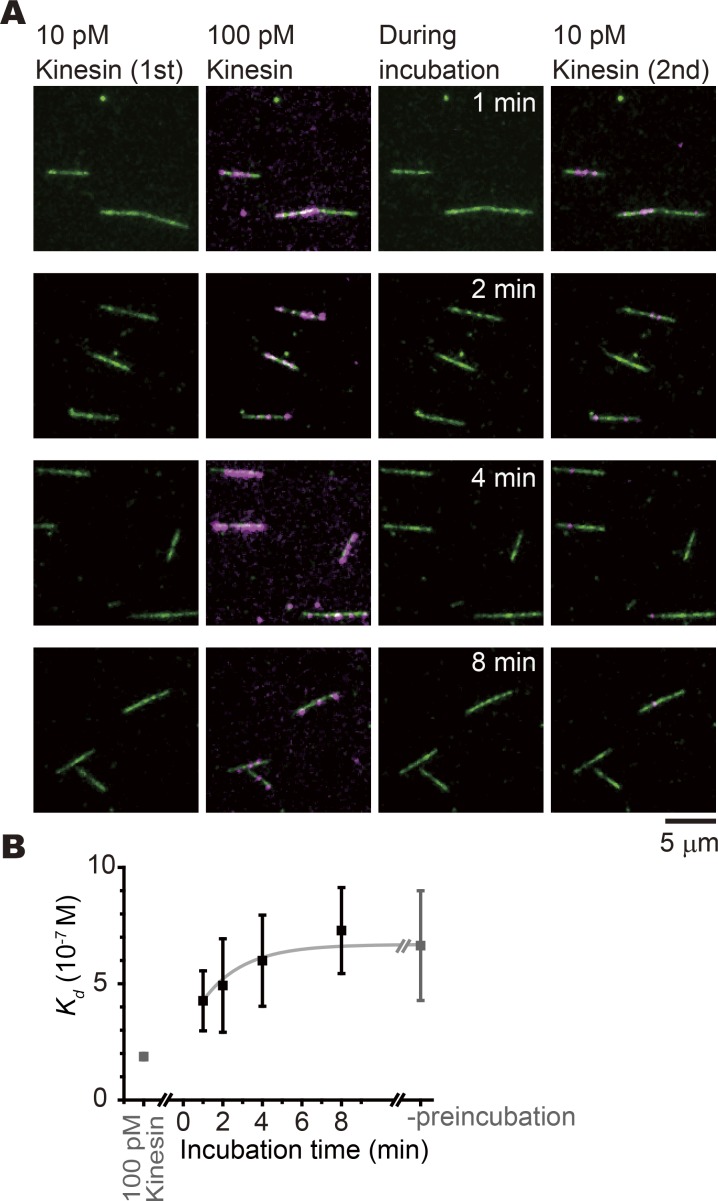
Figure 3.
Transient increase of binding affinity of GDP microtubules by pretreatment with KIF5C. (A) Images of the KIF5C (magenta) motor domain and GDP microtubules (green) in each step of the experiment. First...
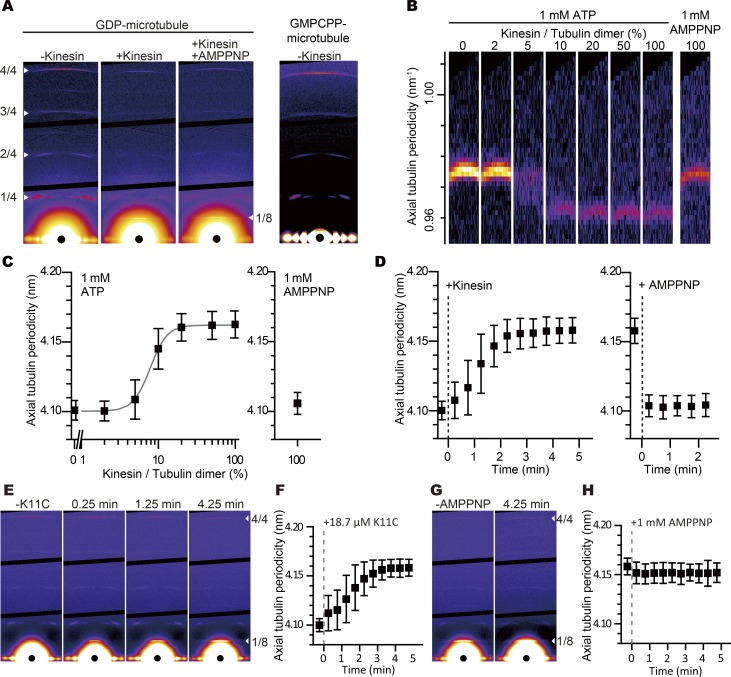
Figure 4.
Elongation of the axial pitch of GDP microtubule measured by x-ray fiber diffraction. (A) X-ray fiber diffraction patterns of GDP microtubules (94 u00b5M) without KIF5C, with 94 u00b5M KIF5C, and with...
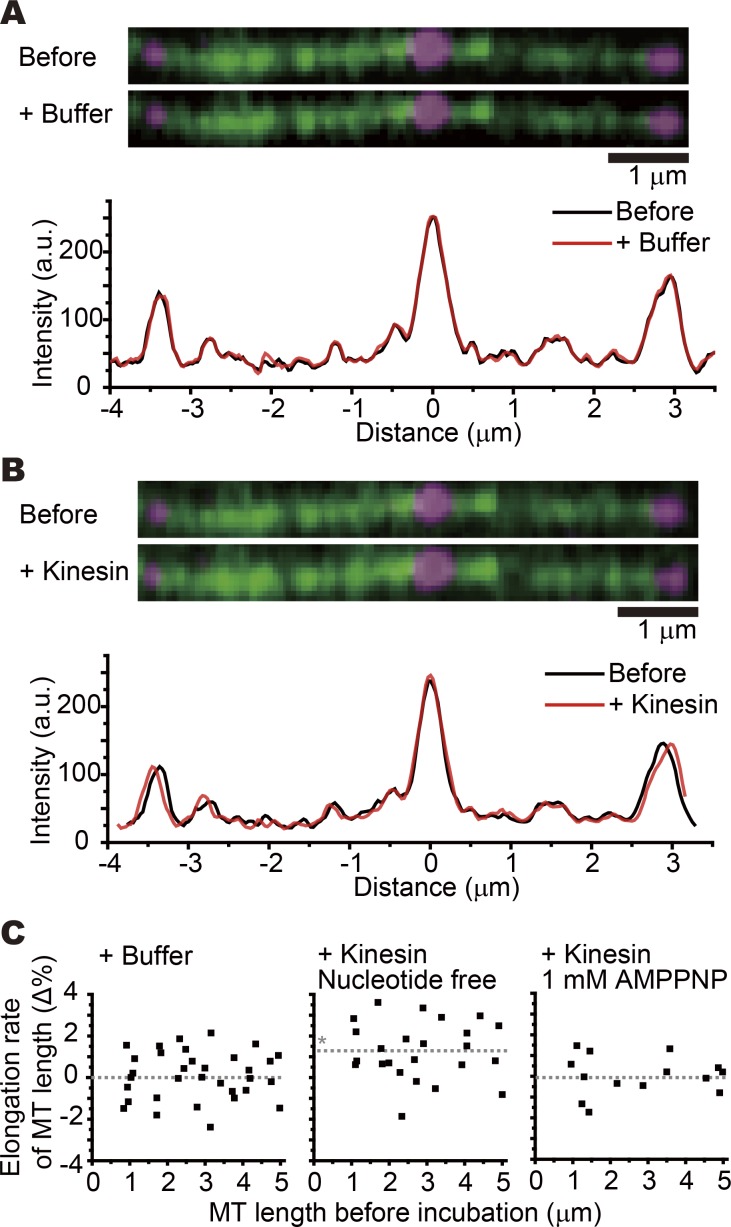
Figure 5.
Single-molecule measurement of the axial elongation of microtubules. Fluorescent speckle microscopy of GDP microtubules showed that KIF5C elongates the microtubule length. Tetramethylrhodamine-labeled...
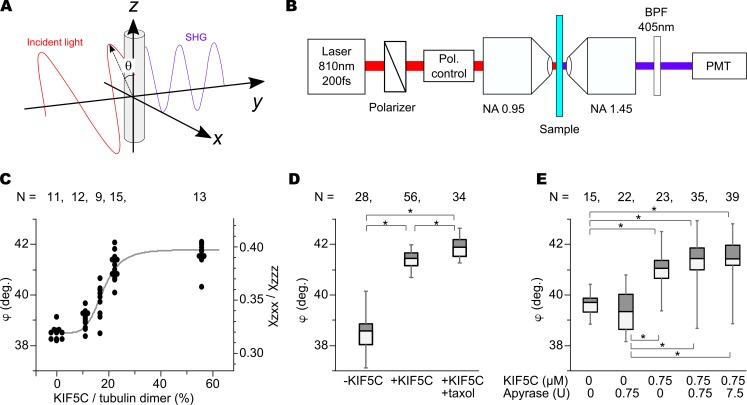
Figure 6.
Microtubule conformational changes examined with SHG. (A) Principle of the measurement. Incident polarization u03b8 dependence of SHG signal reflects the orientation of tubulin subunits in the microtu...
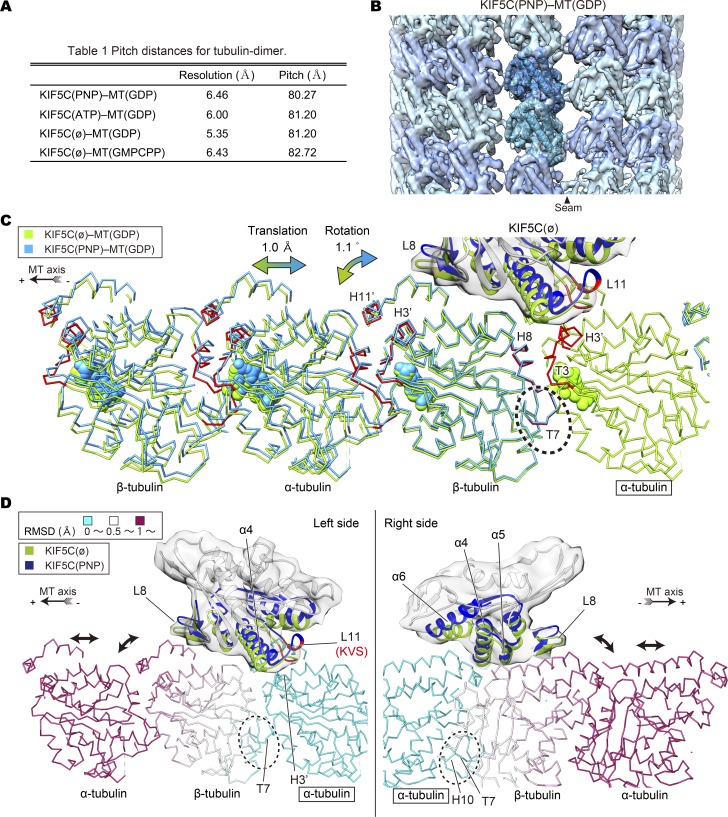
Figure 7.
Microtubule conformational changes examined with cryo-EM. (A) The estimated resolutions according to the Fourier shell correlation 0.143 criteria, and pitch distances for tubulin dimer calculated from...

Figure 8.
Conformational changes among KIF5Cu2013microtubule complexes. (Au2013D) Comparisons of positions of the tubulin monomers superimposed at u03b1-tubulin on the right end. The translation vectors between...
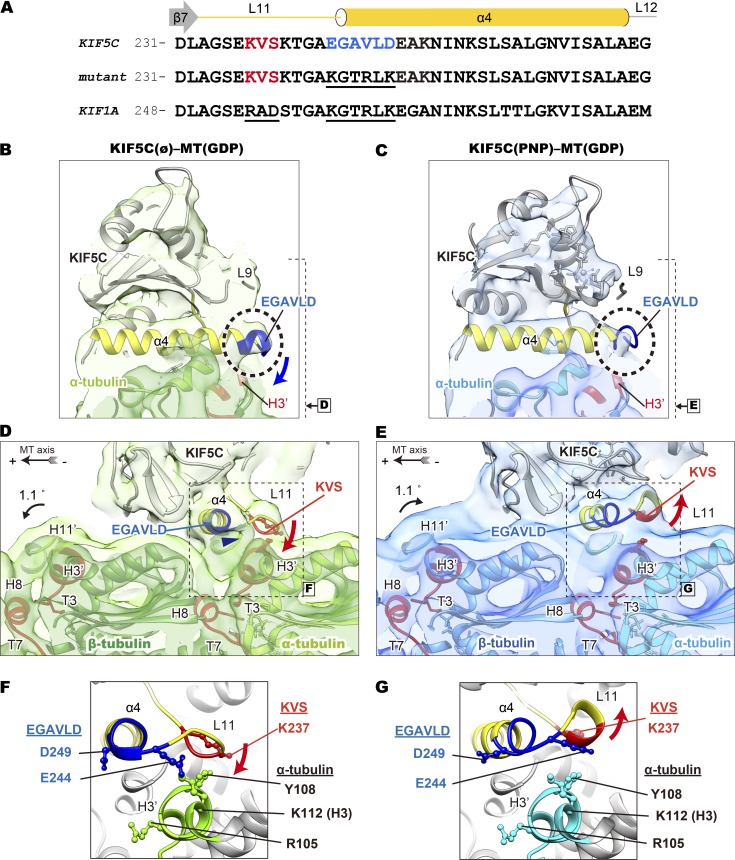
Figure 9.
Ability of the L11-u03b14 junction to discriminate microtubules examined with cryo-EM. (A) Sequence alignment of L11 and u03b14 region in KIF5C, the L11-u03b14 junction mutant, and KIF1A. (Bu2013E) Co...
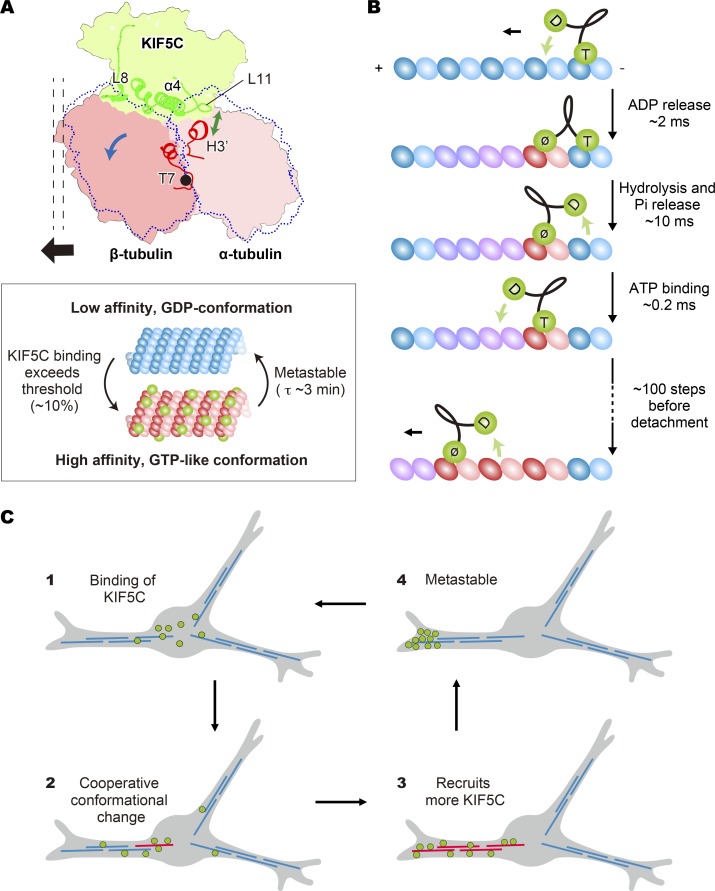
Figure 10.
Schematic representation of the model. (A) Summary of the results. The binding of KIF5C to u03b2-tubulin will push this subunit to rotate around the T7 loop, leading to the elongation of the axial pit...
Figure images are served from the NIH/NLM PubMed Central Open Access Subset or Europe PMC; copyright remains with the publishers and authors.
💬 Discussion
0 commentsNo comments yet. Be the first to start a discussion!
Leave a Comment