Abstract
Dynamic processes are ubiquitous and essential in living cells. To properly understand these processes, it is imperative to measure them in a time-dependent way and analyze the resulting data quantitatively, preferably with automated tools. Kymographs are single images that represent the motion of dynamic processes and are widely used in live-cell imaging. Although they contain the full range of dynamics, it is not straightforward to extract this quantitative information in a reliable way. Here we present two complementary, publicly available software tools, KymographClear and KymographDirect, that have the power to reveal detailed insight in dynamic processes. KymographClear is a macro toolset for ImageJ to generate kymographs that provides automatic color coding of the different directions of movement. KymographDirect is a stand-alone tool to extract quantitative information from kymographs obtained from a wide range of dynamic processes in an automated way, with high accuracy and reliability. We discuss the concepts behind these software tools, validate them using simulated data, and test them on experimental data. We show that these tools can be used to extract motility parameters from a diverse set of cell-biological experiments in an automated and user-friendly way.
🔬 Techniques
🔭 Microscopes
🧬 Organisms
💻 Software
✨ Fluorophores
🧪 Sample Preparation
🔬 Cell Lines
🏭 Microscope Brands
🧪 Reagent Suppliers
📷 Detectors
💻 Software Details
🏛️ Research Organizations (ROR)
Affiliated research institutions:
📋 Methods
Experimental data: proteins diffusing and translocating along extended DNA. Next we apply KymographDirect to experimental data of single proteins moving along DNA extended with optical tweezers in vitro: the Plk1-interacting checkpoint helicase (PICH; Biebricher et al. , 2013 ), which translocates along the DNA, regularly switching direction, and mitochondrial transcription factor A (TFAM; Heller et al. , 2013 ), which diffuses ( Figure 4, A and B ). In both cases, the relatively low SNR kymographs are treated in KymographDirect in the diffusive data mode. Trajectories are successfully detected ( Figure 4, A and B ), allowing further analysis. Figure 4C shows the instantaneous velocities in the PICH trajectories and their distributions, clearly indicating the switches of direction. Velocities obtained with KymographDirect are similar to the velocity reported in the original article as obtained from single-particle tracking analysis (Figure 3D of Biebricher et al. , 2013 ); note that the original article took into account only motile events, whereas here we do not discriminate static and motile events. For TFAM, the mean square displacement of proteins was calculated ( Figure 4D ), which allows for the determination of the distribution of diffusion constants. The distribution obtained with KymographDirect is very similar to the distribution presented in the original article, which was obtained by Gaussian fitting of the fluorescent spots (Figure 6D of Heller et al. , 2013 ). These analyses of data from single protein complexes moving along DNA highlight the capabilities of KymographDirect to track complex motility data with low SNR on the single-molecule level with an accuracy comparable to single-particle tracking analysis of the data. FIGURE 4: Translocation of PICH and diffusion of TFAM on stretched DNA. Analysis of experimental data. (A) Kymograph of PICH protein translocation on DNA under tension (from Biebricher et al. , 2013 ) overlaid with the trajectories found with KymographDirect ; scale bars, 2 μm (horizontal bar), 100 s (vertical). (B) Kymograph of TFAM protein diffusion on DNA under tension (from Heller et al. , 2013 ) overlaid with the trajectories found with KymographDirect ; scale bars, 1 μm (horizontal), 100 ms (vertical). (C) Left, velocities deduced from the trajectories found in A. Right, velocity absolute value distribution; each time point of each trajectory contributes to one count in this distribution. (D) Distribution of diffusion coefficients obtained from the trajectories found in B. The diffusion coefficients were obtained from a linear fit of the first 14 time lags of the MSD calculated by KymographDirect .
Show full methods section
Experimental data: proteins diffusing and translocating along extended DNA. Next we apply KymographDirect to experimental data of single proteins moving along DNA extended with optical tweezers in vitro: the Plk1-interacting checkpoint helicase (PICH; Biebricher et al. , 2013 ), which translocates along the DNA, regularly switching direction, and mitochondrial transcription factor A (TFAM; Heller et al. , 2013 ), which diffuses ( Figure 4, A and B ). In both cases, the relatively low SNR kymographs are treated in KymographDirect in the diffusive data mode. Trajectories are successfully detected ( Figure 4, A and B ), allowing further analysis. Figure 4C shows the instantaneous velocities in the PICH trajectories and their distributions, clearly indicating the switches of direction. Velocities obtained with KymographDirect are similar to the velocity reported in the original article as obtained from single-particle tracking analysis (Figure 3D of Biebricher et al. , 2013 ); note that the original article took into account only motile events, whereas here we do not discriminate static and motile events. For TFAM, the mean square displacement of proteins was calculated ( Figure 4D ), which allows for the determination of the distribution of diffusion constants. The distribution obtained with KymographDirect is very similar to the distribution presented in the original article, which was obtained by Gaussian fitting of the fluorescent spots (Figure 6D of Heller et al. , 2013 ). These analyses of data from single protein complexes moving along DNA highlight the capabilities of KymographDirect to track complex motility data with low SNR on the single-molecule level with an accuracy comparable to single-particle tracking analysis of the data. FIGURE 4: Translocation of PICH and diffusion of TFAM on stretched DNA. Analysis of experimental data. (A) Kymograph of PICH protein translocation on DNA under tension (from Biebricher et al. , 2013 ) overlaid with the trajectories found with KymographDirect ; scale bars, 2 μm (horizontal bar), 100 s (vertical). (B) Kymograph of TFAM protein diffusion on DNA under tension (from Heller et al. , 2013 ) overlaid with the trajectories found with KymographDirect ; scale bars, 1 μm (horizontal), 100 ms (vertical). (C) Left, velocities deduced from the trajectories found in A. Right, velocity absolute value distribution; each time point of each trajectory contributes to one count in this distribution. (D) Distribution of diffusion coefficients obtained from the trajectories found in B. The diffusion coefficients were obtained from a linear fit of the first 14 time lags of the MSD calculated by KymographDirect .
Experimental data: in vitro microtubule dynamics. We next test KymographDirect on experimental data of microtubule dynamics in vitro, which can grow and shrink in bursts ( Gardner et al. , 2011 ; Zanic et al. , 2013 ). We generated kymographs from an image sequence (a kind gift of the Zanic lab) using KymographClear and extracted the trajectory of the microtubule tips using the edge-detection mode of KymographDirect ( Figure 6A ). KymographDirect allows extraction of mobility parameters, such as the instantaneous growth rate, which can be represented in a histogram ( Figure 6B ), allowing the user to extract a distribution of growth rates and not only the average. FIGURE 6: In vitro microtubule dynamics. (A) Kymograph generated from one microtubule of the image sequence overlaid with the trajectory of the growing edge (plus end) found by KymographDirect (red). Note that the other edge (minus end) of the microtubule can be extracted, but it was discarded for simplicity. Scale bars, 2 μm (horizontal), 60 s (vertical). (B) Distribution of instantaneous growth rates obtained from nine microtubules in the image sequence. Another tool has been used to analyze microtubule dynamics on basis of kymographs ( Smal et al. , 2010 ). This tool segments growth phases into monotonic growth phases, which is helpful to obtain the average microtubule growth rate but not ideal to capture the complex dynamics of microtubule growth, which are characterized by large variations in growth rate ( Figure 6 ). Other tools use filament tracking and can extract both filament direction and the extremities of the filament. One such tool is FIESTA ( Ruhnow et al. , 2011 ), which we tested on the experimental data of in vitro growing microtubules. In our test, FIESTA could detect position and extremities of only part of the microtubules: four of nine could be tracked over the entire image sequence, two were only tracked during half of the sequence, and three were not detected at all. KymographDirect , on the other hand, extracted all positions of all microtubules. Both programs extracted similar distributions of microtubule growth rates ( Figure 6B and Supplemental Figure S8), with an average growth rate of 0.53 ± 0.13 μm/min (10 μM tubulin at saturating GTP condition), similar to values reported in the literature ( Zanic et al. , 2013 ). Use of FIESTA could be advantageous when the orientation of the microtubules changes over the image sequence, something that is more difficult to analyze with kymographs. For other data, KymographDirect appears to be more robust. This analysis of microtubule data demonstrate that KymographDirect can be used to extract quantitative motility parameters from kymographs of moving edges, including cytoskeletal polymers and edges of a cell.
Experimental data: C. elegans intraflagellar transport dynamics. To test KymographDirect on complex bidirectional experimental data, we applied it to fluorescence image sequences of intraflagellar transport (IFT) in living C. elegans . IFT is required for the building and maintenance of chemosensory cilia and depends on the active transport of protein complexes by motor proteins ( Snow et al. , 2004 ; Ou et al. , 2005 ; Hao et al. , 2011 ; Prevo et al. , 2015 ). Kymographs obtained from image sequences of IFT in living C. elegans often suffer from poor contrast, complicating analysis and quantification of motility parameters. KymographDirect is very well suited to analyze this kind of data and extract parameters such as position-dependent velocities and intensities. We recorded the motion of enhanced green fluorescent protein (EGFP)–labeled OSM-3 kinesin in the phasmid cilia of C. elegans using laser-illuminated epifluorescence microscopy ( Figure 9A and Supplemental Movie S1). KymographClear was used to generate a kymograph ( Figure 9B ) from this image sequence. Forward-moving, backward-moving, and static components can be clearly discriminated using Fourier filtering ( Figure 9C ). KymographDirect was next used to extract trajectories of groups of OSM-3 kinesins moving together ( Figure 9D ). The SNR (defined as the ratio between the average intensity along a trajectory and the SD of the background), ranges between 2 (for the dimmest trajectories) and 8 (for the brightest). Most trajectories that can be seen in the kymograph are automatically extracted by KymographDirect within 1 s, yielding 64 trajectories. From these trajectories, KymographDirect can determine velocity and intensity ( Figure 9, E and G ) and perform statistical analysis. Shown here are position-dependent, trajectory-averaged velocities and intensities, including their SDs ( Figure 9, F and H ). It is important to note that the algorithm is successful in tracking particles in these data, even though trajectories frequently cross. Furthermore, KymographDirect allows extraction of position-dependent velocities of IFT-components, providing important additional insights into the transport mechanism ( Prevo et al. , 2015 ). FIGURE 9: Application of KymographClear and KymographDirect to experimental fluorescence image sequences representing EGFP-tagged OSM-3 kinesin dynamics in phasmid cilia of living C. elegans . (A) Top, time-averaged image of the image sequence (Supplemental Movie S1). The structure observed is the overlap of two phasmid cilia. Bottom, same as top, with a user-defined nonlinear track overlaid, which is used to generate a kymograph (B). Scale bars, 1 μm. (B–D) Kymographs generated from the data in A and Supplemental Movie S1. Scale bars, 1 μm (horizontal), 2 s (vertical). (B) Raw kymograph. (C) Kymograph Fourier-filtered for motion in the forward direction (red) and backward (green) directions and for static particles (blue). (D) Kymograph of forward-moving groups of OSM-3 kinesins (red) with trajectories extracted by KymographDirect overlaid (64, gray). (E–H) Results of automated kymograph analysis. (E) Position-dependent velocities of six of the trajectories extracted. (F) Average (solid line) and SD (dashed line) of the position-dependent velocities obtained from all 64 trajectories. (G, H) Same as E and F, for intensities of trajectories.
Experimental data: axonal transport in primary neurons. Axonal transport of vesicles exhibits very rich dynamics, with frequent changes of direction and pauses. To test whether our tools can accurately extract trajectories displaying such changeability and complexity, we use an image sequence published by Moughamian and Holzbaur (2012 ; top sequence of their Supplemental Movie S2, scrambled case). In these data, LAMP1-RFP is used to monitor lysosome dynamics. We generated a kymograph and color-coded static and forward- and backward-moving motion components with KymographClear ( Figure 10, A and B ). We analyzed the different components separately and determined the corresponding trajectories ( Figure 10C ). The diffusive component of motion is very well captured, as are the majority of the directional trajectories. Note that for this type of data, the range of intensities is very large (in this example, brightest and dimmest trajectories differ 30-fold in intensity) and the intensity of the dimmest trajectories is close to the background. Under such demanding conditions, the algorithm can identify some trajectories that are actually noise. KymographDirect allows straightforward deletion of such undesired trajectories by the user. In addition, KymographDirect allows manual linking of the trajectories that arise from the three different motion components obtained using Fourier filtering. In this way, linked trajectories can be obtained that contain the full extent of dynamics. Overall ∼90% of trajectories are extracted, with most missed trajectories being low-intensity ones. In axonal transport, it is of particular interest to determine the fraction of time during which particles are taking part in active transport ( Moughamian and Holzbaur, 2012 ); in KymographDirect , this can computed using the velocities and intensities extracted from the trajectories ( Figure 10D ). Applying a velocity threshold of ±0.15 μm/s, we find that 22 and 16% of the time points in the extracted trajectories correspond to anterograde and retrograde motion, respectively, whereas in 62%, no motion is detected, in agreement with the analysis in the original study ( Moughamian and Holzbaur, 2012 ). Using KymographDirect , these fractions can be further analyzed taking into account the intensity information, that is, the quantity of proteins involved. We find that, averaged over time, 72% of proteins are nonmotile, whereas 16.5 and 11.5% move in anterograde and retrograde directions, respectively. This quantification is in agreement with the more intense appearance of the nonmotile trajectories in the kymograph. FIGURE 10: Experimental data from axonal transport in primary neurons. (A) Kymograph generated from the top sequence of Movie S2 of Moughamian and Holzbaur (2012) . (B) Same kymograph as A, Fourier-filtered for motion in the forward direction (red) and backward (green) directions and for pausing and diffusing particles (blue). (C) Kymograph A overlaid with trajectories obtained with KymographDirect (red). Some trajectories coming from different components of motion have been linked together by the subprogram Link of KymographDirect to obtain the trajectories presented. Scale bars, 5 μm (horizontal), 10 s (vertical). (D) Intensity of extracted trajectories as a function of their velocity; these quantities are obtained from KymographDirect analysis. Each dot corresponds to a single time point of a given trajectory. These analyses demonstrate that KymographDirect can identify single-particle trajectories in kymographs of complex transport processes in vivo to accurately extract quantitative motility parameters. In our view, tools like these are essential to unravel the complex dynamics of intracellular transport in vivo.
MATERIALS AND METHODS Generation and analysis of simulated data
Simulated kymographs were generated with custom programs written in LabVIEW (National Instruments, Austin, TX). First, particle tracks were calculated, using random-number generation for stepping or acceleration (in case stochasticity needed to be introduced). Next the particle intensity was simulated, assuming a Poisson distribution for photon emission. The resulting image was then convoluted with a 1D Gaussian function along the position axis to mimic the effect of the finite resolution of the microscope (the full-width at half-maximum corresponded to 2 pixels). Finally, Poisson noise was added to the image to mimic typical camera noise and vary SNR. In the analysis of simulated data, we used the setting “noise reduction” in KymographDirect , which is accessible in all modes of analysis (Supplementary Information). We found that this mode gives the most precise and reliable results. Custom-written programs were used to validate KymographDirect . The fraction of trajectories identified by the program (the “coverage”) corresponds to the fraction of time points extracted from simulated trajectories of diffusive particles ( Figures 2 and 4 ) and to the fraction of locations extracted from simulated trajectories of or particles with directed motion ( Figures 7 and 8 ).
C. elegans imaging
Microscopy images were acquired using a custom-built epi-illuminated wide-field fluorescence microscope operated by a MicroManager software interface (μManager, MicroManager 1.4, www.micromanager.org ; Edelstein et al. 2014 ) and built around an inverted microscope body (Eclipse Ti; Nikon, Amsterdam, Netherlands) fitted with a 60× water-immersion objective (CFI Plan Apo IR 60× water immersion, numerical aperture 1.27; Nikon). Excitation light was provided by a diode-pumped solid-state laser (Calypso 50, 491 nm; Cobolt, Solna, Sweden). Images were captured with an electron-multiplying charge-coupled device camera (iXon 897; Andor, Belfast, UK). One camera pixel corresponded to 92 nm × 92 nm in the image plane. The C. elegans strain expressing EGFP-tagged OSM-3 kinesin motor proteins ( Snow et al. 2004 ) was a kind gift of Jonathan M. Scholey (University of California, Davis, Davis, CA).
Fluorescence imaging in living
C. elegans was performed by anesthetizing adult worms (maintained at 20°C) in M9 containing 5 mM levamisole (tetramisole hydrochloride, L9756; Sigma-Aldrich, St. Louis, MO) and immobilizing them between a 2% agarose pad and a coverslip. Samples were imaged at room temperature (21°C) at 152 ms/frame.
📊 Figures
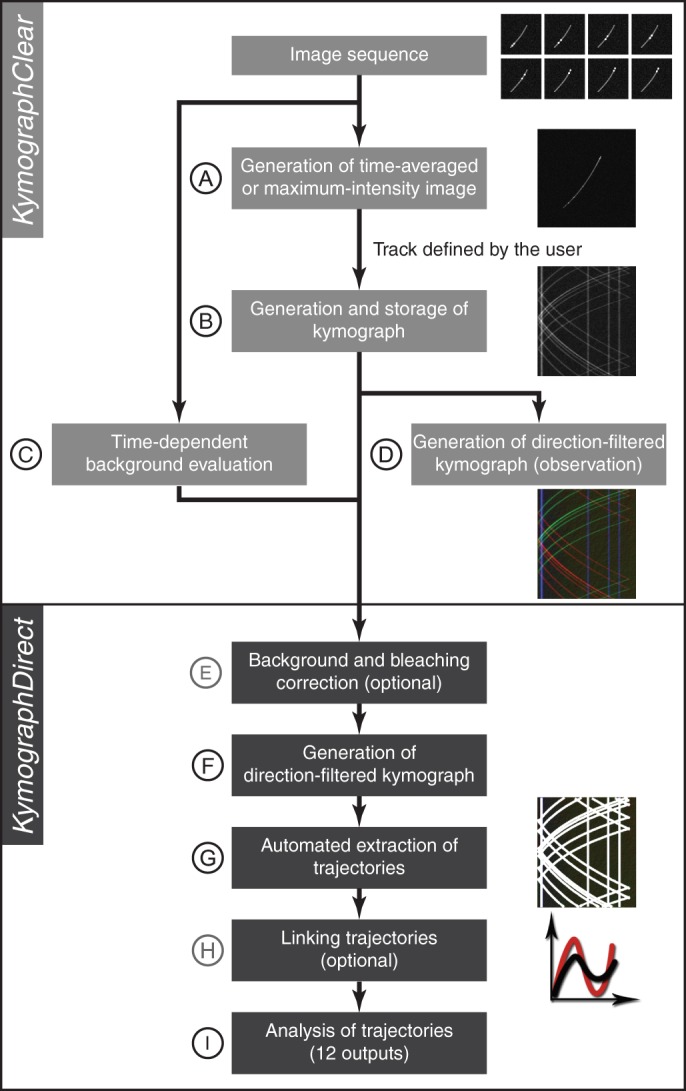
FIGURE 1:
Schematic representation of the workflow of image-sequence analysis using KymographClear (Au2013D) and KymographDirect (Eu2013I). (A) Loading of an image stack and computation of averaged- or maximum-...
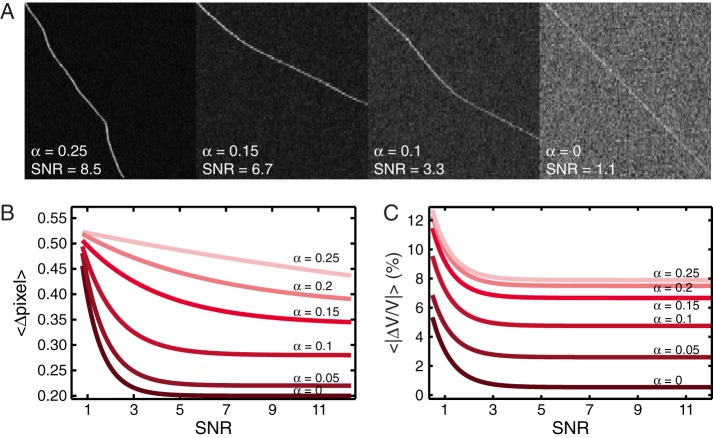
FIGURE 2:
Validation of the kymograph-analysis tools using simulated data mimicking single-particle trajectories. (A) Examples of kymographs generated with stochastic acceleration with a spread u03b1 ranging fr...
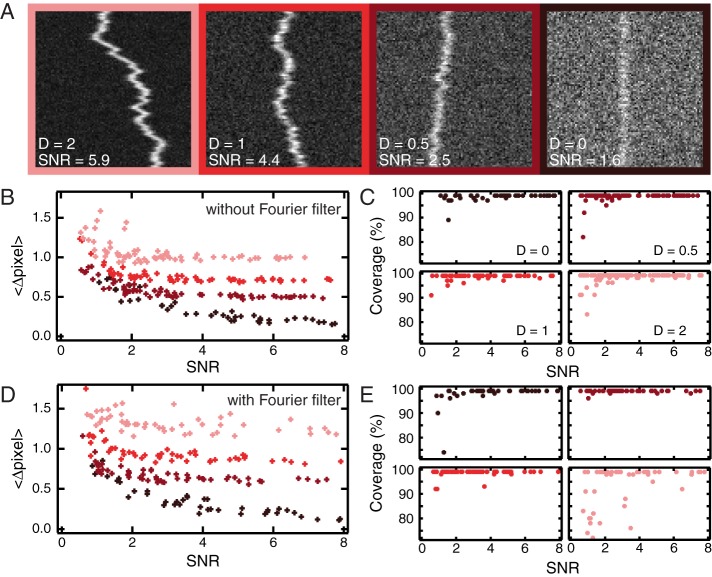
FIGURE 3:
Validation of the kymograph-analysis tools on simulated data mimicking single diffusing particle trajectories. (A) Examples of kymographs generated with diffusion coefficient D from 0 to 2 pixel 2 /fr...
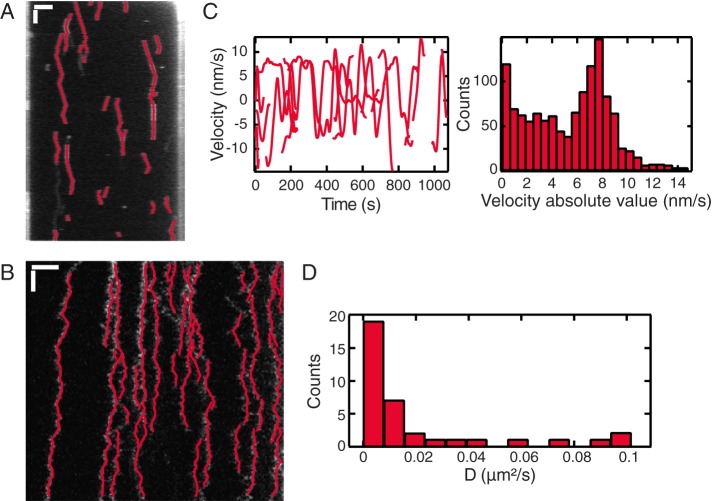
FIGURE 4:
Translocation of PICH and diffusion of TFAM on stretched DNA. Analysis of experimental data. (A) Kymograph of PICH protein translocation on DNA under tension (from Biebricher etu00a0al. , 2013 ) overl...
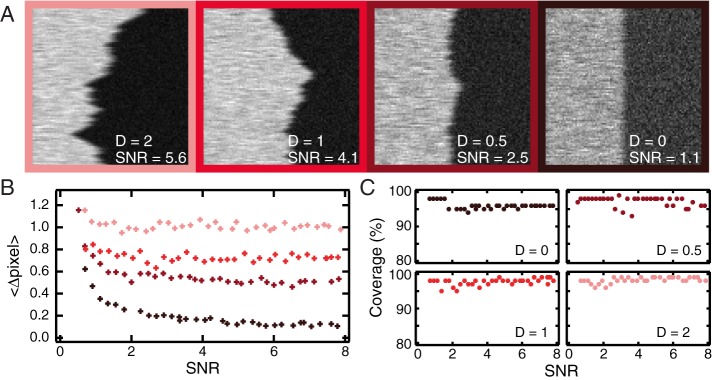
FIGURE 5:
Validation of the kymograph-analysis tools on simulated data mimicking single diffusing edge trajectories. (A) Examples of kymograph generated with diffusion coefficient D ranging from 0 to 2 pixel 2 ...
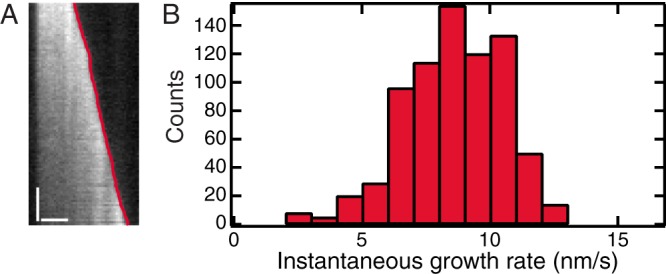
FIGURE 6:
In vitro microtubule dynamics. (A) Kymograph generated from one microtubule of the image sequence overlaid with the trajectory of the growing edge (plus end) found by KymographDirect (red). Note that ...
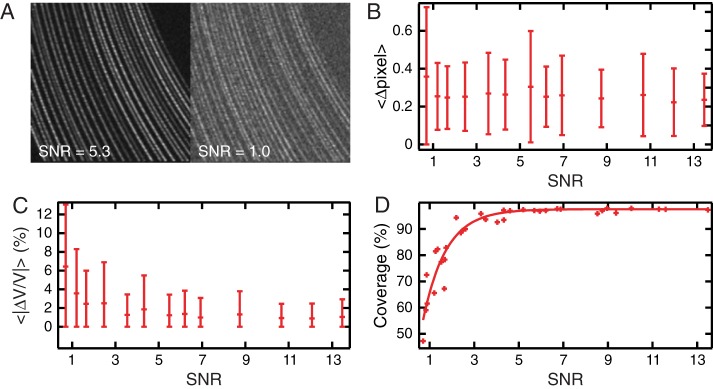
FIGURE 7:
Validation of the software for crowded particles. (A) Examples of kymographs obtained from simulations of multiple particles accelerating simultaneously, generated with different SNRs. (B) Average dis...
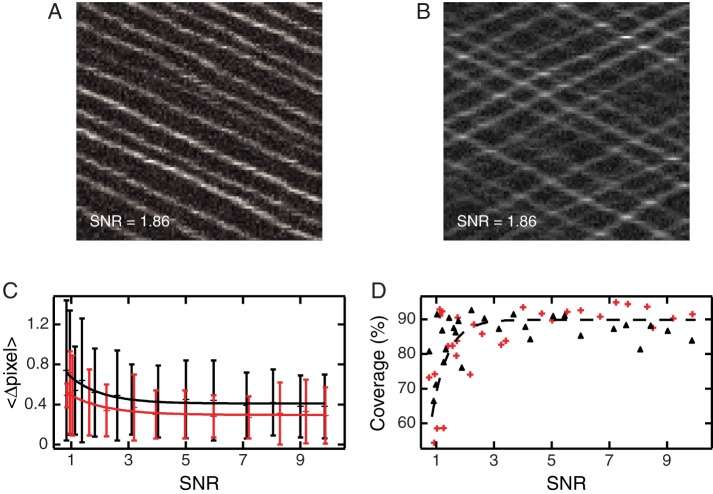
FIGURE 8:
Validation of the kymograph software using simulated data representing particles moving in opposite directions. (A) Example of a simulated kymograph containing crossing points due to particles moving ...
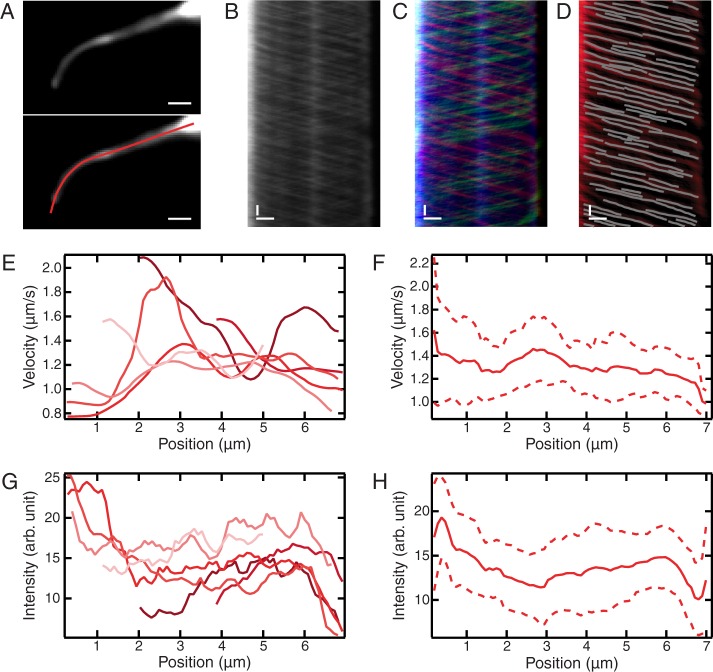
FIGURE 9:
Application of KymographClear and KymographDirect to experimental fluorescence image sequences representing EGFP-tagged OSM-3 kinesin dynamics in phasmid cilia of living C. elegans . (A) Top, time-ave...
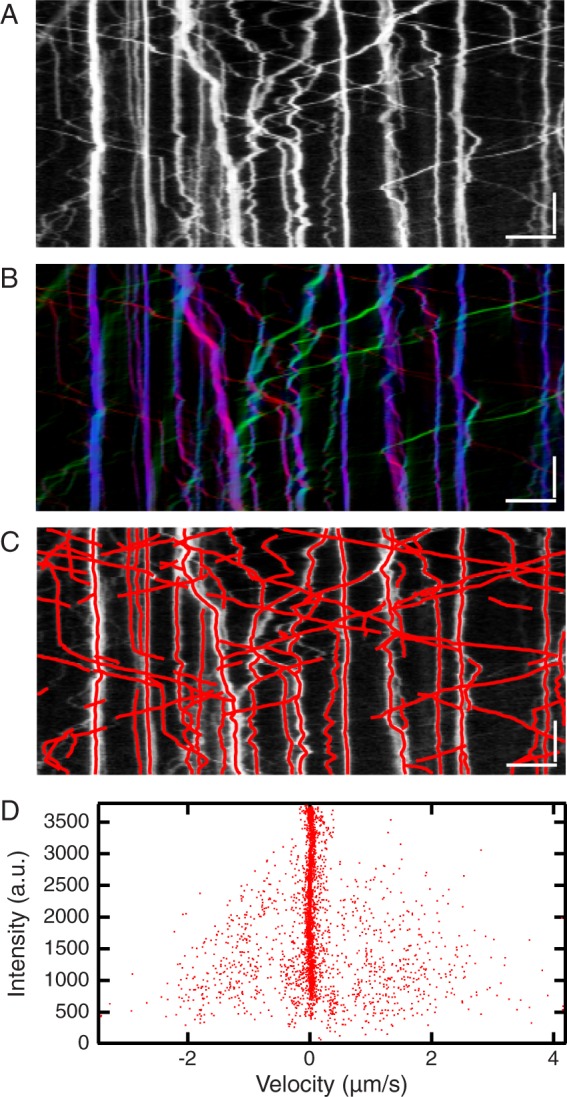
FIGURE 10:
Experimental data from axonal transport in primary neurons. (A) Kymograph generated from the top sequence of Movie S2 of Moughamian and Holzbaur (2012) . (B) Same kymograph as A, Fourier-filtered for ...
Figure images are served from the NIH/NLM PubMed Central Open Access Subset or Europe PMC; copyright remains with the publishers and authors.
💬 Discussion
0 commentsNo comments yet. Be the first to start a discussion!
Leave a Comment