Abstract
Live-cell microscopy has highlighted that transcription factors bind transiently to chromatin but it is not clear if the duration of these binding interactions can be modulated in response to an activation stimulus, and if such modulation can be controlled by post-translational modifications of the transcription factor. We address this question for the tumor suppressor p53 by combining live-cell single-molecule microscopy and single cell in situ measurements of transcription and we show that p53-binding kinetics are modulated following genotoxic stress. The modulation of p53 residence times on chromatin requires C-terminal acetylation-a classical mark for transcriptionally active p53-and correlates with the induction of transcription of target genes such as CDKN1a. We propose a model in which the modification state of the transcription factor determines the coupling between transcription factor abundance and transcriptional activity by tuning the transcription factor residence time on target sites.Both transcription binding kinetics and post-translational modifications of transcription factors are thought to play a role in the modulation of transcription. Here the authors use single-molecule tracking to directly demonstrate that p53 acetylation modulates promoter residence time and transcriptional activity.
🔬 Techniques
🔭 Microscopes
💻 Software
✨ Fluorophores
🧪 Sample Preparation
🔬 Cell Lines
🏭 Microscope Brands
🧪 Reagent Suppliers
📷 Detectors
💻 Software Details
💾 Data Repositories
🏛️ Research Organizations (ROR)
Affiliated research institutions:
📋 Methods
Plasmids and transient transfections
Plasmids encoding for CTD mutations of HaloTag-p53 were obtained from the CMVd1-HaloTag-p53wt by site directed mutagenesis by GeneWiz (GeneWiz, South Plainfield, NJ, USA). The entire plasmid sequences were verified prior to use. H1299 cells were transiently transfected with these plasmids using the JetPrime transfection reagent (Polyplus-transfection, New York, NY, USA) and labeled and imaged 18 h after transfection. The plasmid for the expression of Set8 short-hairpin was a kind gift from Gailit Lahav 12 . MCF-7/6/Hp53 cells were transiently transfected with the Set8-sh plasmid, kept under antibiotic selection for 72 h and then labeled and imaged as described below.
Stable cell lines generation
The plasmids encoding for HaloTag-p53wt and HaloTag-p53mSB under the control of a Tet-dependent promoter were generated by digestion of the CMVd1-HaloTag-p53 and CMVd1-HaloTag-p53mSB plasmids 23 with HindIII and XbaI restriction enzymes, and subsequent ligation into the pCDNA-4/TO vector (Invitrogen, Thermo-Fisher, Waltham, MA, USA). Each of the plasmids was co-transfected with the pCDNA-6 plasmid (Thermo-Fisher) (responsible for the constitutive expression of the Tet-repressor) into lung carcinoma H1299 cells (ATCC, LGC Standards S.r.l., Milan, Italy) using Lipofectamine LTX (Thermo-Fisher) according to the manufacturer’s instructions.
Breast carcinoma MCF-7 cells
(ATCC) were also transfected with pCDNA-4/TO/HaloTag-p53wt and pCDNA-6 using Lipofectamine LTX. Cells expressing Tet-repressor and HaloTag-p53 were selected by antibiotic resistance using 10 µg ml −1 Blasticidin and 150 µg ml −1 Zeocin (Thermo-Fisher). Individual clones were generated by serial dilution and screened for expression levels, nuclear localization of the tagged protein and for its capability to induce transactivation of target genes (Supplementary Fig. 1 ). Cells were routinely tested for mycoplasma contamination by qPCR.
Show full methods section
Plasmids and transient transfections
Plasmids encoding for CTD mutations of HaloTag-p53 were obtained from the CMVd1-HaloTag-p53wt by site directed mutagenesis by GeneWiz (GeneWiz, South Plainfield, NJ, USA). The entire plasmid sequences were verified prior to use. H1299 cells were transiently transfected with these plasmids using the JetPrime transfection reagent (Polyplus-transfection, New York, NY, USA) and labeled and imaged 18 h after transfection. The plasmid for the expression of Set8 short-hairpin was a kind gift from Gailit Lahav 12 . MCF-7/6/Hp53 cells were transiently transfected with the Set8-sh plasmid, kept under antibiotic selection for 72 h and then labeled and imaged as described below.
Stable cell lines generation
The plasmids encoding for HaloTag-p53wt and HaloTag-p53mSB under the control of a Tet-dependent promoter were generated by digestion of the CMVd1-HaloTag-p53 and CMVd1-HaloTag-p53mSB plasmids 23 with HindIII and XbaI restriction enzymes, and subsequent ligation into the pCDNA-4/TO vector (Invitrogen, Thermo-Fisher, Waltham, MA, USA). Each of the plasmids was co-transfected with the pCDNA-6 plasmid (Thermo-Fisher) (responsible for the constitutive expression of the Tet-repressor) into lung carcinoma H1299 cells (ATCC, LGC Standards S.r.l., Milan, Italy) using Lipofectamine LTX (Thermo-Fisher) according to the manufacturer’s instructions.
Breast carcinoma MCF-7 cells
(ATCC) were also transfected with pCDNA-4/TO/HaloTag-p53wt and pCDNA-6 using Lipofectamine LTX. Cells expressing Tet-repressor and HaloTag-p53 were selected by antibiotic resistance using 10 µg ml −1 Blasticidin and 150 µg ml −1 Zeocin (Thermo-Fisher). Individual clones were generated by serial dilution and screened for expression levels, nuclear localization of the tagged protein and for its capability to induce transactivation of target genes (Supplementary Fig. 1 ). Cells were routinely tested for mycoplasma contamination by qPCR.
Generation of MCF-7-p53KO Cells
MCF-7 cells were transfected using UltraCruz Transfection Reagent (sc-395739) with constructs expressing Cas9-D10A (Nickase) and sgRNAs targeting p53 exon3 (Santa Cruz sc-416469-NIC). 24 h after transfection, cells were selected in culture medium containing 1 µg ml −1 puromycin for 5 days. Then, cells were suspended and seeded to allow single clone formation, in complete medium without antibiotic. Picked clones were analyzed for the expression of p53 both by western blot and by immunofluorescence with α-p53 (DO-1) antibody (Supplementary Fig. 5a ).
Cell culture
MCF-7 and H1299 cell lines were cultured in RPMI-1640 medium (Gibco, Thermo-Fisher, Waltham, MA, USA) supplemented with 10% heat-inactivated Fetal Bovine Serum, 2 mM L-Glutamine, 100 units ml −1 penicillin and 100 μg ml −1 streptomycin. HaloTag-p53 levels and localization in MCF-7/6/Hp53 cells were assessed by incubating with 500 nM HaloTag-TMR for 30 min followed by extensive washes with PBS to remove the unbound fluorescent ligand. Cells were fixed in 4% paraformaldehyde for 10 min at room temperature (RT), incubated with 1 µg ml −1 Hoechst 33342 (Invitrogen) for 10 min at RT and extensively washed in PBS.
Immunofluorescence
Immunofluorescence for p53 in MCF-7 cells was carried out by fixing cells with 4% paraformaldehyde for 10 min at RT, permeabilizing them with 0.1% TritonX-100, blocking with 5% BSA in PBS and incubating them with mouse monoclonal p53 antibody [DO-1] (Abcam Ab1101, Cambridge, UK) diluted 1:200 in PBS-0.1% Tween20-2% BSA for 2 h at RT. Cells were washed three times with PBS-0.1% Tween20-2% BSA and incubated with antimouse AlexaFluor 647 secondary antibody in PBS-0.1% Tween20. Cells were washed for three times with PBS and the DNA was labeled with 1 μg ml −1 Hoechst 33342 in PBS 10 min at RT. Imaging of the mounted coverslips was performed by using a confocal microscope (TCS SP5 AOBS Leica LSM, Leica Microsystems SRL, Milan, IT) equipped with a 63×NA1.4 oil-immersion objective.
Irradiation and drug treatment
In order to induce activation of p53 by genotoxic stress we irradiated MCF-7 and H1299 cells with 10 Gy gamma-ray irradiation using a 137 Cs source (Biobeam 2000). In order to prevent p53-CTD acetylation we used 100 μM wortmannin (Sigma Aldrich SRL, Milan, Italy), added half an hour after the induction of DNA damage. The wortmannin solution was replaced fresh every hour. All the experiments on HaloTag-p53 were performed by exploiting the leakage of the Tet-regulated promoter, except when HaloTag-p53 overexpression was desired, where concentrations of doxycycline ranging from 1 ng ml −1 to 1 µg ml −1 were used. DMSO was added in control samples.
Western blotting
Cells grown on 10 cm plates were washed once in PBS and lysed in 500 µl Lysis Buffer (50 mM Tris HCl pH 7.5, 150 mM NaCl, 1% NP40, 5 mM EDTA) with protease inhibitors (Sigma-Aldrich, Milan, Italy). The samples were incubated at 4 °C, for 20 min and centrifuged at 15 000 rcf for 15 min to collect the supernatant. An aliquot of the cell lysate was used for protein quantification with BCA (Thermo-Fisher). Proteins were separated in 10% SDS-polyacrylamide gels and transferred to nitrocellulose membranes, in Transfer Buffer (25 mM Tris, 192 mM Glycine, 20% Methanol) at 100 Volts for 1 h. Membranes were blocked using 5% non-fat dried milk in TBS-T (0.1% (v/v) Tween20 in 1× TBS) for 1 h at RT. The antibodies used for immunoblotting were: mouse monoclonal anti-p53 DO-1; rabbit monoclonal anti-p53 acetyl K382 (Abcam 75754, diluted 1:1000 and incubated at 4 °C overnight); mouse monoclonal anti-vinculin (Millipore CP74, diluted 1:10 000 and incubated for 1 h at RT); mouse monoclonal anti-GAPDH (Sigma-Aldrich G8795; diluted 1:2000 and incubated for 1 h at RT). Peroxidase-conjugated secondary antibody anti-mouse IgG (Cell Signaling, 7076) or anti-rabbit IgG (Cell Signaling, 7074) were diluted 1:5000 and hybridized for 1 h at RT. All the antibodies were diluted in TBS-T with 5% non-fat dried milk. Full scans of the western blots shown in Figs. 1 and 3 are provided in Supplementary Fig. 7 .
RNA extraction and quantitative real-time PCR assay
RNAs were extracted using TRIzol Reagent (Invitrogen) and subsequently purified using silica membrane spin columns from Nucleospin RNA (Mechery Nagel). RNA quantity and purity were assessed using a NanoDrop fluorimeter (Thermo-Fisher). 4 µg of total RNA were reverse-transcribed using the random hexamers-based High Capacity cDNA Reverse-Transcription Kit (Applied Biosystem), according to the manufacturer’s instructions. Gene expression of p53 targets was measured using qPCR. The reaction was performed in a final volume of 20 µl, using the LightCycler 480 SYBR Green I Master mix (Roche, Monza, IT), 0.5 µl of diluted cDNA (1:100), and 0.5 nM of each primer. Normalization of cDNA loading was obtained by running all samples in parallel using human GAPDH as a loading control. The cDNA was amplified using an initial denaturation and activation step at 95 °C for 10 min, followed by 40 cycles of 95 °C for 15 s, 60 °C for 1 min, and 95 °C for 15 s. The sequences of the primers used are provided in Supplementary Table 1 .
Single-molecule fluorescence in situ hybridization
To identify CDKN1a nascent and mature RNA, Design Ready Stellaris RNA FISH probes (Biosearch Technologies, Petaluma, CA, USA), labeled with the Quasar 570 fluorescent dye were used according to the manufacturer instructions. Cells were fixed in 4% PFA for 10 min at RT, followed by washing in PBS and permeabilization with 0.1% TritonX-100. Cells were then incubated for 10 min at RT with 1 ml of washing buffer A composed by 10% saline sodium citrate (SSC), 10% formamide solution (Sigma Aldrich), diluted in RNase-free water. Hybridization was carried out overnight in a humidified chamber at 37 °C by covering the coverslip with 0.5 µl of 12 µM CDKN1a FISH probes diluted in 100 µl of hybridization buffer, composed by 10% (w/v) of dextran sulfate, 10% of SSC-20× buffer and 20% formamide in Rnase-free water. After the hybridization, cells were washed twice in buffer A for 30 min at 37 °C, washed once in 10% SCC-20×. Following DNA staining with 1 µg ml −1 Hoechst 33342 in PBS, the coverslips were mounted on glass slides using Vectashield (Vector Laboratories, Peterborough, UK) mounting media. To monitor HaloTag-p53 levels together with CDKN1a transcription, cells were labeled with 5 μM HaloTag-SIR fluorescent ligand 51 for 30 min at 37 °C before cell permeabilization. Cells were then extensively washed to remove the unbound ligand. Imaging was performed on our single-molecule capable microscope (see below), by using the mercury lamp as excitation source. For every field a z-stack series of images were acquired with 0.3 µm step size, to count the total number of mature RNAs for each cell. smFISH stacks were analyzed using a previously described Matlab (Matworks, Natick, MA) analysis package, named FISHquant 34 . Mature RNAs were identified as 3D gaussian spots with intensity higher than an arbitrary threshold, which was held constant for all acquisitions belonging to the same experiment. Nascent RNAs at active transcription sites were quantified by identifying the sites of nascent transcription as bright (>10 times higher than the threshold set for mature RNA), nuclear foci. With these settings, no more than four actively transcribed loci were found within each nucleus. For each of the transcription sites the amount of RNA was calculated by comparing the integrated intensity of the site with the average integrated intensity of the spots identified as mature RNAs. The nascent RNA measurements by smFISH were validated by qPCR (Supplementary Fig. 4 ). For visualization, the smFISH stacks were deconvolved using the Iterative Deconvolve plug-in of FiJi 52 and maximally projected.
Single-molecule tracking
SMT microscopy . For single-molecule imaging we used a custom-built microscope capable of inclined illumination 25 , based on a Olympus IX-81 microscope frame, equipped with a ×100, 1.49 NA oil-immersion objective (Olympus Life science, Segrate, IT) and an EM-CCD camera (Photometrics Evolve 512, Photometrics, Tucson, AZ, USA), for a resulting pixel size of 145 nm. In order to obtain short (5 ms) exposures independently of the frame-rate used we adopted stroboscopic illumination, which was achieved by synchronizing the camera exposure signal to the digital modulation input of the 561 nm laser (iFlex Mustang 561 nm, QiOptiq Photonics GmbH, Munich, DE) through a pulse generator (Berkeley Nucleonics, San Rafael, CA, USA). All acquisitions were performed at 37 °C and 5% CO 2 by making use of an environmental chamber (Okolab SRL, Naples, IT). Cell labeling and acquisition . The day before single-molecule tracking experiments 2 × 10 5 cells were plated on 2-well LabTek coverglass chambers. One hour before imaging HaloTag-p53 was labeled by using 500 pM Halotag ligand, incubated for 30 min at 37 °C and extensively washed (two rounds of three washes in PBS and 15 min incubation at 37 °C in phenol-red free RPMI). For each cell, we acquired a reference low-intensity fluorescence image and a transmitted light image, followed by the SMT acquisition, a time lapse of 500 consecutive images obtained by exposing for 5 ms with ~ 1 kW cm −2 of the 561 nm laser light, with a frame-rate ranging from 10 to 25 fps. All experiments were repeated at least twice on different experimental days. Analysis of the single-molecule tracking movies . The collected SMT movies were analyzed by custom-written Matlab routines, to identify and track individual molecules, as previously described 22 . The resulting tracks were analyzed to quantify the p53 bound fraction as described in the Supplementary Methods . Single-molecule movies were also analyzed to quantify the distribution of p53 residence time on chromatin, as described in the Supplementary Methods . Tracking failed for cells with high density of molecules (approximately > 20 molecules/frame): these cells were excluded from further analysis.
Data availability
The data used to generate the plots displayed in the article have been deposited on Figshare (doi: 10.6084/m9.figshare.5119759). All other relevant data is available from the authors upon request.
Electronic supplementary material Supplementary Information Supplementary Movie 1 Supplementary Movie 2 Supplementary Movie 3 Supplementary Movie 4 Supplementary Movie 5 Supplementary Movie 6 Supplementary Movie 7 Peer Review File
📊 Figures
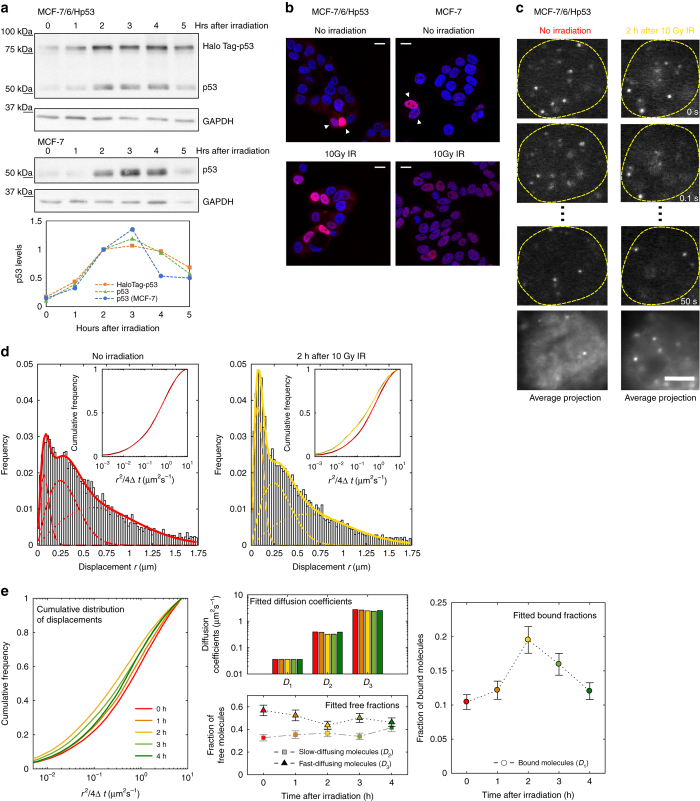
Fig. 1
Single-molecule tracking of HaloTag-p53 in response to DNA damage. a , b Characterization of MCF-7/6/Hp53 cell line a Western blot of p53 and HaloTag-p53 at different times following the induction of ...
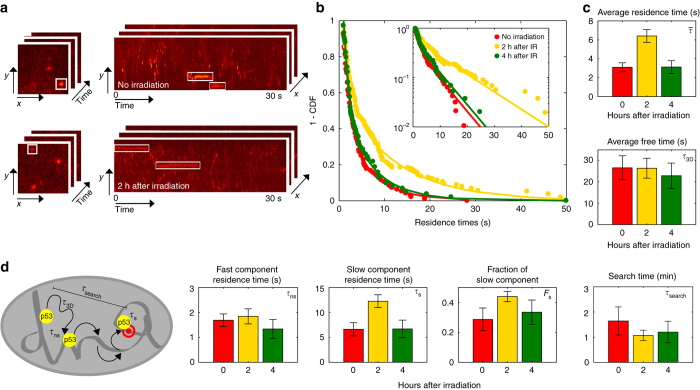
Fig. 2
Measurement of the p53 residence time by kymograph analysis. a In kymograph representation, chromatin-bound transcription factors ( white rectangles ) appear as horizontal segments parallel to the tem...
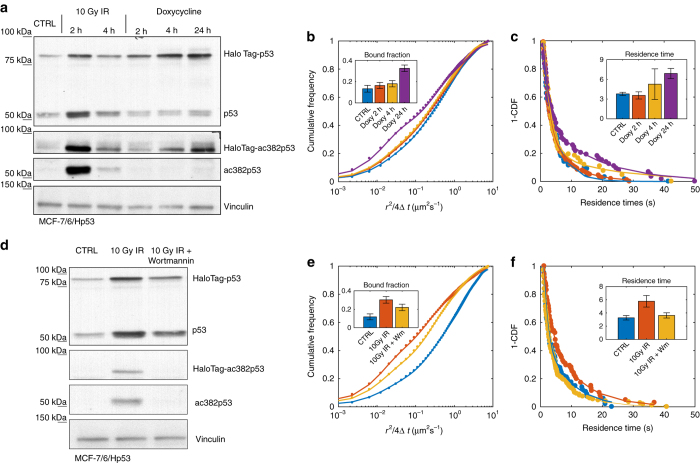
Fig. 3
An increase in p53 levels is not sufficient in modulating p53-binding kinetics but p53-CTD acetylation is also necessary. a Western blot of HaloTag-p53 total protein and acetylated at lysine 382 upon ...
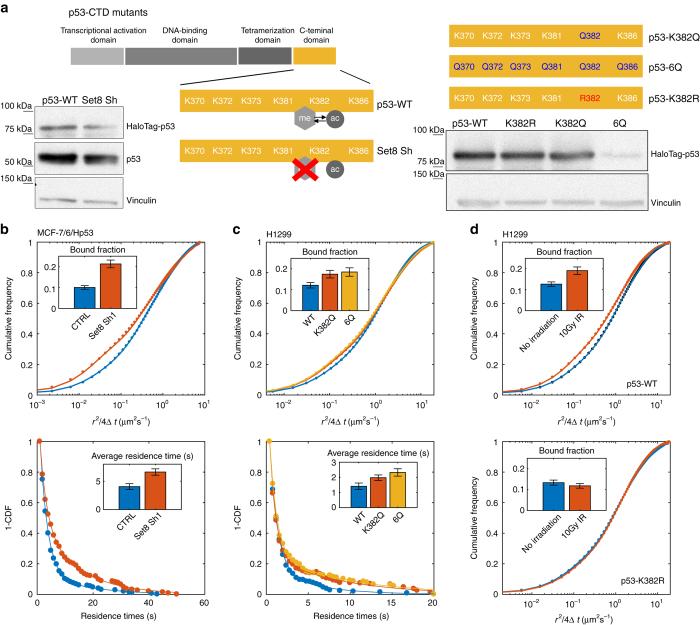
Fig. 4
Dissecting the role of CTD acetylation in binding. a Scheme of the treatments and p53 mutants. Expression levels of (HaloTag)-p53 upon the different treatments are shown. b Cumulative distribution of ...
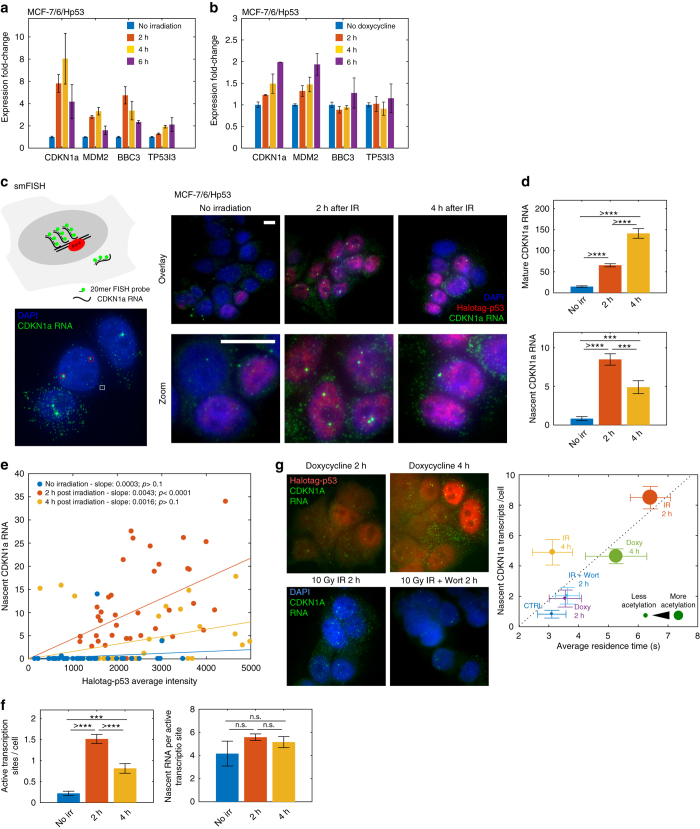
Fig. 5
Population and single-cell transcriptional response to the modulation of p53-binding kinetics. a qPCR of p53 targets following irradiation (3 replicates, error bars : SD). b qPCR of p53 targets follow...
Figure images are served from the NIH/NLM PubMed Central Open Access Subset or Europe PMC; copyright remains with the publishers and authors.
💬 Discussion
0 commentsNo comments yet. Be the first to start a discussion!
Leave a Comment