Abstract
Alpha thalassemia/mental retardation X linked (ATRX) is a switch/sucrose nonfermenting-type ATPase localized at pericentromeric heterochromatin in mouse and human cells. Human ATRX mutations give rise to mental retardation syndromes characterized by developmental delay, facial dysmorphisms, cognitive deficits, and microcephaly and the loss of ATRX in the mouse brain leads to reduced cortical size. We find that ATRX is required for normal mitotic progression in human cultured cells and in neuroprogenitors. Using live cell imaging, we show that the transition from prometaphase to metaphase is prolonged in ATRX-depleted cells and is accompanied by defective sister chromatid cohesion and congression at the metaphase plate. We also demonstrate that loss of ATRX in the embryonic mouse brain induces mitotic defects in neuroprogenitors in vivo with evidence of abnormal chromosome congression and segregation. These findings reveal that ATRX contributes to chromosome dynamics during mitosis and provide a possible cellular explanation for reduced cortical size and abnormal brain development associated with ATRX deficiency.
🔬 Techniques
🔭 Microscopes
💻 Software
✨ Fluorophores
🧪 Sample Preparation
🔬 Cell Lines
🏭 Microscope Brands
🧪 Reagent Suppliers
📷 Detectors
🔎 Objectives
💻 Software Details
🏛️ Research Organizations (ROR)
Affiliated research institutions:
📋 Methods
Cell culture and transfection HeLa (American Type Culture Collection) and HG cells (a gift from G.M. Wahl, Salk Institute for Biological Studies, La Jolla, CA) were grown at 37°C with 5% CO 2 in DME supplemented with 10% FBS (Sigma-Aldrich). HG growth media was supplemented with 2 μg/ml blasticidin S HCl (Invitrogen) to maintain transgene expression. For siRNA transfection, cells were seeded 24 h before transfection using Lipofectamine 2000 (Invitrogen) according to the manufacturer's instructions. The final siRNA concentration used in all experiments was 8 nM. In HeLa cells, the transfection efficiency was ∼90–95% based on immunofluorescence detection of the ATRX protein isoforms. For population synchronization at G1/S, transfected cells were incubated with 10 μM hydroxyurea and released after 16 h by removal of the drug. RNA interference The synthetic oligonucleotides siATRX1 (5′-GAGGAAACCUUCAAUUGUAUU-3′), siATRX2 (5′-GCAGAGAAAUUCCUAAAGAUU-3′), and siATRX1 scrambled (5′-GAUUGAAGACUGAUAUCACUU-3′) were obtained from Dharmacon. The control (nontargeting) duplex was obtained from Sigma-Aldrich. siRNA duplexes were transfected with Lipofectamine 2000 according to the manufacturer's instructions. Mock-transfected samples were treated similarly but without the addition of siRNA.
Western blot analysis
Cells were lysed with RIPA buffer (150 mM NaCl, 1% NP-40, 50 mM Tris, pH 8.0, 0.5% deoxycholic acid, 0.1% SDS, 0.2 mM PMSF, 0.5 mM NaF, 0.1 mM Na 3 VO 4 , and 1 protease inhibitor cocktail tablet [Complete mini, EDTA-free; Roche]) for 5 min on ice. Extracts were sonicated and quantified using the DC protein assay (Bio-Rad Laboratories). 20 μg of protein was resolved on 6 or 12% SDS-PAGE and transferred onto nitrocellulose membranes (Bio-Rad Laboratories). The membranes were probed with rabbit α-ATRX H300 (Santa Cruz Biotechnology, Inc.), mouse α-ATRX 39f (a gift of D.J. Picketts, Ottawa Health Research Institute, Ottawa, Canada; and D. Higgs, University of Oxford, Oxford, UK), followed by the appropriate horseradish peroxidase–conjugated secondary antibody (1:5,000; GE Healthcare). After washing, the membrane was incubated in ECL before exposure to x-ray film. The membrane was reprobed with mouse α–α-tubulin (1:40,000; Sigma-Aldrich) as a loading control. Q-RT-PCR analysis Total RNA was isolated using the RNeasy mini kit (QIAGEN). First-strand cDNA was synthesized from 3 μg of total RNA using random primers and a reverse transcription cocktail containing 5× first strand buffer, 100 mM DTT, 25 mM dNTPs, RNA guard (GE Healthcare), and Superscript RT (Invitrogen). PCR reactions were performed on a continuous fluorescence detector (Chromo4; MJ Research) in the presence of iQ SYBR green supermix (Bio-Rad Laboratories) and analyzed with Opticon Monitor 3 and GeneX software (Bio-Rad Laboratories) using the standard curve corresponding threshold method of quantification. Samples were amplified as follows: 95°C for 30 s, 55°C for 30 s, and 72°C for 30 s. After 30 cycles, a melting curve was generated to visualize amplicon purity. Standard curves were generated for each primer pair using fivefold serial dilutions of control cDNA. Primer efficiency was calculated as %E = [(10 (−1/slope ) – 1] × 100%, where a desirable slope is −3.32 and r 2 > 0.99. All data were normalized GAPDH expression levels. The primers used for Q-RT-PCR were as follows: ATRX-F, 5′-TCCTTGCACACTCATCAGAAGAATC-3′; ATRX-R, 5′-CGTGACGATCCTGAAGACTTGG-3′; GAPDH-F, 5′-GAGTCAACGGATTTGGTCGT-3′; and GAPDH-R, 5′-GACAAGCTTCCCGTTCTCAG-3′.
Show full methods section
Cell culture and transfection HeLa (American Type Culture Collection) and HG cells (a gift from G.M. Wahl, Salk Institute for Biological Studies, La Jolla, CA) were grown at 37°C with 5% CO 2 in DME supplemented with 10% FBS (Sigma-Aldrich). HG growth media was supplemented with 2 μg/ml blasticidin S HCl (Invitrogen) to maintain transgene expression. For siRNA transfection, cells were seeded 24 h before transfection using Lipofectamine 2000 (Invitrogen) according to the manufacturer's instructions. The final siRNA concentration used in all experiments was 8 nM. In HeLa cells, the transfection efficiency was ∼90–95% based on immunofluorescence detection of the ATRX protein isoforms. For population synchronization at G1/S, transfected cells were incubated with 10 μM hydroxyurea and released after 16 h by removal of the drug. RNA interference The synthetic oligonucleotides siATRX1 (5′-GAGGAAACCUUCAAUUGUAUU-3′), siATRX2 (5′-GCAGAGAAAUUCCUAAAGAUU-3′), and siATRX1 scrambled (5′-GAUUGAAGACUGAUAUCACUU-3′) were obtained from Dharmacon. The control (nontargeting) duplex was obtained from Sigma-Aldrich. siRNA duplexes were transfected with Lipofectamine 2000 according to the manufacturer's instructions. Mock-transfected samples were treated similarly but without the addition of siRNA.
Western blot analysis
Cells were lysed with RIPA buffer (150 mM NaCl, 1% NP-40, 50 mM Tris, pH 8.0, 0.5% deoxycholic acid, 0.1% SDS, 0.2 mM PMSF, 0.5 mM NaF, 0.1 mM Na 3 VO 4 , and 1 protease inhibitor cocktail tablet [Complete mini, EDTA-free; Roche]) for 5 min on ice. Extracts were sonicated and quantified using the DC protein assay (Bio-Rad Laboratories). 20 μg of protein was resolved on 6 or 12% SDS-PAGE and transferred onto nitrocellulose membranes (Bio-Rad Laboratories). The membranes were probed with rabbit α-ATRX H300 (Santa Cruz Biotechnology, Inc.), mouse α-ATRX 39f (a gift of D.J. Picketts, Ottawa Health Research Institute, Ottawa, Canada; and D. Higgs, University of Oxford, Oxford, UK), followed by the appropriate horseradish peroxidase–conjugated secondary antibody (1:5,000; GE Healthcare). After washing, the membrane was incubated in ECL before exposure to x-ray film. The membrane was reprobed with mouse α–α-tubulin (1:40,000; Sigma-Aldrich) as a loading control. Q-RT-PCR analysis Total RNA was isolated using the RNeasy mini kit (QIAGEN). First-strand cDNA was synthesized from 3 μg of total RNA using random primers and a reverse transcription cocktail containing 5× first strand buffer, 100 mM DTT, 25 mM dNTPs, RNA guard (GE Healthcare), and Superscript RT (Invitrogen). PCR reactions were performed on a continuous fluorescence detector (Chromo4; MJ Research) in the presence of iQ SYBR green supermix (Bio-Rad Laboratories) and analyzed with Opticon Monitor 3 and GeneX software (Bio-Rad Laboratories) using the standard curve corresponding threshold method of quantification. Samples were amplified as follows: 95°C for 30 s, 55°C for 30 s, and 72°C for 30 s. After 30 cycles, a melting curve was generated to visualize amplicon purity. Standard curves were generated for each primer pair using fivefold serial dilutions of control cDNA. Primer efficiency was calculated as %E = [(10 (−1/slope ) – 1] × 100%, where a desirable slope is −3.32 and r 2 > 0.99. All data were normalized GAPDH expression levels. The primers used for Q-RT-PCR were as follows: ATRX-F, 5′-TCCTTGCACACTCATCAGAAGAATC-3′; ATRX-R, 5′-CGTGACGATCCTGAAGACTTGG-3′; GAPDH-F, 5′-GAGTCAACGGATTTGGTCGT-3′; and GAPDH-R, 5′-GACAAGCTTCCCGTTCTCAG-3′.
Flow cytometry
Exponentially growing cells were harvested, washed with calcium/magnesium-free (CMF) PBS (137 mM NaCl, 2.7 mM KCl, 1.5 mM potassium phosphate monobasic, and 12 mM sodium phosphate dibasic) three times and 1.5 × 10 6 cells were fixed dropwise with 90% ethanol and stored at 4°C for at least 12 h. To detect DNA content, cells were washed and stained with propidium iodide/RNase staining solution (10 μg/ml propidium iodide), 250 μg/ml RNase A (Sigma-Aldrich), and 2% BSA in CMF PBS for 30 min at room temperature followed by overnight incubation at 4°C. Cell populations were analyzed by flow cytometry on an EPICS XL-MCL instrument (Beckman-Coulter). Data analysis to determine the proportion of cells in each phase of the cell cycle was performed using the Expo 32 software package (Beckman Coulter).
Indirect immunofluorescence microscopy
For immunofluorescence detection, cells were fixed with 3:1 ethanol/methanol up to 4 d after control or siRNA transfection and incubated with the following primary antibodies: α-ATRX H300 (1:200; Santa Cruz Biotechnology, Inc.), α-ATRX 39f (1:20; provided by D.J. Picketts), α–α-tubulin (1:1,500; Sigma-Aldrich), α-phosphohistone H3(S10) (1:200; Millipore), human α-CREST (1:10,000; W. Brinkley, Baylor College of Medicine, Houston, TX), α-BubR1 (1:200; BD Biosciences), α-Bub1 (1:1,000; a gift from S. Taylor, University of Manchester, Manchester, UK), α-CENP-E (1:400; Santa Cruz Biotechnology, Inc.), α–CENP-F (a gift from S. Taylor), α-HP1α (1:200; Millipore), and α-HP1β (1:200; Millipore). Secondary antibodies included goat α–rabbit Alexa 594 (1:1,500), donkey α–rabbit Alexa 488 (1:1,500), goat α–mouse Alexa 488 (1:1,500), goat α–mouse Alexa 594 (1:1,500), and goat α–human Alexa 647 (1:1,500; Invitrogen). Coverslips were mounted with Vectashield H-1000 (Vector Laboratories).
Generation of ATRX-depleted stable clones
Pairs of sense 60-mer oligonucleotides corresponding to the 19-mer siATRX1 and siATRX2 siRNA target sequences and their reverse complement (underlined sequences) were designed that contained 5′ BglII and 3′ HindIII restriction sites to facilitate cloning (Integrated DNA Technologies, Inc.). Sequences were as follows: shATRX1 (sense), 5′-GATCCCC GAGGAAACCTTCAATTGTA TTCAAGAGA TACAATTGAAGGTTTCCTC TTTTTA-3′, and shATRX2 (sense), 5′GATCCCC GCAGAGAAATTCCTAAAGA TTCAAGAGA TCTTTAGGAATTTCTCTGC TTTTTA-3′. The oligonucleotides were annealed to complimentary antisense 60-mer oligonucleotides in buffer containing 10 mM Tris, pH 7.5, 50 mM NaCl, and 1 mM EDTA at 90°C for 4 min followed by 70°C for 10 min, and then step cooled to 37°C for 20 min using a thermocycler (MJ Research) and cloned into the pSuper.retro.neo plasmid (Oligoengine) using the Quick ligation kit according to manufacturer's instructions (New England Biolabs, Inc.). The resulting vectors, designated pSUPER-shATRX1 and pSUPER-shATRX2, were subsequently sequenced to confirm sequence identity. Exponentially growing HG were transfected with empty pSuper vector or with pSuper-shATRX1 and pSuper-shATRX2 vectors (1 μg/ml) using Lipofectamine 2000. 2 d after transfection, cells were replated at low density and selection was applied 24 h later (800 μg/ml geneticin; Invitrogen). Drug-resistant colonies were picked and expanded in selection media (400 μg/ml geneticin). Time-lapse and live cell microscopy HeLa-HG, HG-pSuper, HG-shATRX1, or HG-shATRX2 cells were plated on 35-mm glass-bottom tissue culture dishes (MatTek) in DME with 10% FBS. After 24 h, the media was replaced with CO 2 -independent media (Invitrogen) supplemented with 10% FBS and 4 mM l -glutamine (Sigma-Aldrich). For transient experiments, cells were plated and transfected and scored 48–72 h after transfection. Cells were imaged using an automated inverted microscope (DMI 6000b; Leica) equipped with a live cell stage-mounted environment chamber (Neue Biosciences) to maintain the cells at 37°C during imaging. Phase-contrast and fluorescence (GFP) images were captured every 3 min for 10 h using Openlab Software automation (5.0; PerkinElmer). To measure mitotic duration, cells that initiated mitosis (determined by nuclear envelope breakdown) and reentered G1 (nuclear decondensation) within the time frame of the experiment (10 h) were analyzed ( n > 50). This analysis did not include cells that were arrested at prometaphase or that died during the timeframe of the experiment. To measure the frequency of unaligned chromosomes at metaphase, cells were seeded in 35-mm culture wells (BD Biosciences) in DME with 10% FBS and at least 500 metaphase cells were scored per sample. For mitotic spindle checkpoint arrest, HeLa-HG or HG-shATRX1 cells were treated with 100 ng/ml nocodazole for 16 h. Rounded mitotic cells and adherent interphase cells were quantified using live cell microscopy ( n > 1,000). Fixed chromosome spreads HeLa cells were transiently transfected with no siRNA duplex (mock), siATRX1 scrambled (nonspecific control), siATRX1, or siATRX2. 70 h after transfection, mitotically arrested cells were removed by shake-off and adherent cells were treated with 100 ng/ml KaryoMAX Colcemid (Invitrogen) for 2 h. Mitotic cells were then isolated and incubated in hypotonic solution (75 mM KCl) for 20 min followed by fixation in Carnoy's Fix (3:1 methanol/acetic acid) and stored at −20°C. Fixed cells were dropped onto Superfrost Plus glass microscope slides (Thermo Fisher Scientific) and air dried; DNA was counterstained with 100 ng/ml DAPI and mounted in Vectashield H-1000. For z-stack imaging, 0.4-μm-interval z stacks were captured and deconvolved using iterative restoration with Volocity imaging software (4.0; PerkinElmer). Measure of interkinetochore distances To measure interkinetochore distance, mitotic HeLa-HG, HG-pSuper, HG-shATRX1, and HG-shATRX2 stable cells were fixed in 3:1 ethanol/methanol and the kinetochores were stained using the human CREST antibody (1:10,000) and imaged using a 63× 1.4 NA oil immersion objective (Leica). Z stacks were captured at 0.4-μm z intervals spanning 20 μm. Kinetochore pairs were connected from the outer edges of the CREST signal and the distance was measured using Volocity software. Only kinetochore pairs in single optical sections that were aligned at the metaphase plate were used to measure interkinetochore distances ( n ≥ 100). Statistical differences were assessed by ANOVA. Significant differences in mean interkinetochore distance were assessed by ANOVA and a Tukey's multiple comparison post hoc test. Differences were considered significant when P < 0.05. Statistical analysis was performed using GraphPad Prism (4.02; GraphPad Software, Inc.). Kinetochore microtubule assay HeLa-HG, HG-pSuper, HG-shATRX1, or HG-shATRX2 cells were seeded in 35-mm dishes (Corning) in 2 ml DME with 10% FBS on 22-mm 2 glass coverslips (VWR). After 48 h, the growth medium was replaced with ice-cold growth medium and the cells were incubated on ice for 10 min. The cells were rinsed twice with ice-cold PHEM buffer (60 mM piperazine ethanesulfonic acid, 45 mM Hepes, 10 mM EGTA, and 2 mM MgCl 2 , pH 6.9), permeabilized with cold 0.5% Triton X-100 in PHEM buffer for 3 min, and fixed in cold 3.5% paraformaldehyde in PHEM for 15 min. The coverslips were rinsed with PHEM and processed for immunofluorescence staining and microscopy.
Analysis of mitotic cells in the developing telencephalon
The generation of Atrx loxP mice was described previously (obtained from D. Higgs and R. Gibbons, University of Oxford; Berube et al., 2005 ; Garrick et al., 2006 ). Male embryos conditionally deficient for Atrx were obtained by crossing homozygous Atrx loxP females to heterozygous Foxg1Cre knock-in male mice and embryonic yolk sac DNA from E13.5 embryos was genotyped by PCR as described previously ( Berube et al., 2005 ). Midday of the day of vaginal plug discovery was considered to be E0.5. At scheduled times, pregnant females were anesthetized with CO 2 and killed by cervical dislocation. Embryos and postnatal brains were fixed in 4% paraformaldehyde/PBS overnight at 4°C, sunk in 30% sucrose in PBS, and embedded in 15% sucrose and 50% optimal cutting temperature compound (Sakura). Tissue sections were cut at 10-μm thickness and mounted on SuperFrost Plus slides, air dried at room temperature, and stored at −80°C. For immunofluorescence staining, sections were thawed, rehydrated in PBS for 10 min, counterstained with DAPI, and mounted in Vectashield. Micronuclei and misaligned chromosomes from the mitotic layer lining the lateral ventricle were scored from both hemispheres of brain sections ( n = 3) in four litter-matched control and ATRX null embryos using fluorescence microscopy. Analysis was restricted to the mitotic layer that lines the hippocampal hem, hippocampal primordium, and the dorsal cortical neuroepithelium (indicated by the area between 1 and 2 in Fig. 5 C ).
Details of image acquisition and processing
All samples processed for microscopy were imaged using a DMI 6000b automated inverted microscope. IF images were captured using a 63× 1.4 NA oil immersion lens, a 40× 1.25 NA oil immersion lens (Leica), or a 5× dry objective (Leica). For oil immersion microscopy, we used immersion oil with a refractive index of 1.518 (Leica). All images were captured at ambient temperature except for image capture of live cells and time-lapse experiments, which were performed at 37°C. Experiments used different combinations of DAPI, goat anti–rabbit Alexa 594, goat anti–mouse Alexa 594, donkey anti–rabbit Alexa 488, goat anti–mouse Alexa 488, and goat anti–human 594 secondary antibodies. Digital microscopy images were captured with a digital camera (ORCA-ER; Hammamatsu). Openlab imaging software was used for manual and automated image capture and processing was performed using Volocity. All deconvolution was performed using iterative restoration set with a confidence limit of 95%. Online supplemental material Fig. S1 shows the validation of ATRX depletion in HeLa cells. Fig. S2 shows prolonged mitotic time in ATRX-depleted cells. Fig. S3 shows HP1α and HP1β staining in ATRX-depleted cells. Fig. S4 shows abnormal spindle morphology in ATRX-depleted cells. Online supplemental material is available at http://www.jcb.org/cgi/content/full/jcb.200706083/DC1 .
Online supplemental material Fig. S1 shows the validation of ATRX depletion in HeLa cells. Fig. S2 shows prolonged mitotic time in ATRX-depleted cells. Fig. S3 shows HP1α and HP1β staining in ATRX-depleted cells. Fig. S4 shows abnormal spindle morphology in ATRX-depleted cells. Online supplemental material is available at http://www.jcb.org/cgi/content/full/jcb.200706083/DC1 .
Supplemental Material [Supplemental Material Index]
📊 Figures
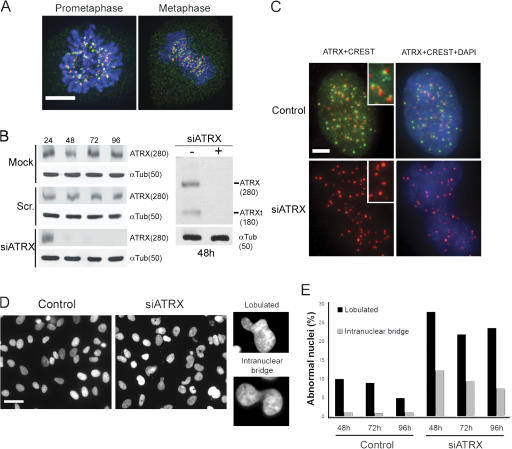
Figure 1.
Transient ATRX depletion in HeLa cells induces abnormal nuclear morphology. (A) Immunofluorescence detection of ATRX (green) and the kinetochore marker CREST (red) on prometaphase and metaphase chromo...
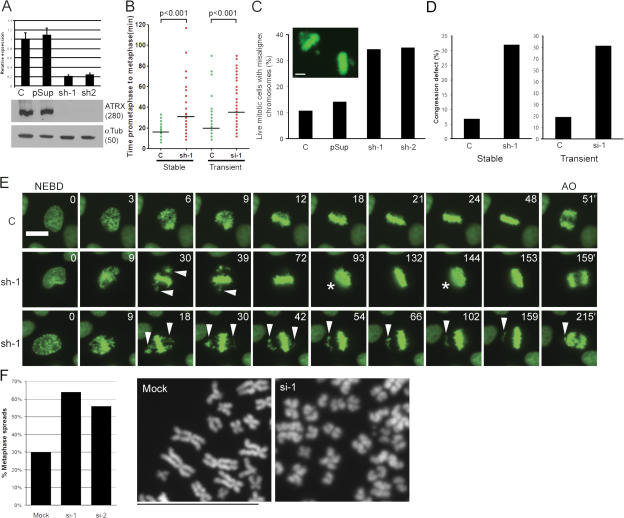
Figure 2.
Stable and transient depletion of ATRX extends the transition to metaphase and induces congression defects. (A) HeLa-HG cells that stably express pSuper-shATRX1, pSuper-shATRX2, or pSuper (empty vecto...
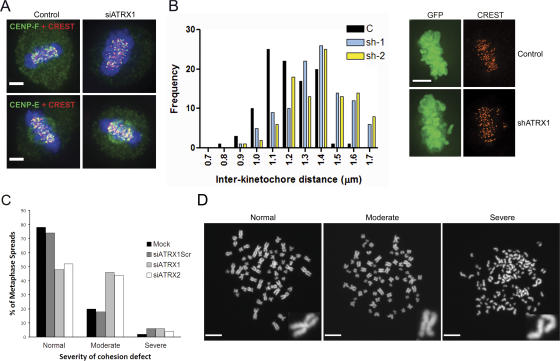
Figure 3.
Increased interkinetochore distances and reduced cohesion in ATRX-depleted cells. (A) ATRX-depleted metaphase cells were stained for the kinetochore proteins CENP-F or CENP-E (green) in combination wi...
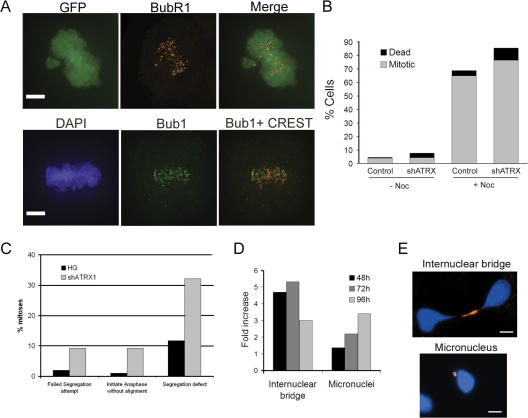
Figure 4.
Spindle checkpoint activation and aberrant chromosome segregation in ATRX-depleted cells. (A) The spindle checkpoint protein BubR1 was detected in ATRX-depleted metaphase cells at both aligned and mis...
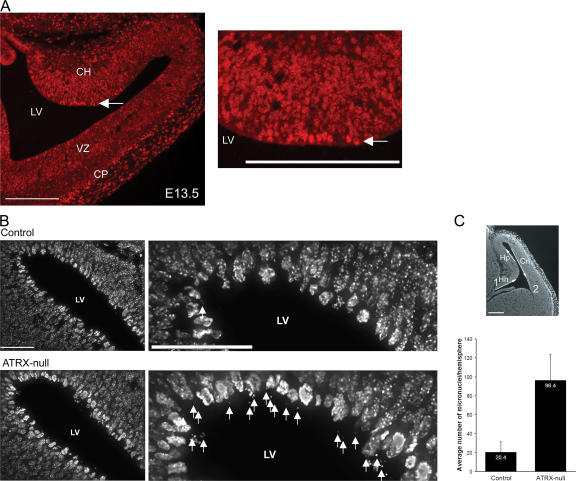
Figure 5.
ATRX association with mitotic chromosomes and evidence of mitotic defects in ATRX-deficient neuroprogenitors in vivo. (A) ATRX staining of the cortex at E13.5. ATRX is highly expressed in all cells bu...
Figure images are served from the NIH/NLM PubMed Central Open Access Subset or Europe PMC; copyright remains with the publishers and authors.
💬 Discussion
0 commentsNo comments yet. Be the first to start a discussion!
Leave a Comment