Abstract
Abstract Post-transcriptional modifications in mitochondrial tRNAs (mt-tRNAs) play critical roles in mitochondrial protein synthesis, which produces respiratory chain complexes. In this study, we took advantage of mass spectrometric analysis to map 5-methylcytidine (m5C) at positions 48–50 in eight mouse and six human mt-tRNAs. We also confirmed the absence of m5C in mt-tRNAs isolated from Nsun2 knockout (KO) mice, as well as from NSUN2 KO human culture cells. In addition, we successfully reconstituted m5C at positions 48–50 of mt-tRNA in vitro with NSUN2 protein in the presence of S-adenosylmethionine. Although NSUN2 is predominantly localized to the nucleus and introduces m5C into cytoplasmic tRNAs and mRNAs, structured illumination microscopy clearly revealed NSUN2 foci inside mitochondria. These observations provide novel insights into the role of NSUN2 in the physiology and pathology of mitochondrial functions.
🔬 Techniques
💻 Software
✨ Fluorophores
🧪 Sample Preparation
🔬 Cell Lines
🏭 Microscope Brands
🧪 Reagent Suppliers
📷 Detectors
🔎 Objectives
💻 Software Details
💾 Data Repositories
🏛️ Research Organizations (ROR)
Affiliated research institutions:
📋 Methods
Cell culture
HeLa and HEK293T cells, and mouse embryonic fibroblasts (MEFs) were cultured at 37°C in an atmosphere containing 5% CO 2 in Dulbecco's modified Eagle's medium (DMEM, Sigma-Aldrich) supplemented with 10% fetal bovine serum (FBS, Gibco) and 1% penicillin-streptomycin (PS, Fujifilm Wako Pure Chemical Corporation). Animals Nsun2 −/− mice (gene trap clone ID 21-B114 in the EGTC database, http://egtc.jp/ ) ( 39 ) were provided by the Center for Animal Resources and Development (CARD) at Kumamoto University. Animals were housed at 25°C with 12 h light and 12 h dark cycles. To generate MEFs, male and female Nsun2 +/− mice were mated, and embryos were dissected out at day 14 of gestation. Embryo head and liver were removed for genotyping, the remaining tissues were treated with trypsin for 10 min at 37°C. Primary MEFs were seeded in 10 mm dishes and stored at passage number 2. All animal procedures were approved by the Animal Ethics Committee of Kumamoto University (Approval ID: A29–016R3).
Construction of NSUN2 KO cell lines
Oligonucleotide sequences used for gene editing are listed in Supplementary Table S1 . NSUN2 KO HEK293T cell lines were constructed using the CRISPR-Cas9 system as described previously ( 13 , 40 ). In brief, sense and antisense oligonucleotides for a single guide RNA (sgRNA) were cloned into pX330 (Addgene plasmid #42230) ( 41 ). HEK293T cells seeded on 24-well plates were co-transfected with 300 ng pX330 containing the sgRNA sequence, 100 ng pEGFP-N1 (Clontech) and 100 ng modified pLL3.7 vector containing a puromycin resistance gene. Transfections were performed using FuGENE HD (Promega). The following day, the cells were sparsely seeded in a 100 mm dish, and transfectants were selected with 1 μg/ml puromycin. Transfection efficiency was assessed by monitoring EGFP fluorescence. A few days after the transfection, several colonies were isolated and grown for an additional week. The sequence of the targeted region in each selected clone was confirmed by direct sequencing of genomic polymerase chain reaction (PCR) products. PCR primer sequences are provided in Supplementary Table S1 . RNA preparation, tRNA isolation and mass spectrometry Total RNA from culture cells was prepared by a standard acid guanidium-phenol-chloroform (AGPC) method ( 42 ). Individual mt-tRNAs were isolated by reciprocal circulation chromatography (RCC) ( 43 ). DNA probe sequences complementary to each mt-tRNA are listed in Supplementary Table S1 .
Show full methods section
Cell culture
HeLa and HEK293T cells, and mouse embryonic fibroblasts (MEFs) were cultured at 37°C in an atmosphere containing 5% CO 2 in Dulbecco's modified Eagle's medium (DMEM, Sigma-Aldrich) supplemented with 10% fetal bovine serum (FBS, Gibco) and 1% penicillin-streptomycin (PS, Fujifilm Wako Pure Chemical Corporation). Animals Nsun2 −/− mice (gene trap clone ID 21-B114 in the EGTC database, http://egtc.jp/ ) ( 39 ) were provided by the Center for Animal Resources and Development (CARD) at Kumamoto University. Animals were housed at 25°C with 12 h light and 12 h dark cycles. To generate MEFs, male and female Nsun2 +/− mice were mated, and embryos were dissected out at day 14 of gestation. Embryo head and liver were removed for genotyping, the remaining tissues were treated with trypsin for 10 min at 37°C. Primary MEFs were seeded in 10 mm dishes and stored at passage number 2. All animal procedures were approved by the Animal Ethics Committee of Kumamoto University (Approval ID: A29–016R3).
Construction of NSUN2 KO cell lines
Oligonucleotide sequences used for gene editing are listed in Supplementary Table S1 . NSUN2 KO HEK293T cell lines were constructed using the CRISPR-Cas9 system as described previously ( 13 , 40 ). In brief, sense and antisense oligonucleotides for a single guide RNA (sgRNA) were cloned into pX330 (Addgene plasmid #42230) ( 41 ). HEK293T cells seeded on 24-well plates were co-transfected with 300 ng pX330 containing the sgRNA sequence, 100 ng pEGFP-N1 (Clontech) and 100 ng modified pLL3.7 vector containing a puromycin resistance gene. Transfections were performed using FuGENE HD (Promega). The following day, the cells were sparsely seeded in a 100 mm dish, and transfectants were selected with 1 μg/ml puromycin. Transfection efficiency was assessed by monitoring EGFP fluorescence. A few days after the transfection, several colonies were isolated and grown for an additional week. The sequence of the targeted region in each selected clone was confirmed by direct sequencing of genomic polymerase chain reaction (PCR) products. PCR primer sequences are provided in Supplementary Table S1 . RNA preparation, tRNA isolation and mass spectrometry Total RNA from culture cells was prepared by a standard acid guanidium-phenol-chloroform (AGPC) method ( 42 ). Individual mt-tRNAs were isolated by reciprocal circulation chromatography (RCC) ( 43 ). DNA probe sequences complementary to each mt-tRNA are listed in Supplementary Table S1 .
Capillary LC-nano-ESI-mass spectrometry
(RNA-MS) of mt-tRNA fragments digested by RNase T 1 was performed as described ( 5 , 44 ). Northern blotting Total RNA (2 μg) from mouse liver was separated by 10% denaturing polyacrylamide gel electrophoresis (PAGE) and blotted onto a nylon membrane (Amersham Hybond N + ; GE Healthcare) using a Transblot Turbo apparatus (Bio-Rad). The blotted RNA was crosslinked to the membrane by two rounds of irradiation with UV light (254 nm, 120 mJ/cm 2 for one round; CL-1000, UVP). DNA probes were 5′-phosphorylated with T4 polynucleotide kinase (PNK, Toyobo) and [γ- 32 P] ATP (PerkinElmer). Northern blotting of tRNAs was performed using PerfectHyb (Toyobo) at 48–55°C with 4 pmol of labeled DNA probes specific to tRNAs and 3 pmol of a labeled DNA probe (mixed with 9 pmol of non-labeled probe) specific for 5S rRNA. The membrane was washed six times with 1 × SSC (150 mM NaCl and 15 mM sodium citrate, adjusted to pH 7.0 with citric acid), and exposed to an imaging plate (BAS-MS2040, Fujifilm). Radioactivity was visualized on an FLA-7000 imaging system (Fujifilm). To quantify the steady-state level of the target tRNA, the radioactivity of the tRNA band was normalized against the 5S rRNA band.
Expression and isolation of NSUN2 Human
NSUN2 cDNA was reverse-transcribed from total RNA of HeLa cells, amplified using primers listed in Supplementary Table S1 and cloned into the entry vector pENTR/D-TOPO (Invitrogen). The gene cassette containing the entry clone was then transferred to a modified pDEST12.2 (Invitrogen) harboring a C-terminal FLAG tag. For transient expression of NSUN2, HEK293T cells (4 × 10 6 ) in 100 mm dishes were transfected with 10 μg pDEST12.2-NSUN2-FLAG using Lipofectamine 2000 (Invitrogen) and cultured for 48–72 h at 37°C in 5% CO 2 . The cells were suspended with 1 ml of lysis buffer [50 mM HEPES-KOH (pH 7.9), 250 mM KCl, 2 mM MgCl 2 , 0.5 mM dithiothreitol (DTT), 0.5% Triton X-100, and 1 × Complete ethylenediaminetetraacetic acid-free protease inhibitor cocktail (Roche Life Science)] and lysed by sonication. The lysate was centrifuged twice at 20,000 × g for 20 min at 4°C to remove cell debris. The supernatant was immunoprecipitated with 50 μl of a 50% slurry of anti-FLAG M2 agarose beads (Sigma-Aldrich). The beads were washed three times with lysis buffer, and NSUN2 was eluted from the beads at 4°C for 3 h in elution buffer [150 mM KCl, 10 mM Tris-HCl (pH 8.0), 20% Glycerol, 0.1 mM DTT and 200 μg/ml DYKDDDDK peptide (Fujifilm Wako Pure Chemical Corporation)]. Isolated NSUN2 was quantified based on the intensity of the corresponding band in an SDS-PAGE gel stained with SYPRO Ruby (Thermo Fisher Scientific), using BSA as a standard. In vitro m 5 C formation using NSUN2 Substrate mt-tRNA Ser(AGY) was transcribed in vitro with T7 RNA polymerase as described ( 45 ). Oligonucleotide sequences for preparation of template DNA are listed in Supplementary Table S1 . The transcript was run on a 10% denaturing PAGE gel, and the intact tRNA band was excised from the gel, followed by tRNA extraction. In vitro methylation was performed at 37°C for 2 h in 50 μl of a reaction mixture consisting of 20 mM HEPES-KOH (pH 8.0), 5 mM MgCl 2 , 100 mM KCl, 1 mM DTT, 0.5 μM mt-tRNA Ser(AGY) transcript, 0.5 μM NSUN2 and 1 mM S -adenosylmethionine (SAM). The tRNA was extracted with phenol and precipitated with ethanol. A 1.5 pmol aliquot of the tRNA was digested with RNase T 1 and subjected to LC/MS analysis to detect m 5 C-containing fragments.
Fluorescence microscopy
HeLa cells grown on poly-L-lysine-coated coverslips were incubated in 5% CO 2 at 37°C for 1 h with 5 μM MitoTracker Red CMXRos (Molecular Probes) or 200 nM MitoBright Red (Dojindo) in DMEM. The cells were washed with phosphate-buffered saline (PBS), fixed with 3.7% formaldehyde in PBS for 10 min at room temperature, permeabilized with 0.5% Triton X-100 in PBS for 10 min at room temperature, blocked with 2% FBS in PBS for 30 min at room temperature and incubated at room temperature for 1 h with anti-NSUN2 antibody (1:500; Sigma-Aldrich HPA037896) or anti-TFAM antibody (1:500; Abnova E7031) diluted in Can Get Signal solution A (Toyobo). After three washes in PBS, the cells were incubated at room temperature for 1 h with Cy2/Cy3-conjugated anti-mouse or anti-rabbit secondary antibody (1:50; Millipore AP182C). After three washes in PBS, the cells were mounted in 97% 2,2′-thiodiethanol containing 2% 1,4-diazabicyclo[2.2.2]octane. For 5-bromouridine (BrU) labeling, HeLa cells on coverslips were incubated with 2.5 mM BrU for 20 min prior to fixation. Anti-BrU antibody (1:50; Roche 11170376001) and anti-NSUN2 antibody were used to detect BrU-labeled RNA and NSUN2, respectively. Secondary antibodies conjugated with Alexa fluor 555 (1:1000; Invitrogen A-21422) and Alexa fluor 488 (1:1000; Invitrogen A-11008) were subsequently used, respectively. The coverslips were observed using a confocal microscope (FV3000; Olympus) equipped with a 60× oil -immersion objective lens (Olympus, PLAPON 60xOSC2, NA1.40). Images were acquired using the FluoView software (Olympus) and processed using ImageJ ( 46 ). Super-resolution structured illumination microscopy (SR-SIM) Super-resolution imaging was performed on an ELYRA PS.1 microscope (Carl Zeiss) equipped with a 100× oil -immersion objective lens (Carl Zeiss, alpha Plan-Apochromat 100 × /1.46 Oil DIC M27 ELYRA) and EM-CCD camera (12.1 × 12.1 μm 2 field consisting of 256 × 256 pixels) as previously reported ( 47 ). To observe mitochondrial foci of NSUN2, 20 Z-series images were obtained at 100 nm intervals with the 561 and 481 nm lasers, and SIM images were calculated using default settings with theoretically predicted point-spread function parameters. For channel alignment, 0.2 μm multicolored beads (TetraSpec Microspheres, Thermo Fisher) immobilized on a sample coverslip were imaged using the same acquisition settings, and the resultant images were used to correct for chromatic shifts between color channels. Images were processed using the ZEN software (Carl Zeiss).
Pulse labeling of mitochondrial protein synthesis
The pulse-labeling experiment was performed essentially as described ( 13 ). WT and NSUN2 KO HEK293T cells (2.0 × 10 6 ) were cultured at 37°C in 5% CO 2 for 10 min in methionine-, glutamine- and cysteine-free DMEM (Gibco) supplemented with 2 mM L-glutamine, 10% FBS and 50 μg/ml emetine (to inhibit cytoplasmic protein synthesis). The cells were then supplemented with 7.4 MBq of [ 35 S] methionine and [ 35 S] cysteine (EXPRE 35 S 35 S Protein Labeling Mix, [ 35 S]-, PerkinElmer) and incubated for 1 h to specifically label newly synthesized mitochondrial proteins. Cell lysates (50 μg total proteins) were resolved by tricine–SDS-PAGE (16.5%), and the gel was CBB stained and dried on a gel drier (AE-3750 RapiDry, ATTO). Radiolabeled mitochondrial protein products were visualized using an imaging plate (BAS-MS2040, Fujifilm) on an FLA-7000 imaging system. Steady-state levels of subunit proteins in respiratory chain complexes Mitochondria were isolated from WT and NSUN2 KO HEK293T cells (1 × 10 7 ) using the Mitochondria Isolation Kit (Miltenyi Biotec). Steady-state levels of subunit proteins of mitochondrial respiratory chain complexes were analyzed by immunoblotting with Total OXPHOS Rodent WB Antibody Cocktail (1:250, ab110413, Abcam) and anti-mt-ND5 antibody (1:100, ab92624, Abcam). HRP-conjugated anti-mouse IgG (1:20,000, 715–035-150, Jackson ImmunoResearch) or HRP-conjugated anti-rabbit IgG (1:20,000, 715-035-152, Jackson ImmunoResearch) was used as the secondary antibody. Resazurin-based cell proliferation assay WT, NSUN2 KO and NSUN3 KO HEK293T cells were seeded on 96-well plates (1.0 × 10 5 cells/well) and cultured in glucose-free DMEM (Gibco) containing 10% FBS, 1% PS, 1 mM sodium pyruvate, and 4% glucose or in glucose-free DMEM (Gibco) containing 10% FBS, 1% PS, 1 mM sodium pyruvate and 4% galactose. On each day, 1/10 volume of 1 mM resazurin solution in PBS was added to each well and incubated for 3 h. Absorbance was measured at 570 and 600 nm on a microplate reader (SpectraMax Paradigm, Molecular Devices). The reduction rate of resazurin was calculated using the following equation: documentclass[12pt]{minimal} usepackage{amsmath} usepackage{wasysym} usepackage{amsfonts} usepackage{amssymb} usepackage{amsbsy} usepackage{upgreek} usepackage{mathrsfs} setlength{oddsidemargin}{-69pt} begin{document} }{}$$begin{eqnarray*}&&% ,{rm{reduced}},{rm{of}},{rm{resazurin}} nonumber \ && = left{ {left( {{{rm{E}}_{{rm{ox}}}}{rm{2}} times {rm{A1}}} right) - left( {{{rm{E}}_{{rm{ox}}}}{rm{1}} times {rm{A2}}} right)} right}/left{ {left( {{{rm{E}}_{{rm{red}}}}{rm{1}} times {rm{C2}}} right) - left( {{{rm{E}}_{{rm{red}}}}{rm{2}} times {rm{C1}}} right)} right}, end{eqnarray*}$$end{document} where E ox 1 = molar extinction coefficient (E) of oxidized (ox) resazurin at 570 nm = 80 586, E ox 2 = E of oxidized resazurin at 600 nm = 117 216, E red 1 = E of reduced (red) resazurin at 570 nm = 155 677, E red 2 = E of reduced resazurin at 600 nm = 14 652, A1 = absorbance of measured well at 570 nm, A2 = absorbance of measured well at 600 nm, C1 = absorbance of blank well (medium and resazurin only) at 570 nm and C2 = absorbance of blank well at 600 nm.
Supplementary Material gkz575_Supplemental_Files Click here for additional data file.
📊 Figures
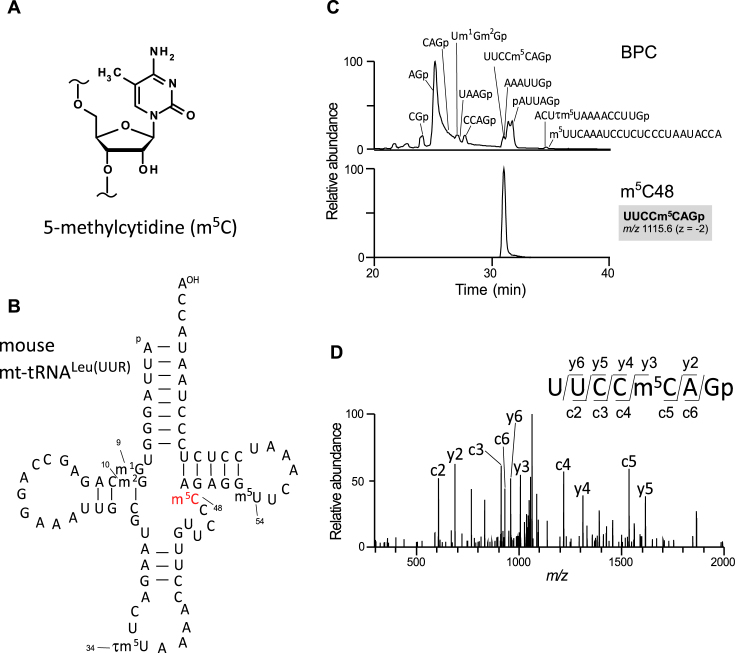
Figure 1.
mt-tRNAs contain m 5 C in the extra loop. ( A ) Chemical structure of 5-methylcytidine (m 5 C). ( B ) Secondary structure of mouse mitochondrial tRNA Leu(UUR) with modified nucleosides: 1-methylguanos...
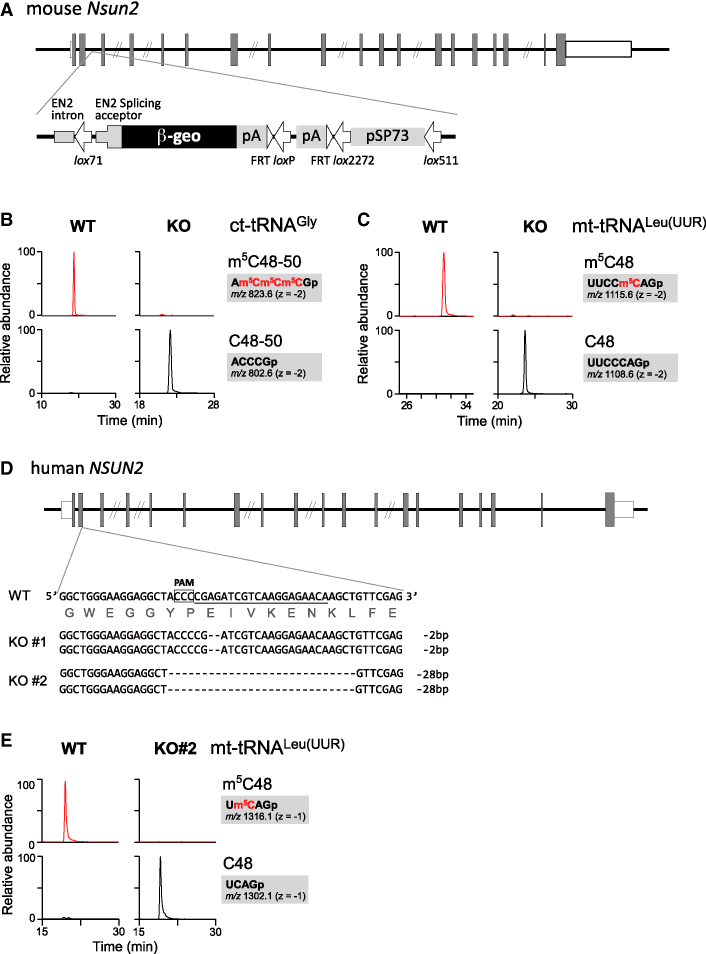
Figure 2.
NSUN2 is responsible for m 5 C formation in mt-tRNAs ( A ) Schematic depiction of the mouse Nsun2 gene with the insertion site of the gene trap cassette containing the u03b2-geo marker. Shaded boxes, ...
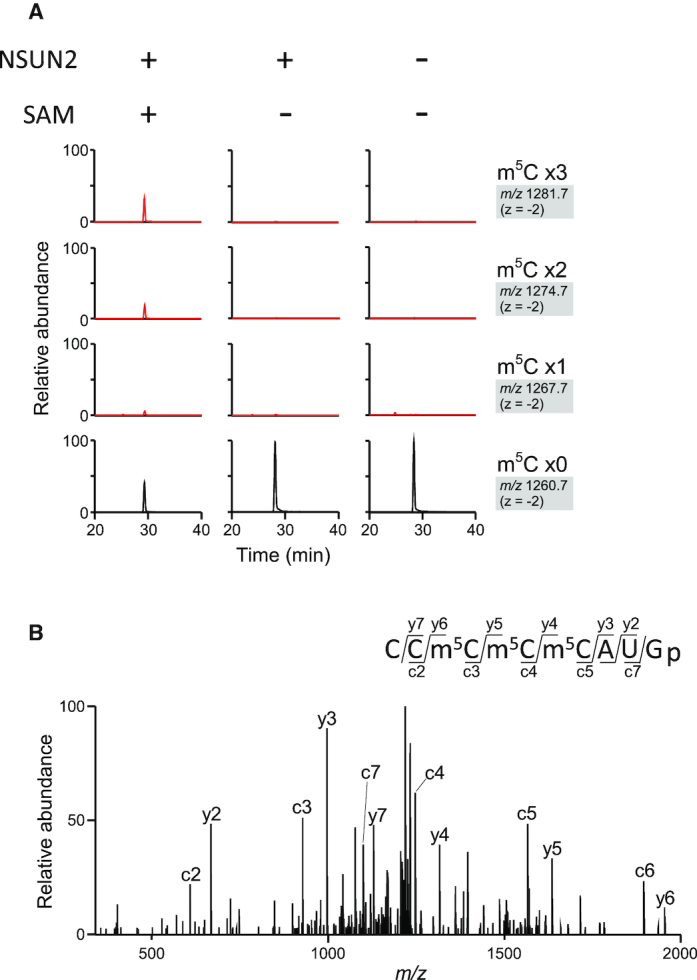
Figure 3.
In vitro reconstitution of m 5 C on mt-tRNA ( A ) NSUN2-mediated m 5 C formation on the human mt-tRNA Ser(AGY) transcript in the presence or absence of recombinant NSUN2 and SAM. XICs of RNase T 1 -di...
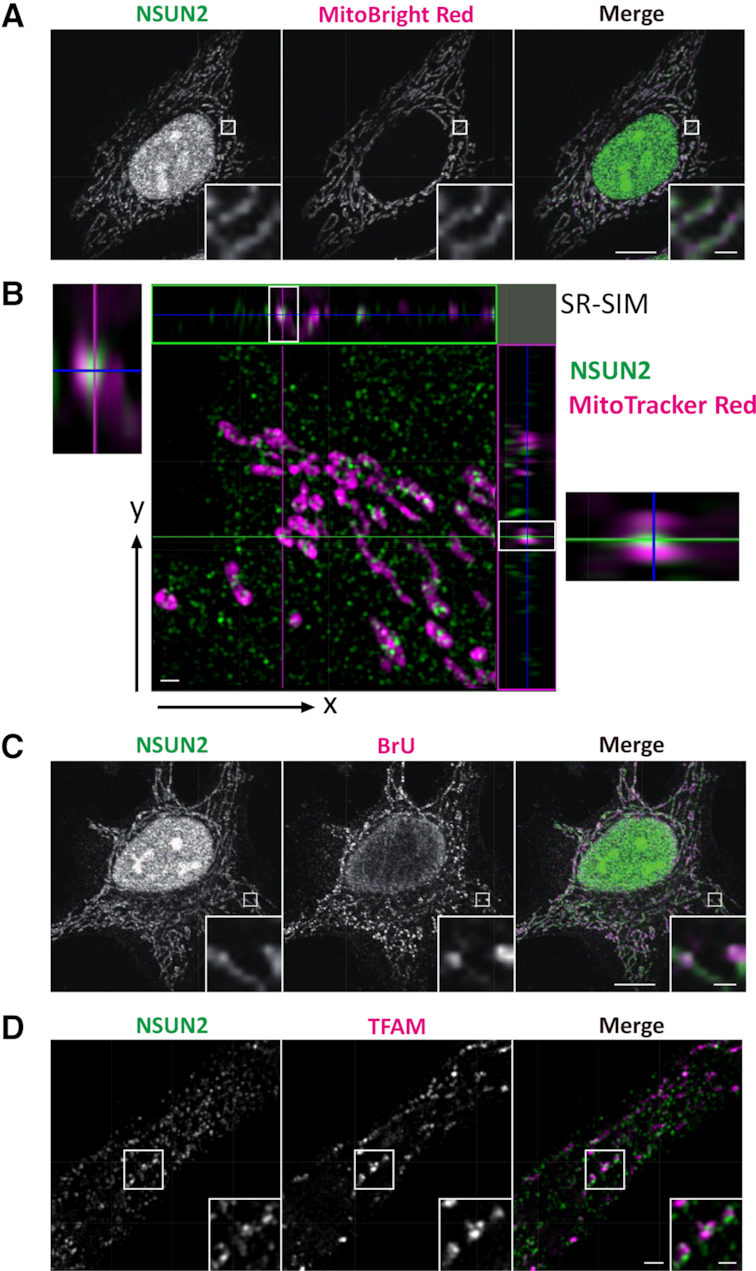
Figure 4.
Subcellular localization of endogenous human NSUN2 ( A and B ) Subcellular localization of human NSUN2 in HeLa cells showing NSUN2 (green) and MitoBright Red (magenta) (A) or MitoTracker Red (magenta)...
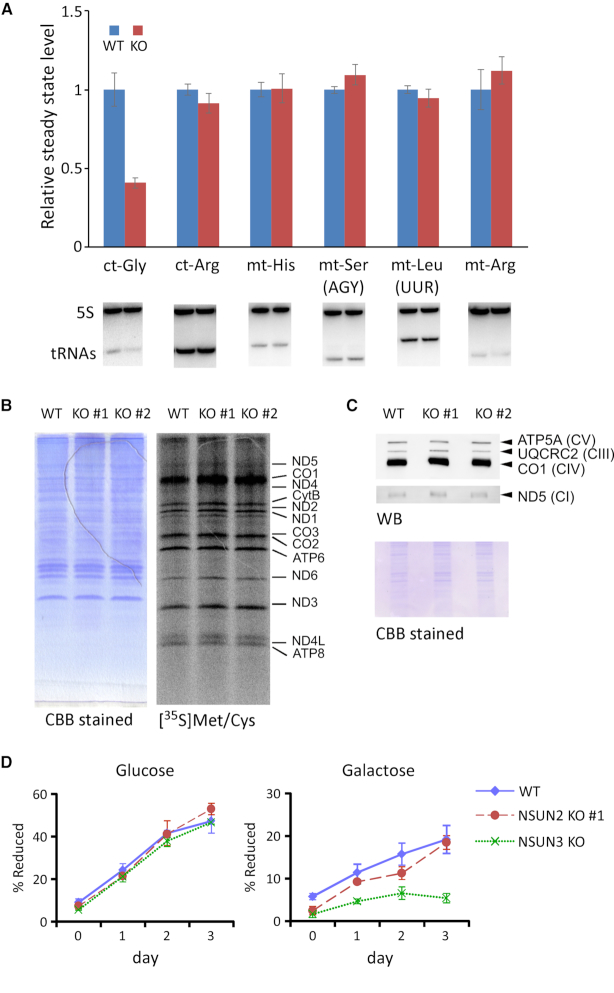
Figure 5.
Mitochondrial translation and respiratory activity in NSUN2 KO cells ( A ) northern blotting of ct-tRNAs and mt-tRNAs in total RNA from WT and Nsun2 u2212/u2212 (KO) mouse liver (lower panels). Bar gr...
Figure images are served from the NIH/NLM PubMed Central Open Access Subset or Europe PMC; copyright remains with the publishers and authors.
💬 Discussion
0 commentsNo comments yet. Be the first to start a discussion!
Leave a Comment