Abstract
SummaryAccurate distance measurement in 3D confocal microscopy is important for quantitative analysis, volume visualization and image restoration. However, axial distances can be distorted by both the point spread function (PSF) and by a refractive‐index mismatch between the sample and immersion liquid, which are difficult to separate. Additionally, accurate calibration of the axial distances in confocal microscopy remains cumbersome, although several high‐end methods exist. In this paper we present two methods to calibrate axial distances in 3D confocal microscopy that are both accurate and easily implemented. With these methods, we measured axial scaling factors as a function of refractive‐index mismatch for high‐aperture confocal microscopy imaging. We found that our scaling factors are almost completely linearly dependent on refractive index and that they were in good agreement with theoretical predictions that take the full vectorial properties of light into account. There was however a strong deviation with the theoretical predictions using (high‐angle) geometrical optics, which predict much lower scaling factors. As an illustration, we measured the PSF of a correctly calibrated point‐scanning confocal microscope and showed that a nearly index‐matched, micron‐sized spherical object is still significantly elongated due to this PSF, which signifies that care has to be taken when determining axial calibration or axial scaling using such particles.
🔬 Techniques
🔭 Microscopes
✨ Fluorophores
🧪 Sample Preparation
🏭 Microscope Brands
🧪 Reagent Suppliers
💻 Software Details
🏛️ Research Organizations (ROR)
Affiliated research institutions:
📋 Methods
Calibration cell construction and FTIR measurement
To calibrate the axial distances in a point-scanning confocal microscope, we built a custom sample cell with standard glass cover slips (Menzel Gläzer). The glass cover slips had a RI ( ) close to the RI of the oil-immersion liquid (Type F, Leica, ) used for imaging. We avoided using glass capillaries (Vitrocom), often used in confocal studies on colloidal systems, since they provide lower quality imaging which is partially due to their manufacturing process and also due to the RI ( = 1.47). We used a standard No. 1.0 coverslide, which has a thickness between 130 and 160 μm, as specified by the manufacturer (Menzel Gläzer). Although standard confocal microscopy objectives are optimized for a cover slip thickness of 170 μm (Pawley, 2006 ) and therefore a No. 1.5 cover slip (thickness 160-190 μm) would have been more accurate, we could not however completely image our cell (with a height ∼ 80 μm), due to the limited working distance of the high numerical aperture objectives that we used. As spacers, we used No. 00 cover slips (thickness 55–80 μm) and the individual components of the cell were permanently fixed onto a standard microscopy slide (Menzel Gläzer) with UV glue (Norland 68 Optical Adhesive), see Figure 1 (A). The resulting height of the cell H was measured with a Fourier Transform Infrared (FTIR) spectrometer, with a selected diameter aperture of 0.25 mm (Vertex 70, Bruker). To avoid additional interference effects from the top cover slip itself, a drop of immersion oil was carefully placed on top of the cell before the measurement. The thickness and irregularities of the much thicker microscopy slide (∼ 1 mm) made it not necessary to correct for its interference effects. Figure 1 Construction and measurement of a calibration cell. (A) A sample cell with height H was built with glass cover slips and a standard microscopy slide, glued together with UV-glue. (B) When the (empty) cell was placed in a Fourier Transform Infrared (FTIR) spectrometer, Fabry Perrot (FP) fringes were visible in the transmission spectrum. (C) The height of the cavity ( μm) was determined from the spacing between the FP fringes (Jiang et al. , 1999 ). The error-bars on individual points are smaller than the symbol size. 50 μm PMMA spheres We used large poly(methyl methacrylate) (PMMA) spheres as a second method for calibration. The spheres had an average diameter σ = 50 μm and large polydispersity (> 10%, Altuglas, BS150N). To fluorescently dye the particles, we first prepared (rhodamine isothiocyanate)-aminostyrene (RAS) dye following the method described by Bosma et al . (Bosma et al. , 2002 ). Then, we saturated a quantity of acetone (99%, Merck, USA) with RAS and subsequently centrifuged the saturated acetone at high speed to sediment undissolved dye. The acetone was then added to dodecane (99%, Sigma-Aldrich, USA) to give a 10 wt% solution of acetone. In this mixture, 50 wt% undyed PMMA particles and 0.35 wt% azo-bis-isobutyronitrile (98%, Acros) were suspended in a glass vial. The reaction mixture was heated up to 83°C and left to react for approximately 1 day. During this reaction, RAS molecules become chemically bonded with unreacted PMMA-ends at the surface of the particle. The vial was left open, so acetone could evaporate. The dyed particles were washed with hexane and dried under vacuum. Afterwards, the particles were suspended in a 24 wt% mixture of cis-decahydronaphthalene (cis-decalin, 99%, Sigma-Aldrich) in cyclohexylbromide (CHB, 98%, Sigma-Aldrich). The RI of this mixture was = 1.490, as measured with a refractometer (Atago 3T). This solvent mixture closely matched the RI of the particles, based on the fact that the RI is close to that of the bulk material [ = 1.491 (Kasarova et al. , 2007 )] and that the particles hardly scattered when viewed under bright-field illumination. As a measure of shape uniformity, we determined the ellipticity of a small ensemble of particles suspended in 24 wt% cis-decalin in CHB. To this end, we fitted an ellipse to a binarized confocal microscopy image of the particles' equator using ImageJ software (Rasband, 1997-2014 ). We measured the aspect ratio , with b the major and a the minor axis of the ellipse. For a total of 18 particles we found 0.002.
Show full methods section
Calibration cell construction and FTIR measurement
To calibrate the axial distances in a point-scanning confocal microscope, we built a custom sample cell with standard glass cover slips (Menzel Gläzer). The glass cover slips had a RI ( ) close to the RI of the oil-immersion liquid (Type F, Leica, ) used for imaging. We avoided using glass capillaries (Vitrocom), often used in confocal studies on colloidal systems, since they provide lower quality imaging which is partially due to their manufacturing process and also due to the RI ( = 1.47). We used a standard No. 1.0 coverslide, which has a thickness between 130 and 160 μm, as specified by the manufacturer (Menzel Gläzer). Although standard confocal microscopy objectives are optimized for a cover slip thickness of 170 μm (Pawley, 2006 ) and therefore a No. 1.5 cover slip (thickness 160-190 μm) would have been more accurate, we could not however completely image our cell (with a height ∼ 80 μm), due to the limited working distance of the high numerical aperture objectives that we used. As spacers, we used No. 00 cover slips (thickness 55–80 μm) and the individual components of the cell were permanently fixed onto a standard microscopy slide (Menzel Gläzer) with UV glue (Norland 68 Optical Adhesive), see Figure 1 (A). The resulting height of the cell H was measured with a Fourier Transform Infrared (FTIR) spectrometer, with a selected diameter aperture of 0.25 mm (Vertex 70, Bruker). To avoid additional interference effects from the top cover slip itself, a drop of immersion oil was carefully placed on top of the cell before the measurement. The thickness and irregularities of the much thicker microscopy slide (∼ 1 mm) made it not necessary to correct for its interference effects. Figure 1 Construction and measurement of a calibration cell. (A) A sample cell with height H was built with glass cover slips and a standard microscopy slide, glued together with UV-glue. (B) When the (empty) cell was placed in a Fourier Transform Infrared (FTIR) spectrometer, Fabry Perrot (FP) fringes were visible in the transmission spectrum. (C) The height of the cavity ( μm) was determined from the spacing between the FP fringes (Jiang et al. , 1999 ). The error-bars on individual points are smaller than the symbol size. 50 μm PMMA spheres We used large poly(methyl methacrylate) (PMMA) spheres as a second method for calibration. The spheres had an average diameter σ = 50 μm and large polydispersity (> 10%, Altuglas, BS150N). To fluorescently dye the particles, we first prepared (rhodamine isothiocyanate)-aminostyrene (RAS) dye following the method described by Bosma et al . (Bosma et al. , 2002 ). Then, we saturated a quantity of acetone (99%, Merck, USA) with RAS and subsequently centrifuged the saturated acetone at high speed to sediment undissolved dye. The acetone was then added to dodecane (99%, Sigma-Aldrich, USA) to give a 10 wt% solution of acetone. In this mixture, 50 wt% undyed PMMA particles and 0.35 wt% azo-bis-isobutyronitrile (98%, Acros) were suspended in a glass vial. The reaction mixture was heated up to 83°C and left to react for approximately 1 day. During this reaction, RAS molecules become chemically bonded with unreacted PMMA-ends at the surface of the particle. The vial was left open, so acetone could evaporate. The dyed particles were washed with hexane and dried under vacuum. Afterwards, the particles were suspended in a 24 wt% mixture of cis-decahydronaphthalene (cis-decalin, 99%, Sigma-Aldrich) in cyclohexylbromide (CHB, 98%, Sigma-Aldrich). The RI of this mixture was = 1.490, as measured with a refractometer (Atago 3T). This solvent mixture closely matched the RI of the particles, based on the fact that the RI is close to that of the bulk material [ = 1.491 (Kasarova et al. , 2007 )] and that the particles hardly scattered when viewed under bright-field illumination. As a measure of shape uniformity, we determined the ellipticity of a small ensemble of particles suspended in 24 wt% cis-decalin in CHB. To this end, we fitted an ellipse to a binarized confocal microscopy image of the particles' equator using ImageJ software (Rasband, 1997-2014 ). We measured the aspect ratio , with b the major and a the minor axis of the ellipse. For a total of 18 particles we found 0.002.
Confocal microscopy measurements
The confocal microscopy measurements were all performed with a Leica SP2 or Leica SP8. All distance measurements were performed on 3D image stacks obtained in xyz -scanmode. Although a (single) vertical scan obtained in xzy -mode is a fast method to view vertical slices through the sample, the obtained distances are in general not accurate and were avoided for any quantitative measurement. Imaging of the empty calibration cell was performed with a 20x/0.7 air-objective (Leica), all other measurements were performed with a 100x/1.4 oil-immersion confocal objective (Leica). The largest measurement error is introduced by the top cover slip being under a small angle with respect to the microscopy glass slide (see Fig. 1 A), despite careful application of the UV glue. Because we cannot place the sample in exactly the same position after its first measurement, we measured the height gradient in the x - and y -direction and found that the largest slope was 1.9 μm/mm. Assuming that it is possible to place the sample in its original position within 0.3 mm accuracy, a rough estimate of the error on the confocal height measurements is ∼ 0.6μm. We therefore chose our pixel-size in the axial direction to roughly half of this value. For the axial-scaling measurements, we used solvents of increasing RI: immersion oil (Type F, Leica, ), cyclohexylchloride (CHC, >98%, Merck, = 1.463), dodecane (>99%, Sigma-Aldrich, ) and de-ionized water (Millipore system, ). The first three (apolar) solvents were saturated with pyrromethene-567 dye (excitation maximum nm, Excition, USA) whereas the water was saturated with fluorescein isothiocyanate (FITC, isomer I, 90%, Sigma-Aldrich). Undissolved dye was removed by centrifugation. Also, a small amount of sterically stabilized PMMA tracer particles (Bosma et al. , 2002 ) (diameter σ = 2.07 μm, polydispersity 3%), which often stick to untreated glass, was added to the apolar solvents to accurately determine the top and bottom of the cell. Because the volume fraction of the PMMA tracer particles is ≪ 1 %, their contribution to the effective RI of the sample can be neglected. Solvents were removed from the sample cell with nitrogen flow and the cell was flushed three times with the new solvent before the sample was carefully placed on the marked area under the confocal microscope to record a new image-stack. The image-stacks of the calibration cell were all recorded on a Leica SP2 with a 488 nm laser and a scan speed of 1000 Hz. The voxel-size of the image stacks was 293 × 293 × 311 nm 3 . The typical total volume of the images stacks was 38 × 38 × 115 μm 3 . Images of the large PMMA spheres (σ = 50 μm) were recorded on a Leica SP8 with a 543 nm laser line, voxel-size 51 × 51 × 168 nm 3 and total volume 52.8 × 52.8 × 54.1 μm 3 .
PSF measurement and deconvolution
To suppress the effect of the PSF, we deconvolved the 3D confocal microscopy data-stacks of the spherical particles. All deconvolutions were performed using commercially available software (Huygens Professional 4.4, Scientific Volume Imaging) using the classic maximum likelihood estimation restoration method (van der Voort & Strasters, 1995 ). For the deconvolution of the image-stack of the large PMMA sphere (σ = 50 μm), we used a depth-dependent theoretical PSF that takes into account the (small) RI-mismatch between sample and immersion fluid (van der Voort & Strasters, 1995 ). For the deconvolution of the 200 nm and 1040 nm particles, we used a measured PSF, obtained using fluorescent polystyrene spheres with diameter nm, polydispersity 5% and excitation maximum λ = 441 nm (YG Fluoresbrite Microparticles, Polysciences). The polystyrene particles (bulk material = 1.592 (Kasarova et al. , 2007 )) were dried on a cover glass (Menzel Gläzer, No. 1.5) and subsequently a drop of immersion oil (Type F, Leica, = 1.516) was placed on the glass slide to (nearly) index-match the particles. The sample was then placed on a microscopy slide with glass spacers and sealed with UV glue (Norland 68 Optical Adhesive). Images of the beads were recorded with an inverted confocal microscope (Leica SP8) with a 100x/1.4 oil immersion objective (Leica) in combination with a Hybrid detector. To gain enough statistics, confocal image-stacks of 8 different spheres were recorded with (sub)Nyquist sampling rate (18.2 × 18.2 × 83.9 nm 3 ). Because these particles are only approximate point-sources, the PSF was obtained by iterative deconvolution with a 200 nm bead object (van der Voort & Strasters, 1995 ). Additionally, we imaged poly(methyl methacrylate) (PMMA) spheres with diameter σ = 1040 nm and a polydispersity δ = 3%, as determined with static light scattering (SLS). The particles were sterically stabilized with poly(12-hydroxystearic acid) (PHS) grafted onto the PMMA backbone which was chemically attached to the core of the particles and covalently labelled with fluorescent 4-methylaminoethylmethacrylate-7-nitrobenzo-2-oxa-1,3-diazol (NBD-MAEM) dye for imaging (Bosma et al. , 2002 ). With the measured PSF, we deconvolved image-stacks of both the fluorescent polystyrene spheres ( nm) and of the larger PMMA spheres (σ = 1040 nm) that were dried on a glass cover slip (Menzel Glazer, No. 1.5) and subsequently immersed in immersion oil (Type F, Leica). The particles were imaged within one hour of sample preparation. We acquired images stacks with voxel-size 5.4 × 5.4 × 41.96 nm 3 and 18.75 × 18.75 × 83.9 nm 3 , respectively, using a 100x/1.4 oil objective and a 488 nm laser-line selected from a white light laser.
📊 Figures
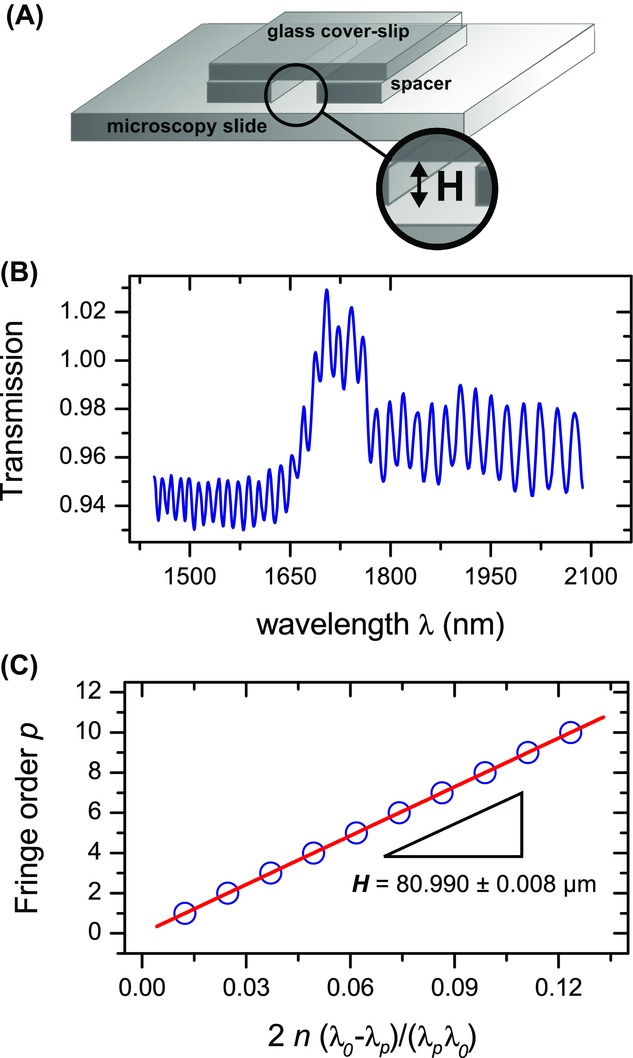
Figure 1
Construction and measurement of a calibration cell. (A) A sample cell with height H was built with glass cover slips and a standard microscopy slide, glued together with UV-glue. (B) When the (empty) ...
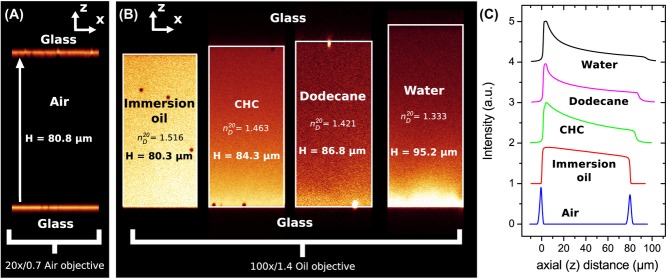
Figure 2
Axial distances measured with confocal microscopy. (A) The empty calibration cell with u03bcm was measured in confocal reflection mode (Leica SP2) with a 20x/0.7 air-objective (Leica), which resulted ...
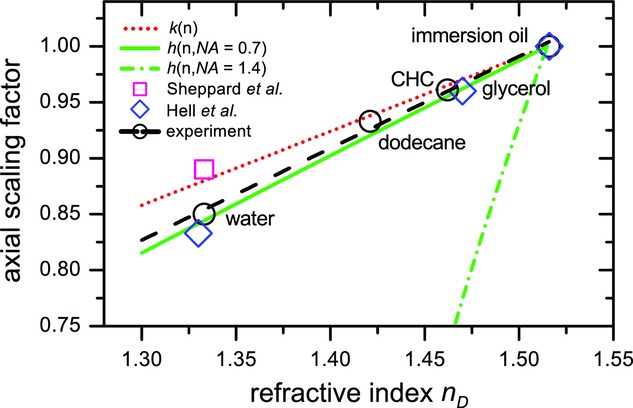
Figure 3
Axial scaling factors as a function of the sample refractive index . Our measurements are indicated with black open circles, which were fitted with the dashed (black) line. The (green) continuous and ...
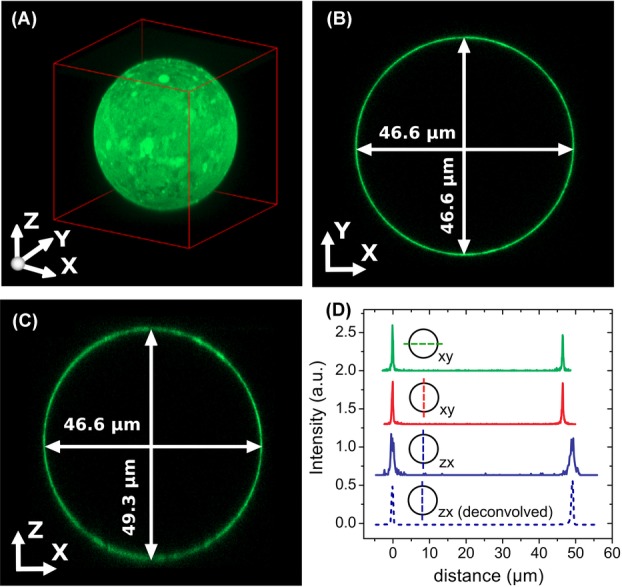
Figure 4
A fluorescent PMMA sphere dispersed in an index matching mixture of 24 wt% cis-decalin in CHB, recorded with a confocal microscope (Leica SP8). (A) 3D view constructed from a XYZ image stack. (B) A si...
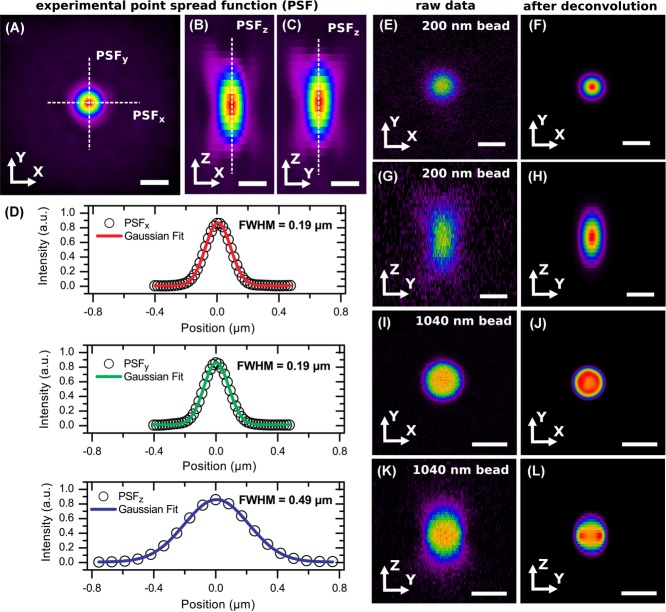
Figure 5
Experimental measurement of the point spread function (PSF) and imaging of single fluorescent beads. Images were recorded with a 100x/1.4 oil immersion objective. (A) The PSF in the XY plane. Intensit...
Figure images are served from the NIH/NLM PubMed Central Open Access Subset or Europe PMC; copyright remains with the publishers and authors.
💬 Discussion
0 commentsNo comments yet. Be the first to start a discussion!
Leave a Comment