Abstract
The degradation of phagosomes, derived from the ingestion of photoreceptor outer segment (POS) disk membranes, is a major role of the retinal pigment epithelium (RPE). Here, POS phagosomes were observed to associate with myosin-7a, and then kinesin-1, as they moved from the apical region of the RPE. Live-cell imaging showed that the phagosomes moved bidirectionally along microtubules in RPE cells, with kinesin-1 light chain 1 (KLC1) remaining associated in both directions and during pauses. Lack of KLC1 did not inhibit phagosome speed, but run length was decreased, and phagosome localization and degradation were impaired. In old mice, lack of KLC1 resulted in RPE pathogenesis that was strikingly comparable to aspects of age-related macular degeneration (AMD), with an excessive accumulation of RPE and sub-RPE deposits, as well as oxidative and inflammatory stress responses. These results elucidate mechanisms of POS phagosome transport in relation to degradation, and demonstrate that defective microtubule motor transport in the RPE leads to phenotypes associated with AMD.
🔬 Techniques
🔭 Microscopes
🧬 Organisms
💻 Software
✨ Fluorophores
🧪 Sample Preparation
🔬 Cell Lines
🏭 Microscope Brands
🧪 Reagent Suppliers
📷 Detectors
🔎 Objectives
💻 Software Details
🏛️ Research Organizations (ROR)
Affiliated research institutions:
📋 Methods
Animals
All procedures conformed to institutional animal care and use authorizations. The Klc1 −/− mutant mice ( Rahman et al., 1999 ) and WT littermates originated from a colony that was on the C57BL/6J background, as used in a previous study ( Stokin et al., 2005 ). In the Klc1 −/− mutant mice, an exon that encoded a 72–amino acid sequence starting at QHSDSSA and ending at NILALVY was removed, resulting in out of frame translation of the remainder of the KLC1 gene ( Rahman et al., 1999 ). Initial microscopy studies were performed on mice from this original colony. Later studies included mice from two separate colonies, both of which were derived from this original colony: one colony was the result of one or two backcrosses to C57BL/6NHsd (Harlan Laboratories, Inc.); and the other resulted from a cross with outbred HSD non-Swiss albino mice (Harlan Laboratories, Inc.), and subsequent breeding of the F1 generation (which provided more robust litters, with a greater proportion of surviving Klc1 −/− pups, than the inbred colony). For RPE primary cell studies, pigmented animals were chosen to facilitate cell isolation. In all cases, mating was established as heterozygous × heterozygous pairs, thus yielding homozygous mutant and WT controls, as well as heterozygous littermates. Homozygous mutants were distinguished from the WT controls by genotyping, as described previously ( Rahman et al., 1999 ). Mice were kept on a 12-h light/12-h dark cycle under 10–50-lux fluorescent light during the light cycle.
Show full methods section
Animals
All procedures conformed to institutional animal care and use authorizations. The Klc1 −/− mutant mice ( Rahman et al., 1999 ) and WT littermates originated from a colony that was on the C57BL/6J background, as used in a previous study ( Stokin et al., 2005 ). In the Klc1 −/− mutant mice, an exon that encoded a 72–amino acid sequence starting at QHSDSSA and ending at NILALVY was removed, resulting in out of frame translation of the remainder of the KLC1 gene ( Rahman et al., 1999 ). Initial microscopy studies were performed on mice from this original colony. Later studies included mice from two separate colonies, both of which were derived from this original colony: one colony was the result of one or two backcrosses to C57BL/6NHsd (Harlan Laboratories, Inc.); and the other resulted from a cross with outbred HSD non-Swiss albino mice (Harlan Laboratories, Inc.), and subsequent breeding of the F1 generation (which provided more robust litters, with a greater proportion of surviving Klc1 −/− pups, than the inbred colony). For RPE primary cell studies, pigmented animals were chosen to facilitate cell isolation. In all cases, mating was established as heterozygous × heterozygous pairs, thus yielding homozygous mutant and WT controls, as well as heterozygous littermates. Homozygous mutants were distinguished from the WT controls by genotyping, as described previously ( Rahman et al., 1999 ). Mice were kept on a 12-h light/12-h dark cycle under 10–50-lux fluorescent light during the light cycle.
Cell culture
RPE primary cells were isolated from mouse retinas as described previously ( Gibbs and Williams, 2003 ). In brief, intact eyes were removed from 9–15-d-old mice and washed twice in DMEM (high glucose). They were then incubated with 2% (wt/vol) dispase in DMEM (high glucose) for 45 min at 37°C. The eyes were washed twice in growth medium (GM) that consisted of DMEM (high glucose) plus 10% bovine FBS, 1% penicillin/streptomycin, 2.5 mM l -glutamax, and 1× MEM nonessential amino acids. All the reagents were from Invitrogen. After removal of the anterior cornea, lens, capsule, and iris-pigmented epithelium, the resulting posterior eyecups were incubated in GM for 20 min at 37°C. The neural retina was removed, and sheets of RPE were then peeled off from Bruch’s membrane, washed, and then cultured. For live-cell imaging, cells were cultured on 24-well Transwell filter inserts (Corning) and imaged in a closed bath chamber (RC-43C; Warner Instruments) or cultured and imaged in 8-well coverglass chambers (LABTEK; Thermo Fisher Scientific) in complete GM.
ARPE-19 cells
(ATCC), from an immortalized human RPE cell line, were maintained in DMEM/F12 (Invitrogen), supplemented with 10% FCS (Invitrogen) and 1% penicillin-streptomycin liquid containing 10,000 U penicillin and 10 mg streptomycin in 0.85% saline (Invitrogen). For live-cell imaging, they were grown in glass-bottom Petri dishes (MatTek Corporation). All cells were maintained at 37°C with an atmosphere of 5% CO 2 .
POS phagocytosis in cell culture
POS isolation WT Mouse POSs were isolated using an OptiPrep (Sigma-Aldrich) step gradient in a method that was modified from Tsang et al. (1998) . Mice were dark adapted overnight. Retinas were removed and placed in buffer A (130 mM NaCl, 3.6 mM KCl, 2.4 mM MgCl 2 , 1.2 mM CaCl 2 , 0.02 mM EDTA, and 10 mM Hepes, adjusted to pH 7.4 with KOH), with six to eight retinas/milliliter, on ice, under infrared illumination, and homogenized with 6–10 strokes using a 2-ml glass pestle. After brief centrifugation (100 g , 1 min), 0.75 ml supernatant was added to the top of each gradient that contained 0.75-ml steps of 8, 10, and 15% OptiPrep in buffer A in 4-ml centrifuge tubes. The tubes were centrifuged for 20 min at 12,000 g at 4°С in a swinging bucket rotor (HB-6; Sorvall) without braking. POSs were collected from the 10–15% interface, diluted threefold with buffer A, and centrifuged for 10 min at 10,000 g at 4°C. The pellet containing the POSs was resuspended with GM, and the concentration of intact POSs was determined with a hemocytometer under phase microscopy. POSs were used directly or labeled with Texas red-X, or Fluorescent red 646 reactive (Sigma-Aldrich), or Alexa Fluor 647 NHS ester (succinimidyl ester) according to the manufacturer’s instructions. After incubation with the dyes for 1 h at 4°C, POSs were pelleted at 7,500 rpm for 5 min and washed extensively with buffer A. The final pellet was resuspended in RPE GM. For studies on ARPE19 cells, POSs were obtained from frozen bovine retinas that were thawed in buffer A, vortexed for 40 s, and processed as for mouse POSs, using OptiPrep step gradients. POS degradation assay Primary RPE cells on Transwell filters were incubated with 150 µl POS solution (10 7 POSs/ml) at 37°C and 5% CO 2 . Cells were then washed extensively with PBS and either processed immediately for immunofluorescence analysis (pulse time point) or chased for appropriate periods of time, and then processed for immunofluorescence. Bound and ingested POSs were identified and distinguished from each other, as described previously ( Gibbs et al., 2003 ). In brief, cells were washed three times in PBS and blocked in blocking buffer (PBS plus 1% goat serum), and the bound (but not ingested) POSs were labeled with rabbit anti-RHO polyclonal antibody (pAb01; Liu et al., 1999 ), followed by an Alexa Fluor 568–nm-conjugated goat anti–rabbit antibody (Molecular Probes) for 1 h. Cells were then washed three times in PBS and permeabilized with 50% ethanol for 5 min at RT, and incubated with pAb01 again, followed by an Alexa Fluor 488–nm-conjugated secondary antibody (Molecular Probes) to label both bound and ingested POSs. The Transwell filters were excised and mounted with FLUORO-GEL (Electron Microscopy Sciences).
Immunofluorescence of phagosomes and motor proteins
RPE primary cells were isolated as described above and kept for 3 d in culture. Cells were fed POSs for 15 min and then fixed with buffered 4% formaldehyde for 15 min and then 50% ethanol for 5 min. After incubation with blocking solution (0.5% BSA in PBS, pH 7.4) for 45 min at RT, cells were incubated with primary antibodies for 1 h at RT in blocking buffer. To test for motor association in relation to location of phagosomes, two methods were used, using pigmented (from C57BL6 mice) or albino (from BalbC mice) cells. In one method, the POSs were prelabeled with the dye, Fluorescent red 646 reactive (Sigma-Aldrich), to permit phagosome identification, and the cells were double labeled with mouse anti-MYO7A mAb (clone 138-1; Developmental Studies Hybridoma Bank) and rabbit anti-KCL1 pAb (Santa Cruz Biotechnology, Inc.). In the other method, POS phagosomes were identified by immunolabeling, using a mixture of RHO mAb1D4 and 4D2, and the apical region of the RPE cells was identified by phalloidin-TRITC. Rabbit anti-MYO7A pAb2.2 ( Liu et al., 1997 ) and rabbit anti-KCL1 pAb (Santa Cruz Biotechnology, Inc.) were used on separate filters of cells. To test for motor association of RHO mAb1D4-labeled phagosomes, cells were double labeled with the mAb1D4, together with the MYO7A pAb2.2 or the KCL1 pAb. After primary antibody incubation, cells were washed and incubated with Alexa Fluor–conjugated secondary antibodies for 45 min at RT and mounted with FLUORO-GEL (Electron Microscopy Sciences). Western blot analysis The RPE-choroid was isolated from WT and Klc1 −/− mouse eyes and lysed in 20 mM Tris, pH 7.4, 5 mM MgCl 2 , 10 mM NaCl, 1 mM DTT, and 1× protease inhibitors (Sigma-Aldrich). Equivalent amounts of sample were run on a 4–12% NuPAGE Bis-Tris gel (Invitrogen). After transfer, membranes were blocked with Odyssey blocking buffer (LI-COR; Lincoln) and probed with rabbit anti-calnexin (Enzo Life Sciences), rabbit anti-KIF5B (Abcam), rabbit anti-KLC1 (Santa Cruz Biotechnology, Inc.), and mouse anti-GAPDH (EMD Millipore). Goat anti–mouse IRDye 680, donkey anti–rabbit 680, or donkey anti–rabbit 800 secondary antibody (LI-COR; Lincoln) was used. Membranes were imaged with the Odyssey infrared imaging system (LI-COR; Lincoln).
Imaging of phagosome motility
RPE primary cultures from WT and Klc1 −/− animals were incubated with POSs that had been labeled with Texas red-X or Fluorescent red 646 reactive (Sigma-Aldrich), or Alexa Fluor 647 NHS ester, a succinimidyl esterthat reacts almost exclusively with amines (Life Technologies). Phagosomes were then imaged using a spinning disk confocal microscope system (UltraVIEW ERS; PerkinElmer) containing a microscope (Axio Observer.A1; Carl Zeiss) fitted with an environment chamber. Time-lapse images were acquired with a 40× NA1.3 oil objective and a camera (C9100-50; Hamamatsu Photonics) using Volocity software. 3D time-lapse images were acquired with a 63× NA1.4 oil objective and a camera (C11440-22CU; Hamamatsu Photonics) using Volocity software. Images were processed using Volocity or ImageJ software. For imaging in a single plane, cells were grown in eight-well coverglass chambers (LABTEK; Thermo Fisher Scientific) or glass-bottom Petri dishes (MatTek Corporation) to facilitate clearer imaging. For 3D imaging, cells were grown on Transwell filters or glass chambers coated with matrigel, and stacks of images were taken at different planes along the z axis for each time point. The imaging period began 20 min after the addition of POSs and continued for no more than 60 min. Cells were transfected with the following constructs: p EGFPN1 (Takara Bio Inc.); pcDNA3-m KLC1A - YFP (provided by S. Encalada and L. Goldstein, University of California, San Diego, La Jolla, CA); p TUBA1A-GFP (OriGene); p EGFPN-EB1 (provided by M. Seabra, Imperial College London, London, England, UK); or pEGFPN-EB3 (provided by E. Colin and F. Perez, Institute Curie, Paris, France), using Lipofectamine LTX (Invitrogen) or Fugene HD (Roche). All constructs were sequenced to confirm identity before use.
Phagosome tracking analysis
Data on the trajectories of POS phagosomes were acquired and analyzed using Volocity software. Phagosomes were tracked for 3 min, and analysis was performed on those with a net displacement ≥2 µm and a diameter of 0.8–1.4 µm. Data were obtained from three WT and three Klc1 −/− independent RPE primary cultures, grown in coverglass chambers. Definitions of tracking terms are as follows: track, the trajectory of a phagosome, covering a 3-min interval, and represented by its X and Y coordinate series; net displacement (in micrometer), distance between starting and ending points of a 3-min track; track segment, a period of uninterrupted movement, where the phagosome did not pause or change direction (by >135°); segmental speed (in micrometer/second), the distance of a track segment divided by the time taken; plus end segmental velocity (in micrometers/second), segmental velocity when the organelle is moving toward the periphery of the cell and away from the nucleus; minus end segmental velocity (in micrometers/second), segmental velocity when the organelle is moving toward the nucleus of the cell; reversal, direction changes by >135° and the displacement along the new direction is at least 1 µm; run length (in micrometers), the distance moved by a phagosome, without changing direction by >135°. Statistical analyses were performed on Prism 4 (GraphPad), and one-tailed Mann–Whitney’s test or paired Student’s t test was used for phagosome tracking analysis. In vivo retinal analysis Light and EM The posterior half of each eye was fixed by immersion in EM-grade 2% glutaraldehyde plus 2% formaldehyde (Electron Microscopy Sciences) in 0.1 M cacodylate buffer, postfixed in 1% OsO 4 , and processed for embedment in epon-812. Photoreceptor cell counts were obtained from images of dorso-ventral semithin (0.7 mm) sections stained with toluidine blue. Regions that were 0.2-mm apart, beginning at the optic nerve head, were identified. In each region, at least three representative columns of photoreceptor cell nuclei were identified. When the photoreceptor nuclei line up in a column, it is a good indication that the retinal section is aligned vertically, and the vertical packing density of the nuclei is defined. The number of photoreceptor nuclei in each column was used to determine the thickness of the outer nuclear layer (ONL). Ultrastructural analysis was performed with ultrathin sections (70 nm), stained with uranyl acetate and lead citrate, using regions of the retina, where the POSs were in complete longitudinal section. Some retinas were processed by the OTAP postfixation method. After fixation with 2% glutaraldehyde plus 2% formaldehyde in 0.1 M cacodylate buffer, the tissues were postfixed with 1% OsO 4 in 0.1 M sodium cacodylate buffer (2.5 h), 1% tannic acid (30 min), 1% sodium NaSO 4 (5 min), 70% ethanol (three times for 5 min), and 1% paraphenylenediamine in 70% ethanol (30 min), and then processed for embedment in epon-812. Microtubule decoration was performed according to a published procedure ( Euteneuer and McIntosh, 1980 ; Troutt and Burnside, 1988 ). In brief, eyes were dissected into eyecups, and the sensory retina and the RPE/choroid was flat mounted and cut into 2-mm 2 pieces. Those pieces were incubated in permeabilization buffer with tubulin (0.5 M Pipes buffer, pH 6.9, 1 mM MgCl 2 , 1 mM EGTA, 1 mM GTP, 1% Triton X-100, 0.5% deoxycolate, 0.2% SDS, 2.5% DMSO, and 1.8 mg/ml tubulin) at 0°C for 30 min (to prevent polymerization of tubulin during the initial permeabilization), followed by an incubation at RT for 15 min and then at 37°C for 15 min to promote free tubulin assembly into hooks. Tissue squares were then rinsed in 0.1 M cacodylate buffer and processed for EM as indicated previously. Microtubule polarity was assessed by the direction of curvature of hooks attached to microtubules in micrographs taken from sections perpendicular to the apical-basal axis of RPE cells, from the apical side toward the basal side. Hook curvature is directly related to microtubule polarity. A clockwise hook indicates that the observer is looking toward the minus end of the microtubule, whereas a counterclockwise hook indicates that one is looking toward the plus end. Sub-RPE deposits were quantified with sections representing at least four animals of each genotype (WT and mutant). For each animal, four images corresponding to the central region of the retina (within 1 mm of the optic nerve) were evaluated. The areas of the basal laminar deposits and the membranous debris were quantified relative to the length of the RPE spanning the analyzed areas. For phagosome quantification, 70-nm dorso-ventral sections were collected from the region within 1.4 mm of the optic nerve. Phagosomes derived from outer segment shedding were identified by their characteristic structure (disk membrane presence). The adherens junctions were used to define the limit of the apical region of the RPE. For Light microscopy, we used a microscope (Axiophot; Carl Zeiss) with a 63× NA1.4 oil objective (Carl Zeiss) and a color camera (CoolSnap-Pro; Photometrics). Images were collected with Image-Pro Express software (Media Cybernetics). For the EM and immunoEM study, we used a transmission electron microscope (EM910; Carl Zeiss) with a KeenView camera (Olympus), and images were collected with iTEM 5.0 software (Olympus). For immunoEM, eyes were embedded in LR White (Electron Microscopy Sciences), and 70-nm sections were collected on grids and labeled, as described previously ( Lopes et al., 2011 ). In brief, sections were blocked with 5% BSA in TBS-T, incubated with primary antibodies, followed by 12-nm conjugated secondary antibodies (Jackson ImmunoResearch Laboratories, Inc.), postfixed with 2% glutaraldehyde, and stained. Statistical analysis was performed on Prism 5 (GraphPad), and two-tailed Student’s t tests were used to test the probability of no significant difference between mutant and control samples.
Fluorescence microscopy
The posterior half of each eye from ∼P30 mice was fixed by immersion in 4% formaldehyde in PBS; washed in PBS; cryoprotected in 15, 20, and 30% sucrose solutions in PBS; and then embedded in OCT compound (Sakura). Dorso-ventral cryosections (10–12-µm thick) were blocked in 5% normal goat or donkey serum in PBS, incubated with primary antibody solutions overnight at 4°C, and then washed in PBS and stained with secondary antibodies for 1 h at RT in the dark. RPE flat mounts, or whole mounts of retinas from P30 mice, were fixed by immersion in 4% formaldehyde in PBS or in cold methanol, washed in PBS, and processed for immunolabeling as indicated previously. Alternatively, eyes were embedded in paraffin and processed and stained as described previously ( Lopes et al., 2010 ). The following primary antibodies were used: polyclonal rabbit anti-CTSD (provided by D. Bok, University of California, Los Angeles, Los Anegeles, CA; Bosch et al., 1993 ), anti-MDA (1:3,000; Abcam), anti–C5b-9 (1:100; Abcam), anti-fibronectin (1:200; Abcam), anti–β-tubulin (1:100; Cell Signaling Technology), anti-PARD3 (1:250; EMD Millipore), goat anti-C3d (1:50; R&D Systems), monoclonal rat anti-C3 (1:50; Hycult), mouse anti-acetylated tubulin (1:200; Sigma-Aldrich), anti–α-tubulin (1:200; Sigma-Aldrich), anti-Centrin3 (provided by U. Wolfrum, University of Mainz, Mainz, Germany), and anti-EB1 (1:100; BD). The secondary antibodies used were goat anti–rabbit, goat anti–mouse, donkey anti–goat, or donkey anti–rat IgG conjugated to Alexa Fluor 594 (Molecular Probes). Antibodies were prepared in 5% goat or donkey serum and 0.5% Triton X-100 in PBS. Sections were mounted using Fluorogel II with DAPI (Electron Microscopy Sciences) and analyzed on a confocal microscope (FluoView 1000; Olympus), with a 60× NA1.40 oil objective, using FluoView FV10-ASW 3.1 software (Olympus). Autofluorescence was detected using an excitation wavelength of 488 nm and an emission wavelength of 500–600 nm. Sections from control or mutant mice were imaged under identical conditions. Quantification of fluorescence levels was performed on grayscale 16-bit TIFF images with ImageJ 1.43 software (National Institutes of Health). ImageJ was also used for stack projections and orthogonal projections. Statistical analysis was performed on Prism 5 (GraphPad), and two-tailed Student’s t tests were used to test the probability of no significant difference between mutant and control samples. STED super-resolution microscopy, using a confocal system (TCS SP5 STED; Leica) with an oil-immersion objective (HCX PL APO CS 100×/1.40 NA STED), was also performed on sections labeled with tubulin antibodies. In this case, the secondary antibody labeling was performed with goat anti–mouse IgG conjugated to ATTO647N (Active Motif) for 1 h at RT in the dark. Sections were mounted using ProLong Gold (Life Technologies). Leica Application Suite Advanced Fluorescence acquisition software was used. Online supplemental material The supplemental figures provide additional images of microtubule organization in the RPE (Fig. S1) and pathology in aged Klc1 −/− mice (Fig. S3), and they show tracks of the phagosomes in each of three dimensions in WT RPE (Fig. S2). The videos show the following in RPE cells: the ingestion of POS phagosomes (Video 1), the movement of POS phagosomes along labeled microtubules (Video 2), the association of KLC1-YFP with motile phagosomes (Video 3), and two examples of the tracking of POS phagosomes (Videos 4 and 5). Online supplemental material is available at http://www.jcb.org/cgi/content/full/jcb.201410112/DC1 .
Online supplemental material The supplemental figures provide additional images of microtubule organization in the RPE (Fig. S1) and pathology in aged Klc1 −/− mice (Fig. S3), and they show tracks of the phagosomes in each of three dimensions in WT RPE (Fig. S2). The videos show the following in RPE cells: the ingestion of POS phagosomes (Video 1), the movement of POS phagosomes along labeled microtubules (Video 2), the association of KLC1-YFP with motile phagosomes (Video 3), and two examples of the tracking of POS phagosomes (Videos 4 and 5). Online supplemental material is available at http://www.jcb.org/cgi/content/full/jcb.201410112/DC1 .
📊 Figures
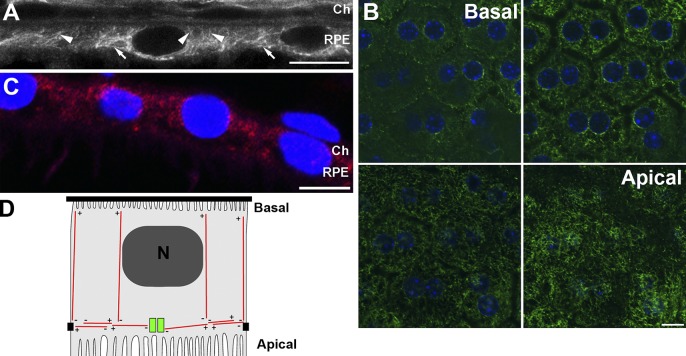
Figure 1.
Organization of microtubules in mouse RPE cells. (A) STED super-resolution microscopy image of a section of the RPE from an albino mouse, labeled with u03b1-tubulin antibodies. Arrowheads indicate ver...
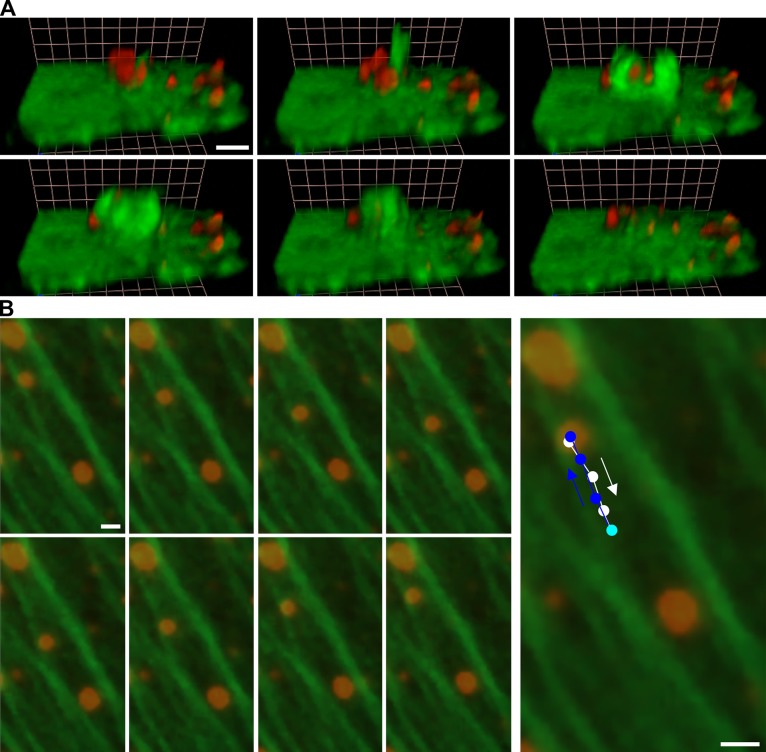
Figure 2.
Phagosome ingestion and transport. (A) Time-lapse of 3D-reconstructed images, showing the ingestion of POSs (red) at the apical surface of an RPE cell expressing GFP (green). Each subsequent image rep...
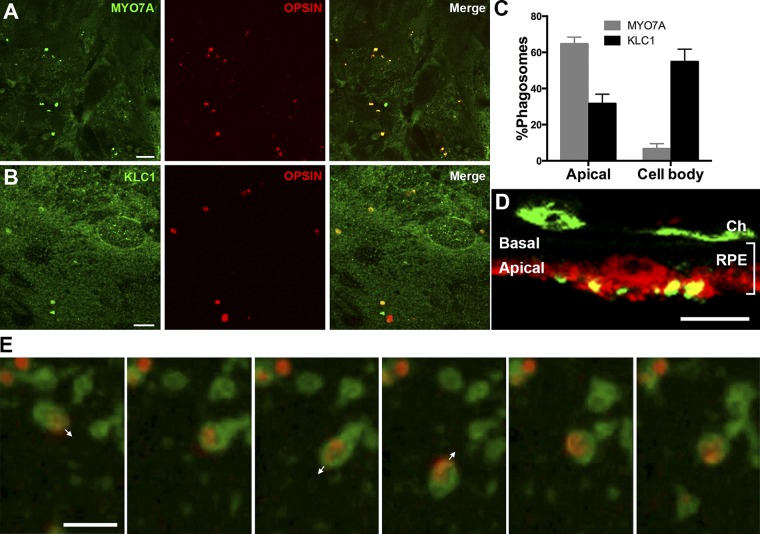
Figure 3.
Association of MYO7A and KLC1 with phagosomes. (A and B) Mouse primary RPE cells were fed with mouse POSs and immunolabeled with a RHO mAb (mAb1D4 in A, mAb4D2 in B; red) and a MYO7A (A) or KLC1 (B) p...
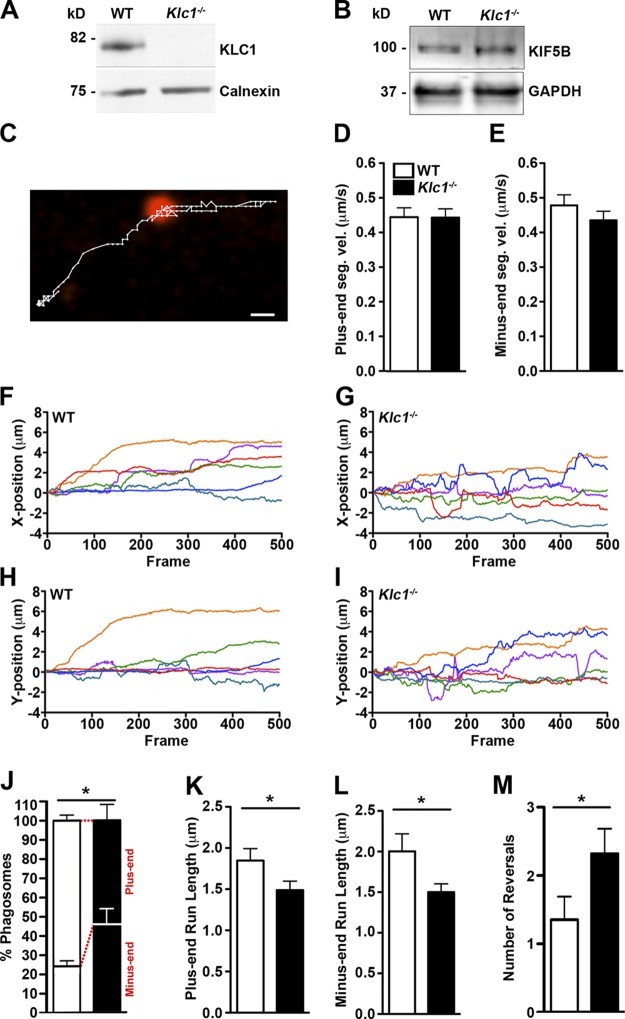
Figure 4.
Tracking of POS phagosomes in WT and Klc1 u2212/u2212 RPE cells. (A and B) Western blots of WT or Klc1 u2212/u2212 eyecups, probed for KLC1 (A) or KIF5B (B), with calnexin (A) or GAPDH (B) as a loadin...
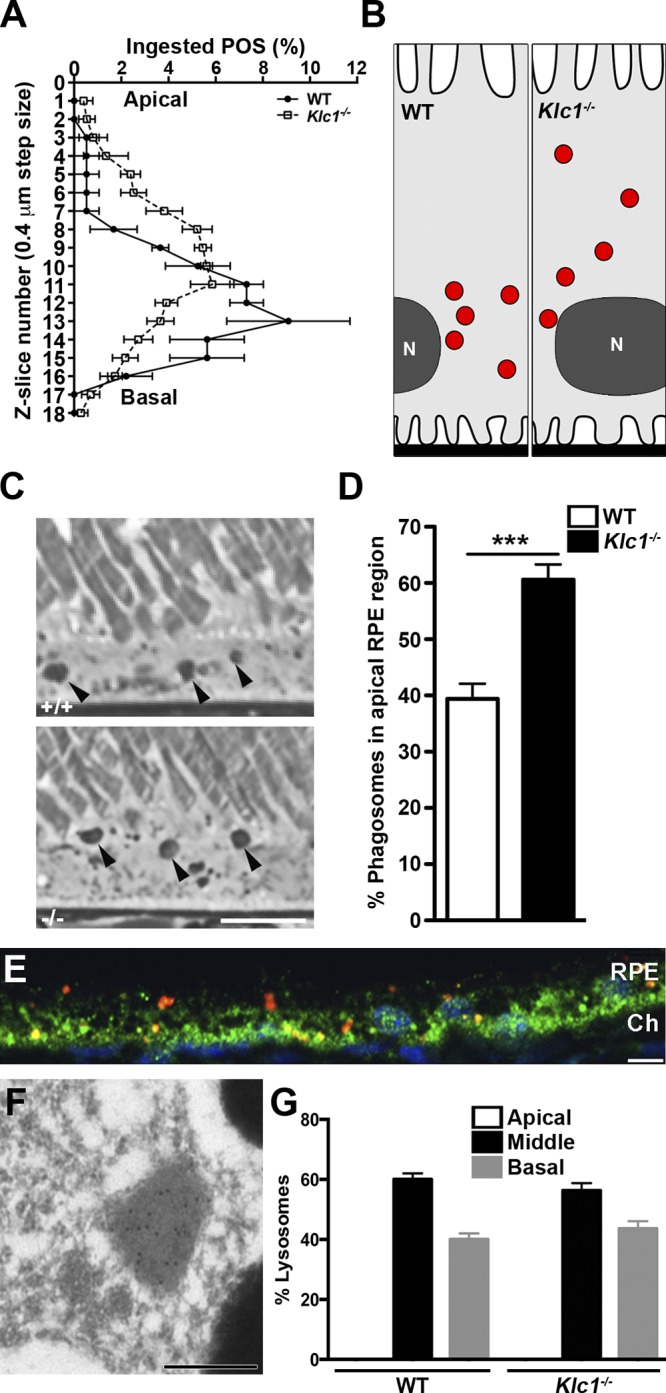
Figure 5.
Basal migration of POS phagosomes and lysosome localization. (A) Apical-basal distribution of ingested POSs in primary cultures of WT or Klc1 u2212/u2212 RPE cells, after 10-min incubation with purifi...
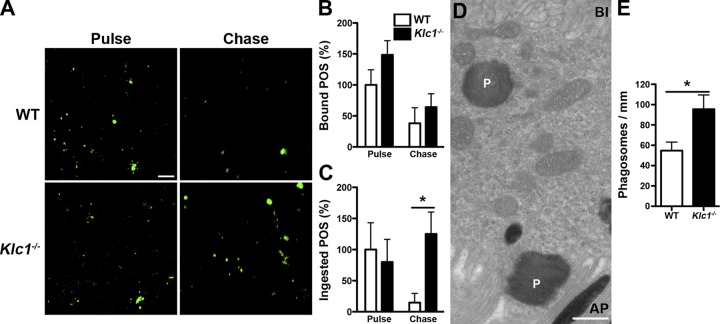
Figure 6.
POS phagosome degradation. (A) RPE cells isolated from WT or Klc1 u2212/u2212 mice, showing bound and ingested WT POSs, labeled with RHO antibody, from a 15-min pulse/30-min chase experiment. (B and C...
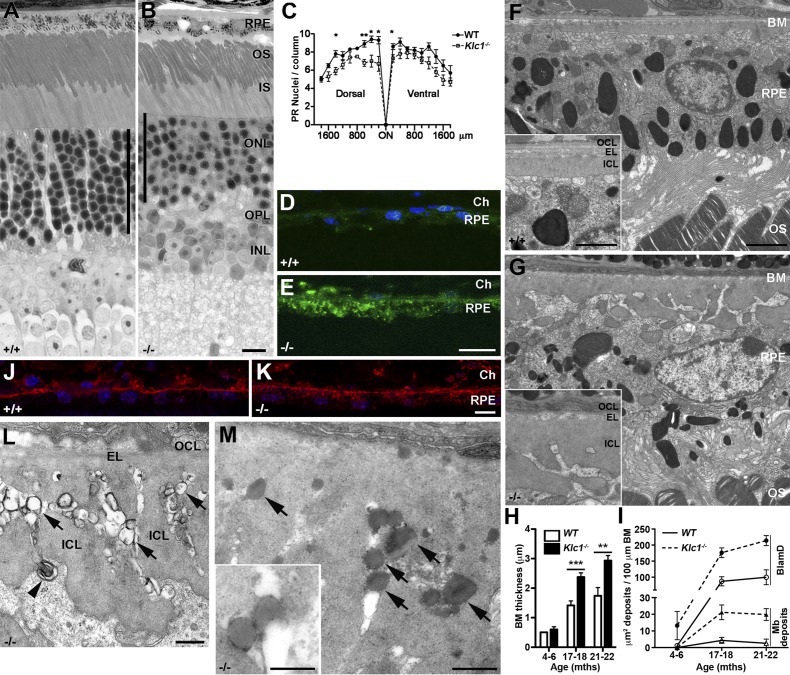
Figure 7.
Pathology in retinas of 18u201320-mo-old Klc1 u2212/u2212 mice. (A and B) Semithin sections of WT (A) and Klc1 u2212/u2212 (B) central retinas. The ONL (black bar) is thinner in the mutant. (C) Number...
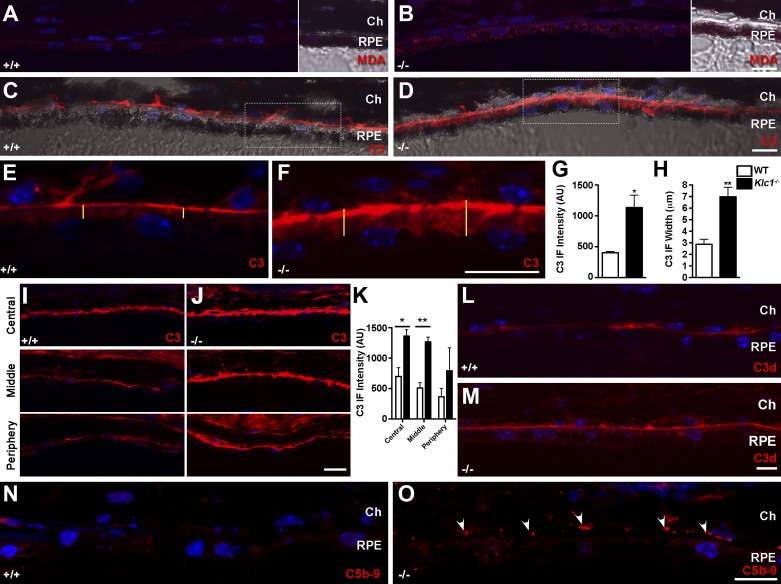
Figure 8.
Oxidative stress and complement activation associated with the RPE of 18u201320-mo-old Klc1 u2212/u2212 mice. (A and B) MDA immunoreactivity in WT (A) and Klc1 u2212/u2212 (B) retinal sections. Transm...
Figure images are served from the NIH/NLM PubMed Central Open Access Subset or Europe PMC; copyright remains with the publishers and authors.
💬 Discussion
0 commentsNo comments yet. Be the first to start a discussion!
Leave a Comment