Abstract
AbstractSuperresolution fluorescence microscopy of multiple fluorophores still requires development. Here we present simultaneous three-colour stimulated emission depletion (STED) nanoscopy relying on a single STED beam at 620 nm. Toggling the STED beam between two or more power levels (“multilevelSTED”) optimizes resolution and contrast in all colour channels, which are intrinsically co-aligned and well separated. Three-colour recording is demonstrated by imaging the nanoscale cytoskeletal organization in cultured hippocampal neurons. The down to ~35 nm resolution identified periodic actin/betaII spectrin lattices along dendrites and spines; however, at presynaptic and postsynaptic sites, these patterns were found to be absent. Both our multicolour scheme and the 620 nm STED line should be attractive for routine STED microscopy applications.
🔬 Techniques
💻 Software
✨ Fluorophores
🧪 Sample Preparation
🔬 Cell Lines
🏭 Microscope Brands
🧪 Reagent Suppliers
📷 Detectors
🔎 Objectives
💻 Software Details
🏛️ Research Organizations (ROR)
Affiliated research institutions:
📋 Methods
STED nanoscope STED pulses (620 nm, ~600 ps FWHM, 40 MHz) were delivered by a fibre laser (MPB Communications Inc., Montreal, Quebec, Canada). A part of the experiments were carried out with a Raman-shifted fibre laser (Rainbow prototype, IPG Photonics, Mountain View, CA, USA) operating at 618 nm with a repetition rate of 20 MHz (pulse width similar to the MPB laser). Both STED lasers provided similar results. Pulsed diode lasers (488 nm: PicoTA, Toptica Photonics, Graefelfing, Germany and PicoQuant, Berlin, Germany; 435 nm: LDH-D-C-430; 532 nm: LDH-P-FA-530, both PicoQuant) served as excitation light sources and were triggered by the STED laser. All lasers were spectrally filtered, passed through acousto-optical modulators (AOMs) and were subsequently coupled into polarization-maintaining single-mode fibres (exception: the MPB laser was not fibre-coupled). Fast alternation between two levels of the analogue voltage at the AOM defining the STED power was accomplished by home-built electronics. STED light was passed through a vortex phase-plate (VPP1a, RPC Photonics, Rochester, NY, USA, 620 nm vortex mask) giving rise to a doughnut-shaped focal spot. Beams were combined by dichroic mirrors and notch filters and coupled into the back aperture of an oil-immersion objective lens with NA 1.4 (HCX-PL-APO 100x/1.4-0.7 OIL CS, Leica Microsystems, Wetzlar, Germany). Scanning in the lateral directions was accomplished by a ‘Quad-Scanner’ 13 , which consists of four galvanometric scan mirrors. For fine focus control and scanning in the axial direction, the objective lens was moved by a piezo translator (z-piezo, Mipos 100PL CAP, Piezosystem Jena, Jena, Germany). The fluorescence light was collected by the same objective lens, de-scanned and separated from the laser light, and focussed onto a pinhole of variable size (MPH16, Thorlabs, Newton, NJ, USA). Depending on the sample, the pinhole diameter was varied between sizes corresponding to 0.7–1.0 times the Airy disk at this position. The transmitted fluorescence light was then further spectrally separated, filtered and focussed on two avalanche photodiodes (each SPCM-AQRH-13, Excelitas, Waltham, MA, USA). The detection was time-gated on the μs- and ns-timescale by home-built electronics and by an FPGA card (PCIe-7852R, National Instruments, Austin, TX, USA), respectively. Image acquisition and microscope control were performed with the software ImSpector (Max-Planck Innovation).
Show full methods section
STED nanoscope STED pulses (620 nm, ~600 ps FWHM, 40 MHz) were delivered by a fibre laser (MPB Communications Inc., Montreal, Quebec, Canada). A part of the experiments were carried out with a Raman-shifted fibre laser (Rainbow prototype, IPG Photonics, Mountain View, CA, USA) operating at 618 nm with a repetition rate of 20 MHz (pulse width similar to the MPB laser). Both STED lasers provided similar results. Pulsed diode lasers (488 nm: PicoTA, Toptica Photonics, Graefelfing, Germany and PicoQuant, Berlin, Germany; 435 nm: LDH-D-C-430; 532 nm: LDH-P-FA-530, both PicoQuant) served as excitation light sources and were triggered by the STED laser. All lasers were spectrally filtered, passed through acousto-optical modulators (AOMs) and were subsequently coupled into polarization-maintaining single-mode fibres (exception: the MPB laser was not fibre-coupled). Fast alternation between two levels of the analogue voltage at the AOM defining the STED power was accomplished by home-built electronics. STED light was passed through a vortex phase-plate (VPP1a, RPC Photonics, Rochester, NY, USA, 620 nm vortex mask) giving rise to a doughnut-shaped focal spot. Beams were combined by dichroic mirrors and notch filters and coupled into the back aperture of an oil-immersion objective lens with NA 1.4 (HCX-PL-APO 100x/1.4-0.7 OIL CS, Leica Microsystems, Wetzlar, Germany). Scanning in the lateral directions was accomplished by a ‘Quad-Scanner’ 13 , which consists of four galvanometric scan mirrors. For fine focus control and scanning in the axial direction, the objective lens was moved by a piezo translator (z-piezo, Mipos 100PL CAP, Piezosystem Jena, Jena, Germany). The fluorescence light was collected by the same objective lens, de-scanned and separated from the laser light, and focussed onto a pinhole of variable size (MPH16, Thorlabs, Newton, NJ, USA). Depending on the sample, the pinhole diameter was varied between sizes corresponding to 0.7–1.0 times the Airy disk at this position. The transmitted fluorescence light was then further spectrally separated, filtered and focussed on two avalanche photodiodes (each SPCM-AQRH-13, Excelitas, Waltham, MA, USA). The detection was time-gated on the μs- and ns-timescale by home-built electronics and by an FPGA card (PCIe-7852R, National Instruments, Austin, TX, USA), respectively. Image acquisition and microscope control were performed with the software ImSpector (Max-Planck Innovation).
Image acquisition and analysis
All power values stated in this work refer to the power entering the back aperture of the objective lens, meaning that the actually applied power is typically 10–30% lower due to losses at the optical interfaces presented by the objective lens and the sample. Linear unmixing was performed with the SpectralUnmixing plugin (rsbweb.nih.gov/ij/plugins/spectral-unmixing.html) of ImageJ (imagej.nih.gov/ij/) and was applied where indicated. The unmixing matrix was obtained from measurements with the same parameters on single-colour stainings. No deconvolution was performed. Cross-talks of colour channels were determined by calculating the average pixel counts normalized to the brightest channel. Where indicated, images were smoothed by convolution with a 1.0 pixel wide Gaussian using ImSpector. Some neuron images were rotated using bicubic interpolation in ImageJ. Line profiles were fit using the multi-peak fitting function in OriginPro2015. Pixel counts of repetitive scans along the fast scan axis were summed up and cumulative counts are reported. The imaging parameters for the data presented were as follows: Figure 1 : Customized DNA origami structures were obtained from GattaQuant, Braunschweig, Germany. (d) 10 scans along fast scan axis with 532 nm excitation (0.9 μW) + 620 nm STED (29 mW), detection with APD2. Pixel dwell time: 4.5 μs. Pixel size: 10 nm. (e) 8 scans along fast scan axis with 488 nm excitation (1.7 μW) + 620 nm STED (39 mW), detection with APD1 and APD2, and signals were summed. Pixel dwell time: 2 μs. Pixel size: 16.5 nm. (f) 3 scans along fast scan axis with 435 nm excitation (0.9 μW) + 620 nm STED (40 mW), detection with APD1 and APD2, and signals were summed. Pixel dwell time: 20 μs. Pixel size: 15 nm. Images smoothed by convolution with a 1.0 pixel wide Gaussian. Line profiles taken on raw image data, averaged over 2 or 3 pixels perpendicular to the direction of the profile. Figure 2: (a) Sequence along the fast scan axis: 3 scans with 488 nm excitation (1.7 μW) + 620 nm STED (36 mW), detection with APD1; 5 scans with 532 nm excitation (1.0 μW) + 620 nm STED (5 mW), detection with APD2. Pixel dwell time: 13 μs + 5 μs break. Frequency of repetitions along fast scan axis: 50 Hz. Progression along slow scan axis: 6.2 Hz. Pixel size: 30 nm. ( c ) Sequence along fast scan axis: 3 scans with 488 nm excitation (1.8 μW) + 620 nm STED (36 mW), detection with APD1; 3 scans with 532 nm excitation (1.0 μW) + 620 nm STED (15 mW), detection with APD2. Pixel dwell time: 7 μs + 5 μs break. Pixel size: 20 nm. Images were smoothed with 1.0 pixel wide Gaussian. Figure 3: (a,c) Sequence along fast scan axis: 3 scans with 532 nm excitation (1.7 μW) + 620 nm STED (15 mW), detection with APD2; 3 scans with 488 nm excitation (2.4 μW) + 620 nm STED (42 mW), detection with APD1 and APD2; 4 scans with 435 nm excitation (3.0 μW) + 620 nm STED (42 mW), detection with APD1. Pixel dwell time: 7 μs + 5 μs break. Pixel size: 25 nm. Images were linearly unmixed (see above) and smoothed with 1.0 pixel wide Gaussian. Cell Culture, transfection and labelling of living cells HeLa cells were plated on glass coverslips and transfected on the next day with a plasmid encoding a fusion of a fluorescent protein or Halo-tag with the protein of interest. About 24 h after transfection, cells were washed and imaged in HEPES-buffered Dulbecco’s modified Eagle’s medium (HDMEM) without phenol red. Cells transfected with a Halo-tag-containing plasmid were incubated in a 1 μM solution of 540R -Halo in DMEM for 20–30 min under growth conditions. After that, cells were washed in HDMEM and incubated for another 20–30 min in DMEM under growth conditions. Cells were imaged in HDMEM without phenol red.
Primary hippocampal neuron culture preparation
Cultures of hippocampal neurons were prepared from Wistar rats of mixed sex at postnatal day P0–P1 in accordance with Animal Welfare Law of the Federal Republic of Germany (Tierschutzgesetz der Bundesrepublik Deutschland, TierSchG) and the Regulation about animals used in experiments (1 st August 2013, Tierschutzversuchsverordnung). For the procedure of sacrificing rodents for subsequent preparation of any tissue, all regulations given in §4 TierSchG are followed. Since sacrificing of animals is not an experiment on animals according to §7 Abs. 2 Satz 3 TierSchG, no specific authorization or notification is required. Cells were plated on coverslips coated with 100 μg/mL polyornithine (Sigma-Aldrich, cat. P3655) and 1 μg/mL laminin (BD Bioscience, cat. 354232). Neuronal cultures were maintained in Neurobasal medium (Gibco, cat. 21103049) supplemented with 2% B27 serum-free supplement (Gibco, cat. 17504044), 2 mM L-glutamine (Gibco, cat. 25030) and pen/strep (100 units/mL and 100 μg/mL, respectively, BiochromAG, cat. A2213). On the day after plating, 5 μM cytosine β-D-arabinofuranoside (Sigma, cat. C1768) was added to the cultures. For this study, neuronal cultures at 17–30 days in vitro in which spines were fully developed were used. Immunostaining Cells were washed with PBS and fixed in 4% PFA in PBS (pH 7.4) for 20 min at room temperature (RT), quenched with NH 4 Cl and glycine (100 mM each) for 5 min, permeabilized with 0.1% Triton X-100 for another 5 min, and blocked with BSA 1% in PBS for 30 min. Both primary and secondary antibodies and phalloidin incubations were performed in PBS for 1 h at RT or overnight at 4 °C. Samples were mounted in Mowiol supplemented with DABCO. The antibodies used in this study are: anti-pan-neurofascin (UC Davis/NIH NeuroMab Facility, clone A12/18 cat. 75–172, 1:400 dilution); anti-betaII spectrin (BD Biosciences, cat. 612563, 1:400 dilution); anti-Homer 1 (Synaptic Systems, cat. 160 003, 1:200 dilution); anti-Bassoon (Synaptic Systems, cat. 141 003 and 141 004, 1:200 dilution); anti-mouse AlexaFluor488 (Invitrogen, cat. A11001, 1:200 dilution); anti-mouse STAR635 (Abberior, cat. 2-0002-002-0, 1:100 dilution). Anti-rabbit secondary antibody (Dianova, cat. 111-005-003) and anti-guinea-pig secondary antibody (Dianova, cat. 706-005-148) were custom-labelled with Atto430LS dye (AttoTech, cat. AD 430LS-31) or Atto490LS dye (AttoTech, cat. AD 490LS-31). Phalloidin was coupled to Atto532 (AttoTech, cat. AD 532-81, 1:100 dilution) or to STAR580 (Abberior, cat. 2-0205-005-6, 1:100 dilution).
📊 Figures
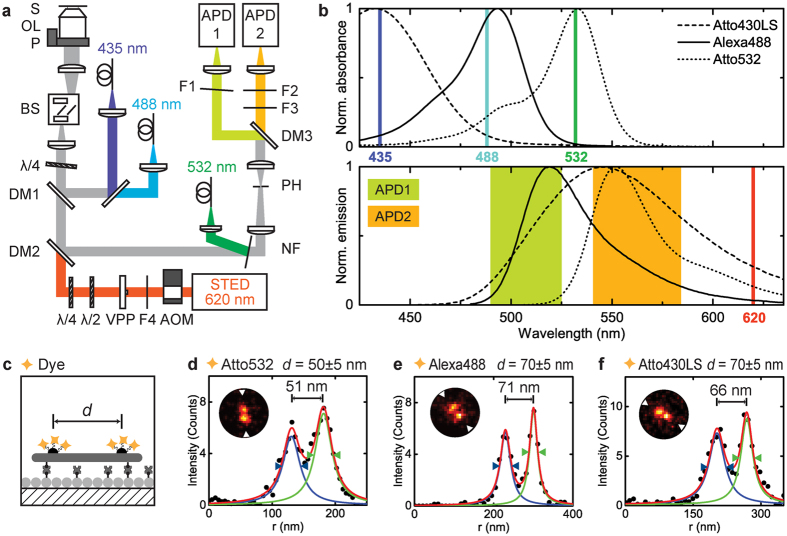
Figure 1
Setup and DNA origami imaging.
( a ) Schematic drawing of the main optical parts of the STED microscope: S Sample, OL objective lens, P z -piezo translator, BS beam scanner, u03bb/2 half-wave plate, u03bb/4 quarter-wave plate, DM d...
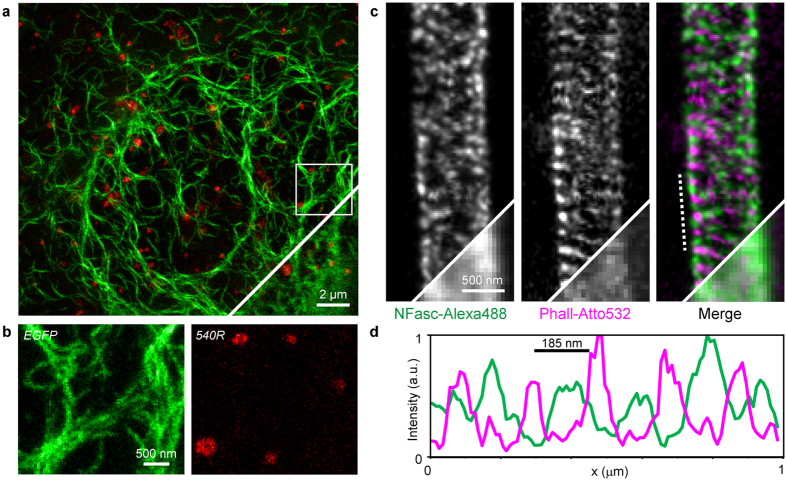
Figure 2
Dual-colour STED nanoscopy.
( a ) STED image of a living HeLa cell expressing vimentin-EGFP (green) and Pex3-Halo-tag stained with 540R -Halo (red). The confocal counterpart is shown in the lower-right corner. ( b ) Close-ups of...
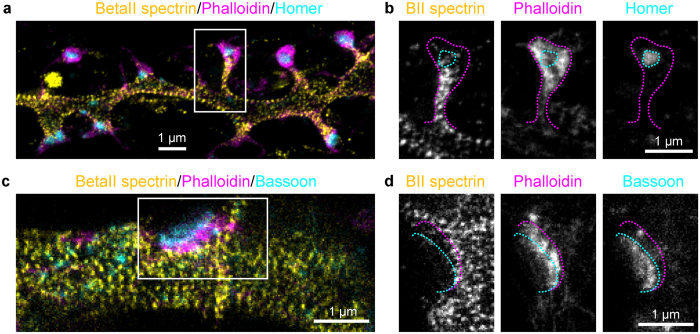
Figure 3
The subcortical periodic actin/betaII spectrin lattice is discontinued at synaptic sites.
( a ) Three-colour STED image of a dendrite decorated with spines and stained with betaII spectrin (AlexaFluor488, yellow), phalloidin (Atto532, magenta), and Homer (Atto430LS, cyan) shows the periodi...
Figure images are served from the NIH/NLM PubMed Central Open Access Subset or Europe PMC; copyright remains with the publishers and authors.
💬 Discussion
0 commentsNo comments yet. Be the first to start a discussion!
Leave a Comment