Abstract
Abstract Synapses contain hundreds of distinct proteins whose heterogeneous expression levels are determinants of synaptic plasticity and signal transmission relevant to a range of diseases. Here, we use diffusible nucleic acid imaging probes to profile neuronal synapses using multiplexed confocal and super-resolution microscopy. Confocal imaging is performed using high-affinity locked nucleic acid imaging probes that stably yet reversibly bind to oligonucleotides conjugated to antibodies and peptides. Super-resolution PAINT imaging of the same targets is performed using low-affinity DNA imaging probes to resolve nanometer-scale synaptic protein organization across nine distinct protein targets. Our approach enables the quantitative analysis of thousands of synapses in neuronal culture to identify putative synaptic sub-types and co-localization patterns from one dozen proteins. Application to characterize synaptic reorganization following neuronal activity blockade reveals coordinated upregulation of the post-synaptic proteins PSD-95, SHANK3 and Homer-1b/c, as well as increased correlation between synaptic markers in the active and synaptic vesicle zones.
🔬 Techniques
💻 Software
✨ Fluorophores
🧪 Sample Preparation
🔬 Cell Lines
🏭 Microscope Brands
🧪 Reagent Suppliers
📷 Detectors
💻 Software Details
💾 Data Repositories
🏛️ Research Organizations (ROR)
Affiliated research institutions:
📋 Methods
SMCC ssDNA conjugation of antibodies and phalloidin Twenty-five nmol of thiolated single-stranded DNA (ssDNA) (Integrated DNA Technologies) was reduced using 50 mM Dithiothreitol (DTT) for 2 h, purified using a NAP-5 column (GE Healthcare Life Sciences), and quantified using a NanoDrop 2000 (Thermo Fisher Scientific). In parallel, 100 μg of antibody was concentrated to 1 mg/mL using a 100 kDa Amicon Ultra 0.5 mL centrifugal column (EMD Millipore) and purified from additive chemicals such as sodium azide using a 7 kDa Zeba spin desalting column (Thermo Fisher Scientific). A freshly prepared solution of SMCC with 5% DMF (Sigma-Aldrich) in PBS was then added to react for 1.5 h with the antibody solution at a molar ratio of 7.5:1. Unreacted SMCC (succinimidyl 4-(N-maleimidomethyl)cyclohexane-1-carboxylate) was removed using a 7 kDa Zeba column. In a subsequent reaction, antibodies were mixed in a 1:15 molar ratio with the reduced thiolated ssDNA strands and incubated overnight at 4 °C to form stable thioether bonds. ssDNA-conjugated antibodies were then purified using a 100 kDa Amicon Ultra 0.5 mL column. The final protein concentration of the antibody was measured using a NanoDrop 2000 and the antibodies were stored at −20 °C in PBS with 50% glycerol. Amino-modified phalloidin (Bachem AG) was conjugated using the protocol described above with an extra step of HPLC purification to separate unreacted thiolated ssDNA and ssDNA-conjugated peptides. The optimal antibody concentration was empirically determined for each different conjugation batch. See Supplementary Tables 1 and 3 for antibody information. Site-specific ssDNA conjugation of antibodies The SiteClick antibody labeling system (Thermo Fisher Scientific) enables site-specific conjugation to four conserved glycan sites present on the Fc region of the heavy chains using copper-free click chemistry. Briefly, 100 μg of each antibody was concentrated to 2–4 mg/mL in azide-free Tris buffer and treated with β-galactosidase enzyme to modify carbohydrate domains. In a second step, azide modified sugars were attached to the modified glycan chain using β-1,4-galactosyltransferase. After overnight incubation and purification of antibodies using a 100 kDa Amicon Ultra 0.5 mL centrifugal column, DBCO-modified ssDNA docking strands (Integrated DNA) were mixed at a 40:1 molar ratio with azide-modified antibodies and incubated overnight at 25 °C. ssDNA conjugated antibodies were then purified using a 100 kDa Amicon Ultra 0.5 mL. Final concentration was measured using a NanoDrop 2000 and antibodies were stored in PBS with 50% glycerol. For PNA-antibody conjugation, DBCO-modified mini-PEG-γ-PNA strands 40 (PNA Innovations) were used as the docking strands. See Supplementary Tables 1 and 3 for antibody information.
Show full methods section
SMCC ssDNA conjugation of antibodies and phalloidin Twenty-five nmol of thiolated single-stranded DNA (ssDNA) (Integrated DNA Technologies) was reduced using 50 mM Dithiothreitol (DTT) for 2 h, purified using a NAP-5 column (GE Healthcare Life Sciences), and quantified using a NanoDrop 2000 (Thermo Fisher Scientific). In parallel, 100 μg of antibody was concentrated to 1 mg/mL using a 100 kDa Amicon Ultra 0.5 mL centrifugal column (EMD Millipore) and purified from additive chemicals such as sodium azide using a 7 kDa Zeba spin desalting column (Thermo Fisher Scientific). A freshly prepared solution of SMCC with 5% DMF (Sigma-Aldrich) in PBS was then added to react for 1.5 h with the antibody solution at a molar ratio of 7.5:1. Unreacted SMCC (succinimidyl 4-(N-maleimidomethyl)cyclohexane-1-carboxylate) was removed using a 7 kDa Zeba column. In a subsequent reaction, antibodies were mixed in a 1:15 molar ratio with the reduced thiolated ssDNA strands and incubated overnight at 4 °C to form stable thioether bonds. ssDNA-conjugated antibodies were then purified using a 100 kDa Amicon Ultra 0.5 mL column. The final protein concentration of the antibody was measured using a NanoDrop 2000 and the antibodies were stored at −20 °C in PBS with 50% glycerol. Amino-modified phalloidin (Bachem AG) was conjugated using the protocol described above with an extra step of HPLC purification to separate unreacted thiolated ssDNA and ssDNA-conjugated peptides. The optimal antibody concentration was empirically determined for each different conjugation batch. See Supplementary Tables 1 and 3 for antibody information. Site-specific ssDNA conjugation of antibodies The SiteClick antibody labeling system (Thermo Fisher Scientific) enables site-specific conjugation to four conserved glycan sites present on the Fc region of the heavy chains using copper-free click chemistry. Briefly, 100 μg of each antibody was concentrated to 2–4 mg/mL in azide-free Tris buffer and treated with β-galactosidase enzyme to modify carbohydrate domains. In a second step, azide modified sugars were attached to the modified glycan chain using β-1,4-galactosyltransferase. After overnight incubation and purification of antibodies using a 100 kDa Amicon Ultra 0.5 mL centrifugal column, DBCO-modified ssDNA docking strands (Integrated DNA) were mixed at a 40:1 molar ratio with azide-modified antibodies and incubated overnight at 25 °C. ssDNA conjugated antibodies were then purified using a 100 kDa Amicon Ultra 0.5 mL. Final concentration was measured using a NanoDrop 2000 and antibodies were stored in PBS with 50% glycerol. For PNA-antibody conjugation, DBCO-modified mini-PEG-γ-PNA strands 40 (PNA Innovations) were used as the docking strands. See Supplementary Tables 1 and 3 for antibody information.
Design of ssLNA imaging probes
Same ssDNA sequences used for DNA-PAINT were used for ssLNA imaging probes with two modifications to increase the melting temperatures of the sequences: (1) two adenine nucleotides were added to the 3′ end of each sequence of the imaging probes to maximize the hybridization of the imaging probes with the corresponding docking strands. (2) Three DNA nucleotides in each sequence were replaced with LNA nucleotides. Since introducing LNA nucleotides could possibly introduce unwanted cross-hybridization (or crosstalk) between docking strands and imaging probes, an empirical algorithm was used to determine the optimal positions to replace the DNA nucleotides. Briefly, BLAST was performed for each docking strand and imaging probe pair to identify the partially complementary regions for each pair. An empirical cost function was then used to calculate the cost of every possible LNA substitution scheme with each docking strand. The cost function penalized LNA substitution in the partially complementary regions, with increasing penalty for more LNA substitution in the partially complementary regions, and bigger partially complementary regions. For each LNA substitution scheme, the highest cost within all the costs with different docking strands was assigned as the cost for the given substitution scheme. Finally, for each LNA sequence, the substitution scheme with the minimal cost was then selected for our LNA imaging probe sequence design. The algorithm was implemented in Python 3.5. Blast was performed using Biopython 1.66 in Python 3.5.
Fluorophore conjugation of ssLNA imaging probes
In total 3′-amino ssLNA strands were purchased from Exiqon A/S and conjugated with ATTO 655-NHS (ATTO-TEC GmbH). Briefly, 10 nmol of ssLNA were mixed with ATTO 655-NHS in 1:5 molar ratio in 500 µL PBS, incubated for 2 h at room temperature and then overnight at 4 °C. Prior to purification with HPLC, isopropanol precipitation was performed to remove free dyes: 50 µL of 3 M sodium acetate solution was first added to the ssLNA solution followed by adding 550 µL of −20 °C isopropanol. The mixed solution was thoroughly vortexed and incubated for 30 min at −20 °C, and then immediately centrifuged at 10,000 × g and 4 °C for 1 h. The supernatant was delicately removed from the pellet. 500 µL of cold −20 °C ethanol was carefully added to the pellet and centrifuged at 10,000 × g and 4 °C for 15 min. The supernatant was removed, and the pellet was dried at 37 °C for 2 h. The pellet was then resuspended in 500 µL PBS, purified with HPLC, and lyophilized. See Supplementary Table 2 for ssLNA probe sequences. SDS-PAGE and mass spec validation of conjugated antibodies ssDNA-modified antibody solutions were reduced with 10 mM Tris-HCl complemented with 20 mM DTT for 2 h at 37 °C. Reduced antibody solutions were then run on a 10% acrylamide/bis-acrylamide SDS-PAGE gel, for 90 min at 110 V. Staining was performed using EZBlue gel staining reagent (Sigma-Aldrich). SiteClick conjugation efficiency and the ssDNA to antibody ratio were determined using MALDI-TOF mass spectrometry. Briefly, 20 μL of modified 0.5–1 mg/mL antibody solutions in PBS were purified and concentrated using ZipTip pipette tips C 4 resin (EMD Millipore) and then eluted in 10 μL of 80% ACN 0.1% TFA, dried down, and re-constituted in 1 μL of sinapinic acid matrix solution. The samples were then spotted and analyzed with microflex MALDI-TOF (Bruker Daltonics).
Primary mouse and rat neuronal cultures
Procedures for mouse neuronal culture preparation were approved by the Massachusetts Institute of Technology Committee on Animal Care. Hippocampal and cortical mouse neuronal cultures were prepared from postnatal day 0 or day 1 Swiss Webster (Taconic) mice as previously described 53 , 54 but with the following modifications: dissected hippocampal and cortical tissues were digested with 50 units of papain (Worthington) for 6–8 min, and the digestion was stopped with ovomucoid trypsin inhibitor (Worthington Biochem). Cells were plated at a density of 10,000 per well in a glass-bottom 96-well plate coated with 50 μl Matrigel (BD Biosciences). Neurons were seeded in 50 μl plating medium containing MEM (Life Technologies), 33 mM glucose (Sigma-Aldrich), 0.01% transferrin (Sigma-Aldrich), 10 nM Hepes, 2 mM Glutagro (Corning), 0.13% Insulin (EMD Millipore), 2% B27 supplement (Thermo Fisher Scientific), and 7.5% heat inactivated fetal bovine serum (Corning). After cell adhesion, additional plating medium was added. 0.002 mM AraC (Sigma-Aldrich) was added when glia density was 50–70%. Neurons were grown at 37 °C and 5% CO 2 in a humidified atmosphere. Procedures for rat neuronal culture were reviewed and approved for use by the Broad Institutional Animal Care and Use Committee. For rat hippocampal neuronal cultures, E18 embryos were collected from CO 2 euthanized pregnant Sprague Dawley rats (Taconic). Embryo hippocampi were dissected in ice-cold Hibernate E supplemented with 2% B27 supplements and 100 U/mL Penn/Strep (Thermo Fisher Scientific). Hippocampal tissues were digested in Hibernate E containing 20 U/mL papain, 1 mM L-cysteine, 0.5 mM EDTA (Worthington Biochem) and 0.01% DNAse (Sigma-Aldrich) for 8 min, and the digestion was stopped with 0.5% ovomucoid trypsin inhibitor (Worthington Biochem) and 0.5% bovine serum albumin (BSA) (Sigma-Aldrich). Neurons were dissociated and plated at a density of 15,000 cells/well onto poly-D-lysine coated, black-walled, thin-bottomed 96-well plates (Greiner Bio-One). Neurons were seeded and maintained in NbActiv1 (BrainBits). Cells were grown at 37 °C in a 95% air with 5% CO 2 humidified incubator for 21 days before use. For synaptic remodeling experiments, cells were treated on day 19 with 1 μM TTX (Sigma-Aldrich) for 48 h. All procedures involving animals were in accordance with the US National Institutes of Health Guide for the Care and Use of Laboratory Animals.
Validation of ssDNA-conjugated antibodies and phalloidin
To test whether the binding specificities of antibodies were affected by ssDNA conjugation, immunostaining patterns of unconjugated and ssDNA-conjugated antibodies were compared in each case. Cells were fixed at room temperature for 15 min with 4% paraformaldehyde (Electron Microscopy Sciences) and 4% wt/vol sucrose in PBS, and then washed three times with PBS. Cells were permeabilized for 10 min at room temperature with 0.25% Triton-X100 in PBS and washed twice with PBS. For staining with unconjugated primary antibody or fluorescently labeled phalloidin, cells were blocked for 1 h at room temperature with 5% BSA in PBS. Cells were then incubated with primary antibodies or fluorescently labeled phalloidin diluted in 5% BSA overnight at 4 °C. For staining with ssDNA-conjugated primary antibodies, the nuclear blocking buffer (5% BSA and 1 mg/mL salmon sperm DNA (Sigma-Aldrich) in PBS) was for blocking and antibody dilution. After primary antibody staining, the sample was then washed three times with PBS, incubated for 1 h at room temperature with secondary antibodies in 5% BSA in PBS, and washed again three times with PBS. For validation of ssDNA-conjugated secondary antibodies, the fluorescently labeled secondary antibodies of the same species were added to the samples after 30 min incubation with ssDNA-conjugated secondary antibodies to reduce the competition of binding of fluorescently labeled secondary antibodies with ssDNA-conjugated secondary antibodies. See Supplementary Tables 1 and 3 for antibody information. Comparison of antibody staining patterns before and after ssDNA conjugation were performed using the Pearson correlation coefficient (PCC). Colocalization of each antibody being tested with synapsin-I signal was performed before and after ssDNA conjugation. Specifically, three confocal images were acquired of neurons stained with unconjugated and conjugated antibodies separately. Each image was split into four quadrants, and the PCC between the synapsin-I channel and the channel of the other synaptic antibody for each quadrant was calculated and then averaged to obtain the mean PCC.
Immunostaining for LNA- and DNA-PRISM
Cells were fixed and permeabilized as described in the previous section. For LNA-PRISM, cells were additionally incubated in 50 μg/ml RNase A (Thermo Fisher Scientific) and 230 U/mL RNase T1 (Thermo Fisher Scientific) in PBS at 37 °C for 1 h to reduce the fluorescent background caused by ssLNA-RNA binding, and washed 3 times with PBS. Cells were then blocked for 1 h at room temperature with the 5% BSA in PBS. The following unconjugated primary antibodies were diluted in the regular blocking buffer and used for LNA- or DNA-PRISM: MAP2, VGLUT1, PSD-95, and NR2B (LNA-PRISM); PSD-95 and NR2B (DNA-PRISM). Cells were incubated in diluted primary antibodies overnight at 4 °C, washed 3 times with PBS, and then incubated in the nuclear blocking buffer for 1 h at room temperature. Next, the following secondary antibodies were diluted in the nuclear blocking buffer and used for LNA- or DNA-PRISM: goat-anti-chicken-Alexa 488, goat-anti-guinea pig-Alexa555 and goat-anti-rabbit-p1, goat-anti-mouse-p12 (LNA-PRISM); goat-anti-rabbit-p1 and goat-anti-mouse-p12 (DNA-PRISM). Cells were incubated at room temperature for 1 h in the secondary antibody solution. Cells were washed 3 times with PBS, post-fixed for 15 min with 4% paraformaldehyde and 4% wt/vol sucrose in PBS. This step was used to prevent cross-binding of the secondary antibodies to the primary antibodies in the following round of staining. Cells were washed 3 times with PBS and incubated again in the nuclear blocking buffer for 30 min at room temperature. Cells were then incubated overnight at 4 °C in the following primary antibody/peptide solution diluted in the nuclear blocking buffer for LNA- or DNA-PRISM: phalloidin-p2, Tuj-1-p3, cortactin-p4, SHANK3-p6, ARPC2-p7, bassoon-p8, synapsin-I-p9, Homer-1b/c-p10 (LNA-PRISM); phalloidin-p2, Tuj-1-p3, cortactin-p4, SHANK3-p6, bassoon-p5 (PNA), synapsin-I-p9, Homer-1b/c-p10 (DNA-PRISM). For the neuronal activity blockade experiment, the conjugated antibody ARPC2-p7 was substituted for rat-Gephyrin with goat-anti-rat-p7 and the conjugated antibody Tuj-1-p3 was substituted for vGAT-p3. These inhibitory markers were excluded from analysis in the present work in order to present an in-depth study of both inhibitory and excitatory synapses using PRISM in future work. Cells were then washed 3 times with PBS. For LNA-PRISM, cells were incubated in diluted DAPI or Hoechst for 15 min. For DNA-PRISM, cells were incubated at room temperature for 1 h in donkey-anti-goat-Alexa488 diluted in the regular blocking buffer, washed 3 times with PBS, and then incubated with 10 nM of 100 nm diameter gold nanoparticle (Sigma-Aldrich) in PBS for 15 min. Cells were then washed 3 times with PBS prior to imaging. See Supplementary Table 1 and Supplementary Table 3 for antibody information. Multiplexed confocal imaging of neurons using LNA-PRISM LNA-PRISM imaging was performed on an Opera Phenix High-Content Screening System (PerkinElmer) equipped with a fast laser-based autofocus system, high NA water immersion objective (×63, numerical aperture = 1.15), two large format scientific complementary metal-oxide semiconductor (sCMOS) cameras and spinning disk optics. 405 nm, 488 nm and 561 nm lasers were used as excitation for DAPI, MAP2, and VGLUT1 channels respectively. PRISM images were acquired using a 640 nm laser (40 mW), sCMOS camera with 1–2 s exposure time, and effective pixel size of 187 nm. Before each imaging round, the corresponding imaging probe was freshly diluted to 10 nM in imaging buffer (500 mM NaCl in PBS, pH 8). Neurons were incubated with 10 nM imaging probes for 5 min, and then washed twice manually with imaging buffer to remove the free imaging probe. For each field of view, a stack of three images was acquired with a step of 0.5 μm. At least five fields of view were imaged for each well. After imaging, cells were washed three times with wash buffer (0.01 × PBS), and incubated in the wash buffer for 5 min after the last wash before the next round of imaging. To account for variabilities within each multi-well plate and across different cultures, imaging was performed on three independent neuronal cultures, and three wells were imaged from each neuronal culture. For the synaptic remodeling experiments, imaging was performed on six wells from two independent rodent neuronal cultures.
LNA-PRISM confocal image processing and analysis
The flat-field correction was performed to correct the uneven illumination in the images due to the laser beam profile 55 . Briefly, each image was filtered by morphological opening filter with a disk structural element of 100 pixels to estimate the background of each image. For each 96-well plate, all background images from the same channel were then averaged to obtain the illumination profile for each channel for each plate. Note that the illumination profile can vary across experiments; therefore, the illumination profile for each plate needs to be estimated separately. Images from the same channel were then divided by the illumination profile of the channel to obtain the corrected images. Next, lateral (x,y) drift between LNA-PRISM images from different imaging rounds was corrected by aligning the MAP2 channel in each imaging round. The (x,y) drift was estimated by locating the peak of the spatial cross-correlation function between two MAP2 images. For segmentation of synaptic punctae, the contrast of the image was first adjusted by saturating the highest and lowest 1% of pixels in the intensity histogram. The image was then denoised using a 5 × 5 Wiener filter, and filtered again with a top-hat operator with a disk structural element of 8 pixels to enhance the punctae in the image. The optimal threshold for each image was determined using an object-feature-based thresholding algorithm adapted from the thresholding algorithm previously used for single-molecule tracking 56 . The threshold producing the maximum number of objects was chosen as the optimal threshold. We found thresholding based on the features of objects was more robust to the intensity variations across different channels than the intensity-based approach for synapse segmentation. Connected synapses in the thresholded image were then separated using a watershed transform to obtain the final segmentation mask for each image of each synaptic target. Following Micheva et al. 12 , synapses were identified using synapsin-I as the synapse marker. Synapsin-I punctae in the nuclei were mostly not synapses and therefore excluded from segmentation 12 . Each segmented synapsin-I punctum larger than 0.42 μm 2 was considered to be a synapse. For other synaptic proteins, only punctae that were colocalized (intensity weighted centroid distance
📊 Figures
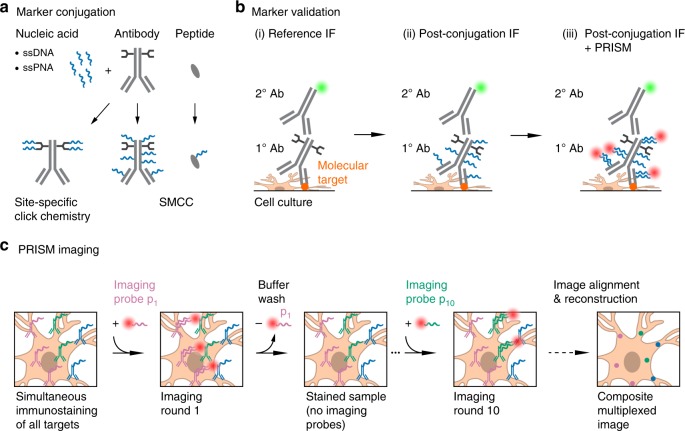
Fig. 1
Schematic of the PRISM imaging technique. a Reagents (markers, shown in gray) for detecting subcellular targets include antibodies or peptides that are conjugated with unique oligonucleotide barcodes ...
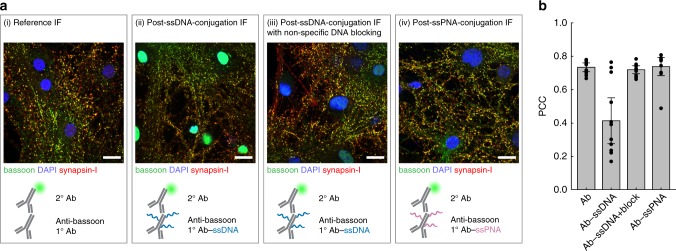
Fig. 2
Blocking off-target nuclear localization of ssDNA-conjugated antibodies. a Neurons were stained with native or ssDNA-conjugated anti-bassoon antibody, anti-synapsin-I antibody, and DAPI. ssDNA-conjuga...
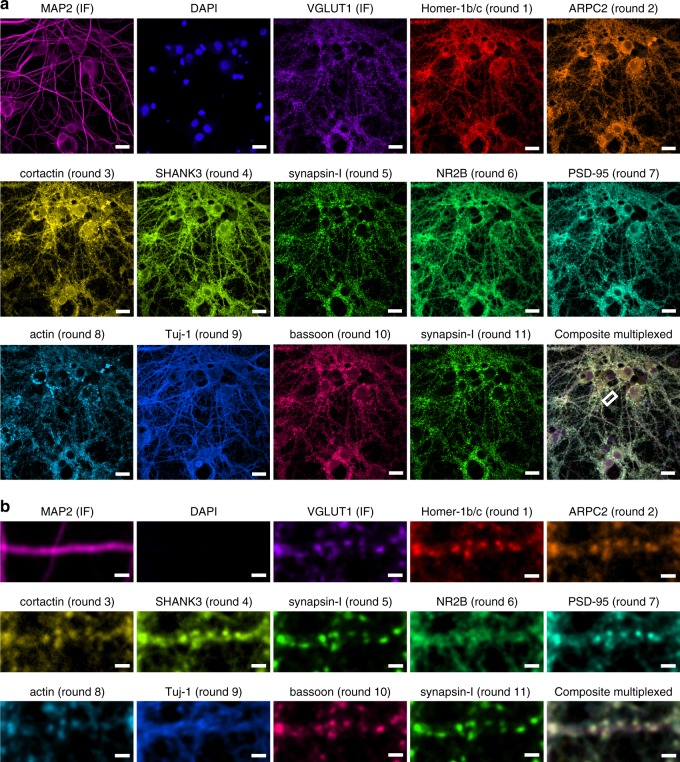
Fig. 3
Confocal LNA-PRISM images of rat hippocampal neuronal synapses. a 13-channel images of 21 days in vitro (DIV) rat hippocampal neuronal culture from a single field of view. Individual channels for each...
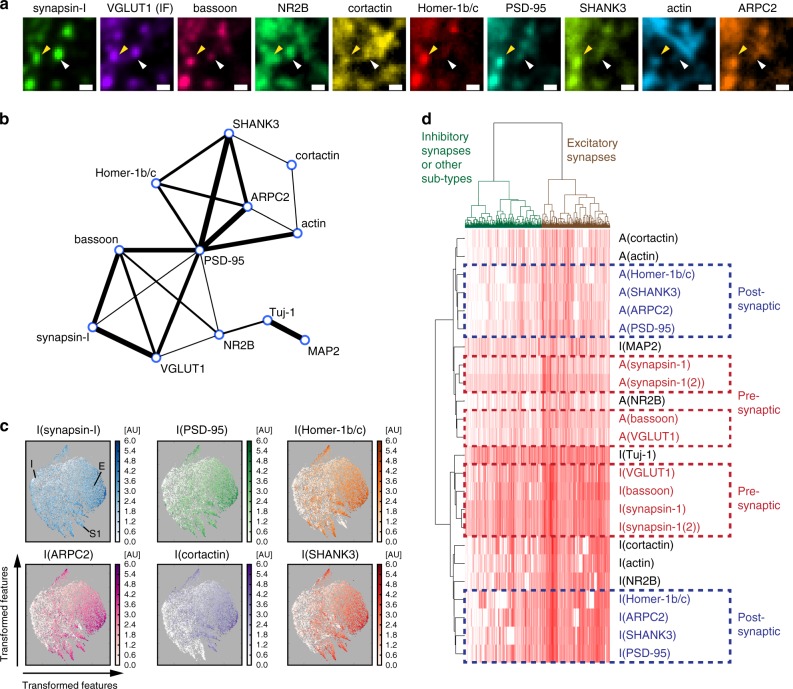
Fig. 4
Analysis of single-synapse profiles from confocal imaging. a LNA-PRISM images of a conventional excitatory synapse (yellow arrowhead) with co-localization of every synaptic marker measured, and a syna...
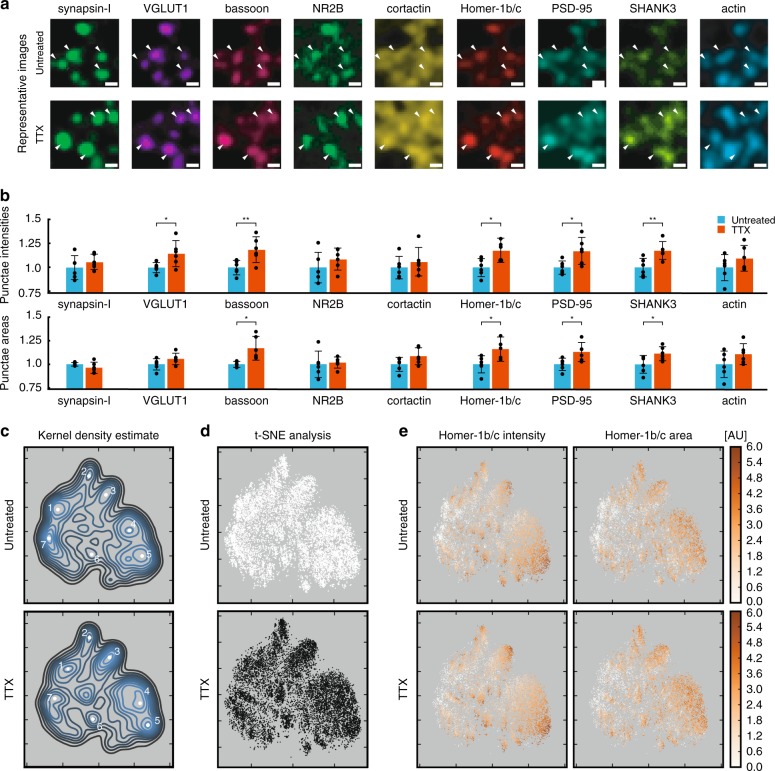
Fig. 5
Analysis of synaptic remodeling from confocal imaging. a Representative images of synapses from 21 days in vitro rat hippocampal neurons. White arrowheads indicate synapses. Scale bar: 1u2009u03bcm. b...
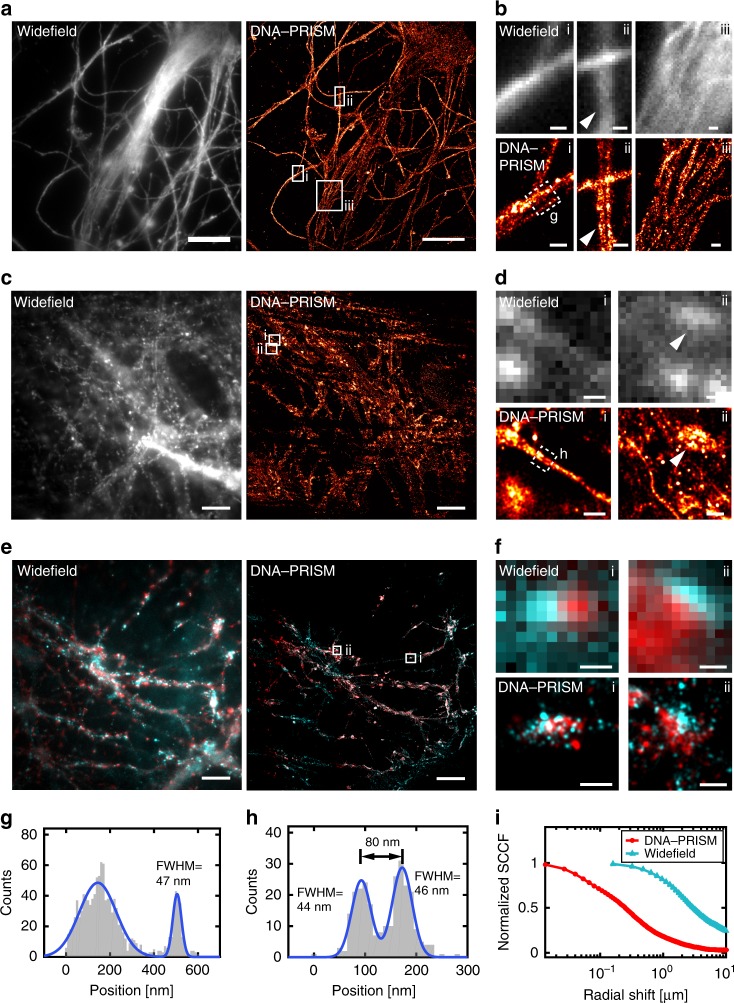
Fig. 6
Super-resolution DNA-PRISM imaging of primary neuronal cultures. a Widefield and DNA-PRISM images of neuronal microtubules stained using the DNA-conjugated anti-Tuj-1 antibody. b Zoom-in view of the b...
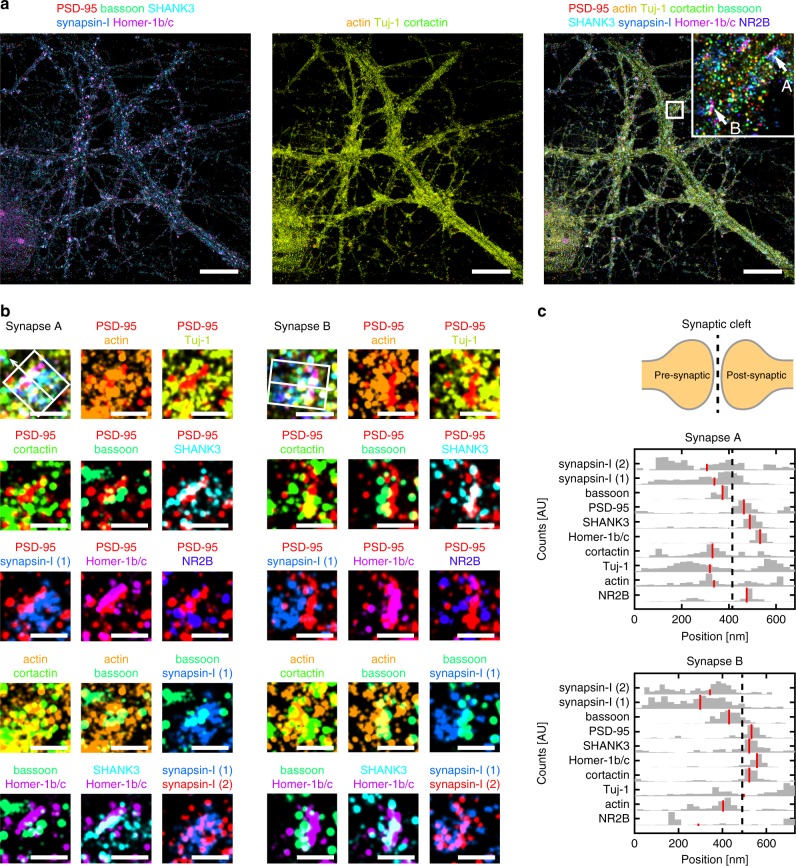
Fig. 7
Distributions of synaptic proteins within individual synapses. a DNA-PRISM images of neurons showing the subset channels of synaptic proteins (left), the subset channels of cytoskeletal proteins (midd...
Figure images are served from the NIH/NLM PubMed Central Open Access Subset or Europe PMC; copyright remains with the publishers and authors.
💬 Discussion
0 commentsNo comments yet. Be the first to start a discussion!
Leave a Comment