Abstract
Super-resolution microscopy (SRM) has become essential for the study of nanoscale biological processes. This type of imaging often requires the use of specialised image analysis tools to process a large volume of recorded data and extract quantitative information. In recent years, our team has built an open-source image analysis framework for SRM designed to combine high performance and ease of use. We named it NanoJ-a reference to the popular ImageJ software it was developed for. In this paper, we highlight the current capabilities of NanoJ for several essential processing steps: spatio-temporal alignment of raw data (NanoJ-Core), super-resolution image reconstruction (NanoJ-SRRF), image quality assessment (NanoJ-SQUIRREL), structural modelling (NanoJ-VirusMapper) and control of the sample environment (NanoJ-Fluidics). We expect to expand NanoJ in the future through the development of new tools designed to improve quantitative data analysis and measure the reliability of fluorescent microscopy studies.
🔬 Techniques
💻 Software
✨ Fluorophores
🧪 Sample Preparation
🔬 Cell Lines
💻 Software Details
💻 Code & Software
Manual, source-code and binaries for the NanoJ-Fluidics project
Core functionality of NanoJ
Super-resolution radial fluctuations (SRRF)
💾 Data Repositories
🏛️ Research Organizations (ROR)
Affiliated research institutions:
📊 Figures
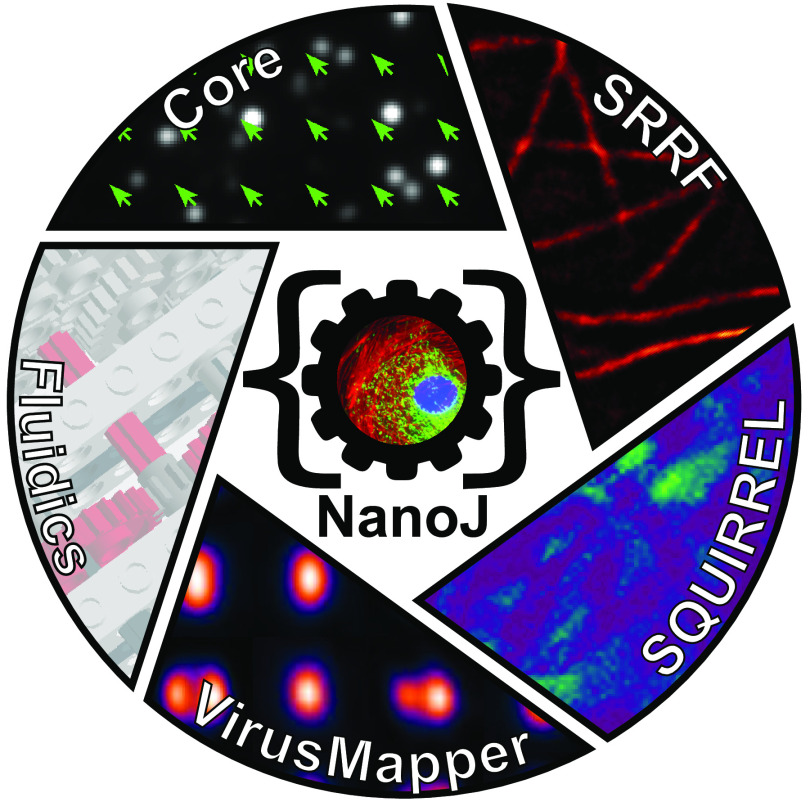
Figure 1.
NanoJ framework. Currently NanoJ consists of five modules dedicated tonsuper-resolution imaging and analysis.
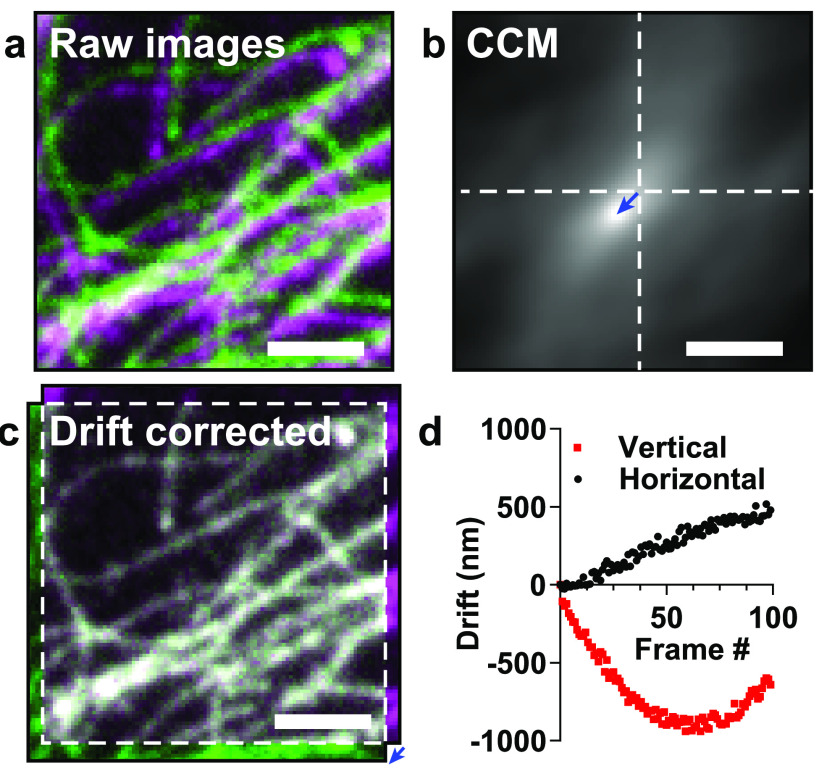
Figure 2.
Drift correction with NanoJ-Core. (a) Composite image of two frames from antime-lapse dataset of the same field-of-view. An artificially large driftnwas applied computationally in order to make it vis...
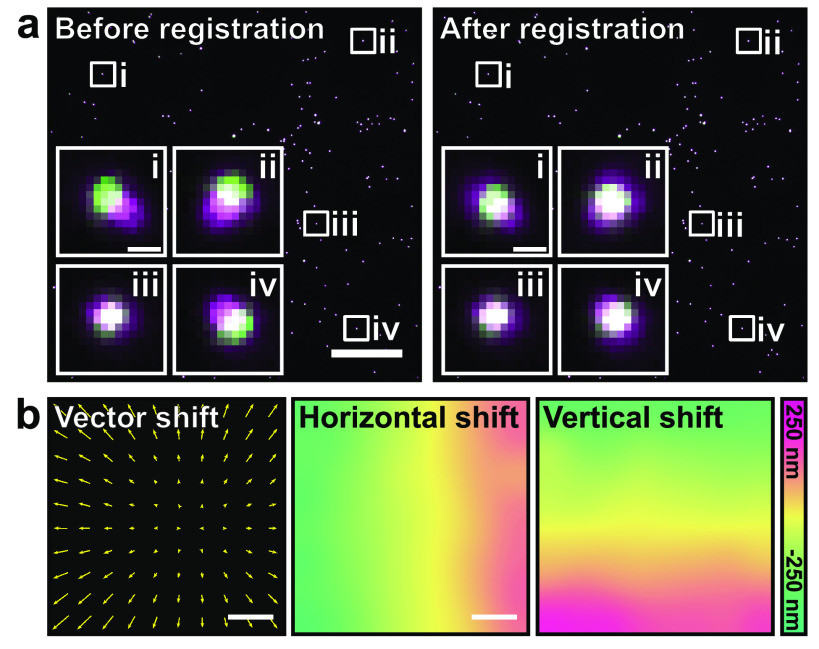
Figure 3.
Multi-colour channel registration with NanoJ-Core. (a) Composite image ofnmulti-colour TetraSpeck u2122 beads imaged in two different channelsn(u2018GFP-channelu2019 indicated in green and u2018mCherr...
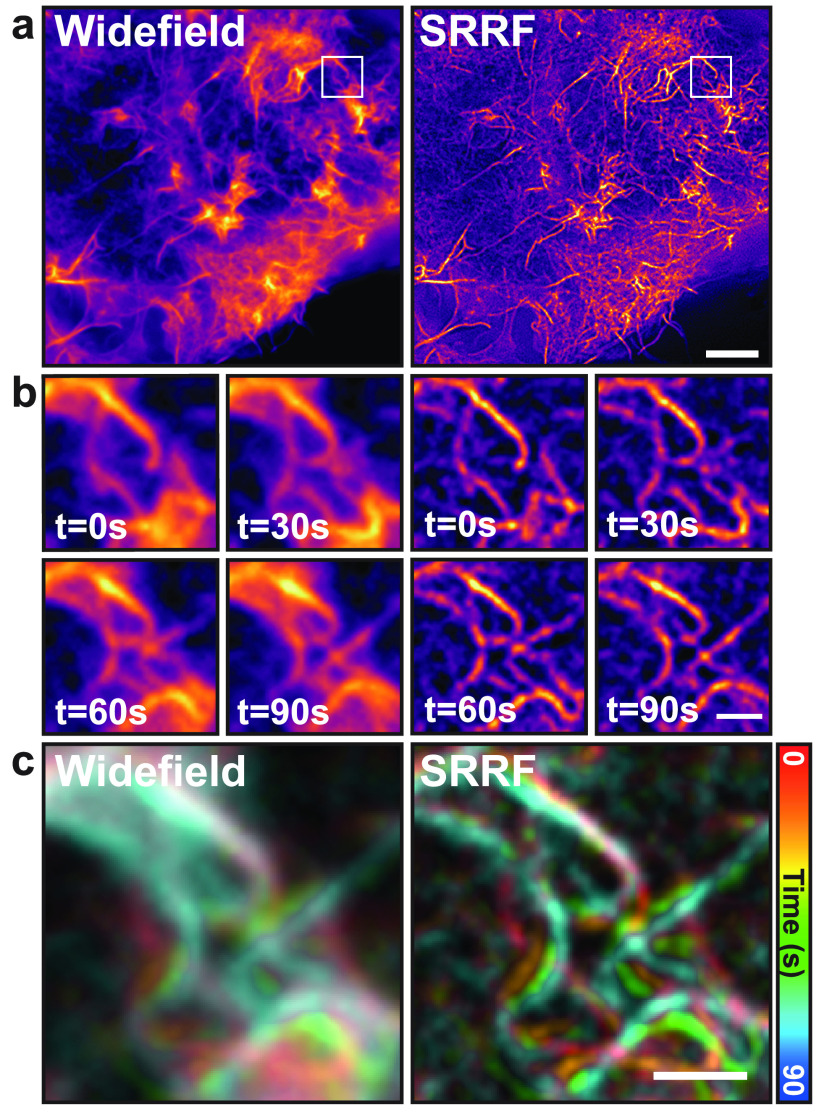
Figure 4.
Live-cell SRM with NanoJ-SRRF. (a) Comparison of widefield (left) and SRRFnreconstruction (right) obtained from a COS-7 cell expressing UtrCH-GFP tonlabel actin filaments. Scale bar: 5 u00b5 m. (b) Ti...
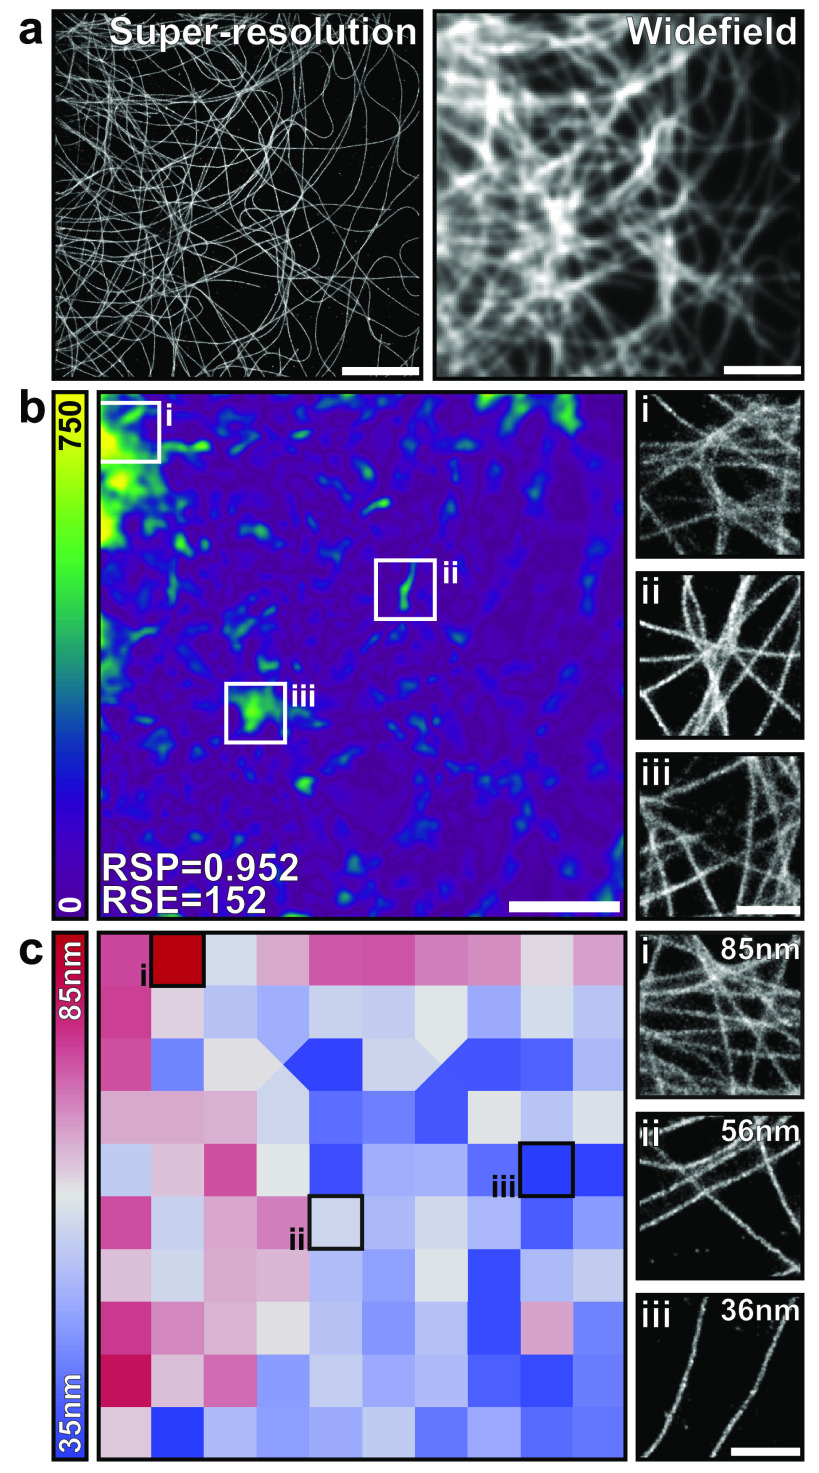
Figure 5.
Quality assessment and resolution mapping with NanoJ-SQUIRREL. (a) Ansuper-resolution rendering (left) and acquired widefield image (right) ofnfixed microtubules labelled with Alexa Fluor-647. (b) Lef...
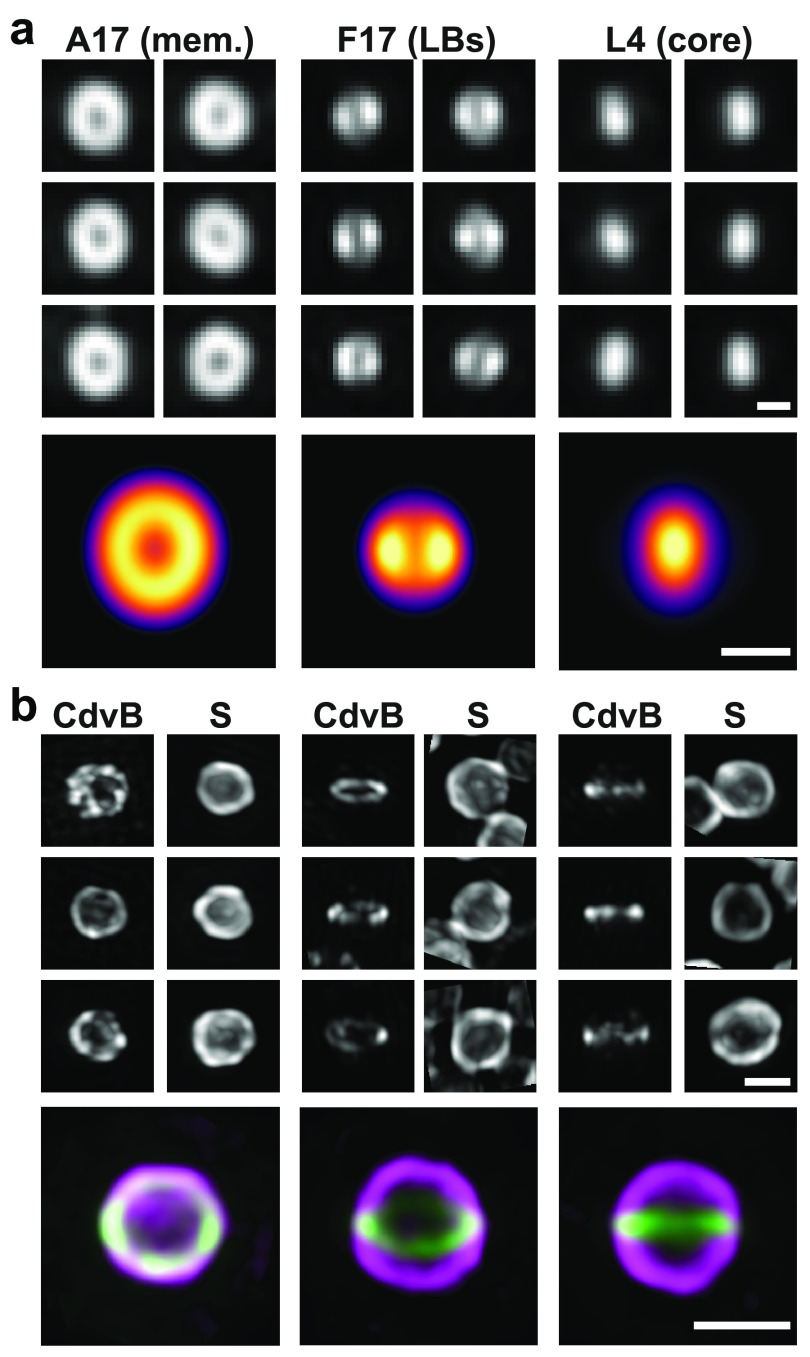
Figure 6.
Quantitative SPA-based modelling with NanoJ-VirusMapper. (a) Top: aligned SIMnimages of individual vaccinia particles labelled for L4 (core), F17 (LBs)nand A17 (membrane, mem.). Bottom: VirusMapper mo...
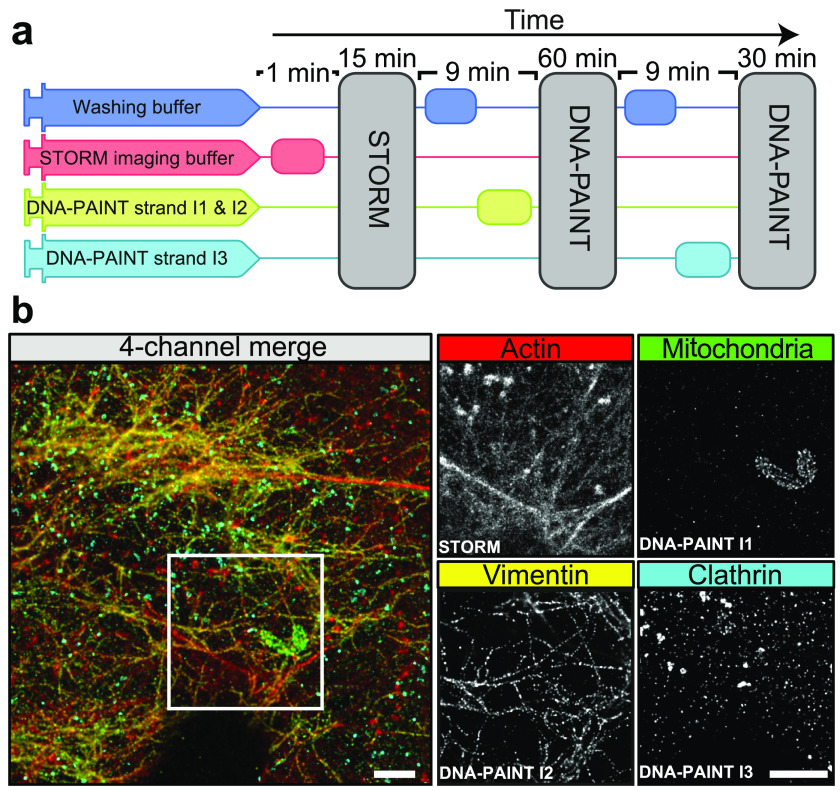
Figure 7.
Automated DNA-PAINT and STORM imaging. (a) NanoJ-Fluidics workflow used fornmulti-color STORM and DNA-PAINT imaging. (b) Left: 4-channel merge of STORMnand DNA-PAINT with actin (red, STORM), mitochond...
Figure images are served from the NIH/NLM PubMed Central Open Access Subset or Europe PMC; copyright remains with the publishers and authors.
💬 Discussion
0 commentsNo comments yet. Be the first to start a discussion!
Leave a Comment