Abstract
Natural killer (NK) cells are innate immune effectors that lyse virally infected and tumorigenic cells through the formation of an immunological synapse. Actin remodeling at the lytic immunological synapse is a critical requirement for multiple facets of cytotoxic function. Activating receptor and integrin signaling leads to the regulated turnover and remodeling of actin, which is required for adhesion, sustained receptor signaling, and ultimately exocytosis. NK cells undergo lytic granule exocytosis in hypodense regions of a pervasive actin network. Although these requirements have been well demonstrated, neither the dynamic regulation of synaptic actin nor its specific function, however, has been determined at a nanoscale level. Here, live-cell super-resolution microscopy demonstrates nanoscale filamentous actin dynamism in NK cell lytic granule secretion. Following cell spreading, the overall content of the branched actin network at an immune synapse is stable over time and contains branched actin fibers and discrete actin foci. Similar actin architecture is generated in cytolytic T cells, although the timescale differs from that of NK cells. Individual filament displacement leads to stochastic clearance formation and disappearance, which are independent of lytic granule positioning. Actin dynamism is dependent upon branched network formation mediated by Arp2/3 and contractility generated by myosin IIA. Importantly, the use of small-molecule inhibitors demonstrates that actin dynamism is ultimately needed for granule secretion. Thus, we describe a requirement for nanoscale actin fiber rearrangement in generating the complex actin architecture that enables lytic granule secretion.
🔬 Techniques
🔭 Microscopes
🧬 Organisms
💻 Software
✨ Fluorophores
🧪 Sample Preparation
🔬 Cell Lines
🏭 Microscope Brands
🧪 Reagent Suppliers
📷 Detectors
🔎 Objectives
💻 Software Details
💻 Code & Software
💾 Data Repositories
🏛️ Research Organizations (ROR)
Affiliated research institutions:
📋 Methods
Key Resources Table REAGENT or RESOURCE SOURCE IDENTIFIER Antibodies
CD8-Bv785 (staining concentration 6 μg/mL) Biolegend Cat#301045; Clone RPTA-T8; Lots B187390, B221662 CD45RA-Bv421 (staining concentration 6 μg/mL) Biolegend Cat#304129; Clone HT100; Lot B204474 CD45RO-PE (staining concentration 5 μg/mL) Biolegend Cat#304205; Clone UCHL1; Lot B183218 CD107a-AF647 (staining concentration 1.25 μg/mL) Biolegend Cat#328612; Clone H4A3; Lot E11642-1632 Perforin-AF488 (staining concentration 20 μg/mL) Biolegend Cat#308108; Clone dG9; Lot B198112 CD3 (LEAF) (concentration 5 μg/mL) Biolegend Cat#317315; Clone OKT3; Lot B211929 CD28 (concentration 5 μg/mL) Biolegend Cat#302914; Clone CD28.2; Lot B219506 CD18 (concentration 5 μg/mL) Hybridoma Clone TS1/18; Single batch CD18 (concentration 5 μg/mL) Hybridoma Clone IB4; Single batch NKp30 (LEAF, CD337) (concentration 5 μg/mL) Biolegend Cat#325204; Clone P30-15; Lot B224416 NKp30 (CD337) (staining concentration 5 μg/mL) R&D Systems Europe Cat#MAB18491; Clone 210847; Lot JRK0216081 Chemicals, Peptides, and Recombinant Proteins rh ICAM-1 (concentration 5 μg/mL) R&D Systems Cat#ADP4-200; Lot WV1915121 Phalloidin AF488 (staining concentration 3U/mL) Thermo Fisher Cat#A12379; Lot 1816955 Phalloidin AF532 (staining concentration 3U/mL) Thermo Fisher Cat# A22282 ; Lot 1417648 LysoTracker Red DND-99 (staining concentration 1/1000) Thermo Fisher Cat#L7528; Lot 983858 Cell Proliferation Dye eFluor 670 (staining concentration 1/1000) eBioscience Cat#65-0840-85; Lot 4297564 SYTOX Orange Nucleic Acid Stain (staining concentration 0.2 μM) Thermo Fisher Cat# S11368; Lot 1488607 DMSO, Anhydrous (dilution 1/500, 1/1000) Thermo Fisher Cat# D12345 Blebbistatin (concentration 40 μM) Sigma Aldrich Cat#B0560-1MG; Lot SLBM5499V CK666 (concentration 50 μM) Calbiochem Cat#182515-25MG; Lot 264765 Jasplakinolide (concentration 1 μM) ChemCruz Cat#sc-202191A; Lot A0417 SMIFH2 (concentration 50 μM) Sigma Aldrich Cat#S4826-5MG; Lot 075M4601V Critical Commercial Assays Human CD8+ T cell enrichment kit Stemcell Cat#15063; Lot 16F72180 T Cell Expansion Kit, human Miltenyi Biotec Cat#130-091-441; Lot 5150227115 NK Cell Isolation Kit, human Miltenyi Biotec Cat#130-092-657; Lot 5170608527 LookOut mycoplasma PCR detection kit Sigma Aldrich Cat#MP0035-1KT Amaxa Kit R Lonza Cat#VCA-1001 Experimental Models: Cell Lines NK92 ATCC Cat#CRL-2407 Experimental Models: Organisms/Strains Human: healthy donor Sample size is indicated in the legend of each relevant figure. All samples were acquired with approval from the Institutional Review Boards of Texas Children’s Hospital and University of Manchester under the guidelines of the Declaration of Helsinki. Recombinant DNA LAMP1-pHluorin plasmid [ 16 ] N/A mApple-LAMP1-pHluorin-N-8 plasmid Davidson Collection (unpublished) AddGene Plasmid #54918 LifeAct plasmid Dr Janis Burkhardt (University of Pennsylvania) N/A LeGO-E Emerald-GFP plasmid Dr. Boris Fehse AddGene Plasmid #27359 mTurquoise plasmid Dr. Theodorus Gadella (University of Amsterdam) N/A Software and Algorithms Imaris (v8.4.1 and v9.0.2) Bitplane http://www.bitplane.com/ MATLAB (v2016b and v2017b) The MathWorks https://www.mathworks.com/ Huygens (v16.10) Scientific Volume Imaging https://svi.nl/HomePage Volocity (v6.3) Perkin Elmer http://cellularimaging.perkinelmer.com/downloads/detail.php?id=14 Fiji v1.51n [ 60 ] https://fiji.sc/ NanoJ toolbox for ImageJ [ 40 ] https://bitbucket.org/rhenriqueslab/nanoj-core/wiki/Home QuimP toolbox for ImageJ v17.04.04 [ 61 ] https://www2.warwick.ac.uk/fac/sci/dcs/people/till_bretschneider/quimp/ KymographClear Macro toolset for ImageJ [ 62 ] https://sites.google.com/site/kymographanalysis/ LookUp Tables Dr David J Williamson (King’s College, London) https://github.com/quokka79/DavLUT Actin Mesh Analyzer [ 14 , 15 ] and this paper https://github.com/alexcarisey/ActinMeshAnalyzer GraphPad Prism 7.03 GraphPad Software https://www.graphpad.com/ DSS Research online tool (statistical power calculation) DSS Research https://www.dssresearch.com/KnowledgeCenter/toolkitcalculators/statisticalpowercalculators.aspx Illustrator CC 22.0.1 (64-bit) Adobe Systems Incorporated http://www.adobe.com/products/illustrator.html Contact for Reagent and Resource Sharing Further information and requests for resources and reagents should be directed to and will be fulfilled by the Lead Contact, Jordan S. Orange, MD PhD ( orange@bcm.edu ). The LAMP1-pHluorin plasmid is patented as US20150212064/WO2013025598A1.
Show full methods section
Key Resources Table REAGENT or RESOURCE SOURCE IDENTIFIER Antibodies
CD8-Bv785 (staining concentration 6 μg/mL) Biolegend Cat#301045; Clone RPTA-T8; Lots B187390, B221662 CD45RA-Bv421 (staining concentration 6 μg/mL) Biolegend Cat#304129; Clone HT100; Lot B204474 CD45RO-PE (staining concentration 5 μg/mL) Biolegend Cat#304205; Clone UCHL1; Lot B183218 CD107a-AF647 (staining concentration 1.25 μg/mL) Biolegend Cat#328612; Clone H4A3; Lot E11642-1632 Perforin-AF488 (staining concentration 20 μg/mL) Biolegend Cat#308108; Clone dG9; Lot B198112 CD3 (LEAF) (concentration 5 μg/mL) Biolegend Cat#317315; Clone OKT3; Lot B211929 CD28 (concentration 5 μg/mL) Biolegend Cat#302914; Clone CD28.2; Lot B219506 CD18 (concentration 5 μg/mL) Hybridoma Clone TS1/18; Single batch CD18 (concentration 5 μg/mL) Hybridoma Clone IB4; Single batch NKp30 (LEAF, CD337) (concentration 5 μg/mL) Biolegend Cat#325204; Clone P30-15; Lot B224416 NKp30 (CD337) (staining concentration 5 μg/mL) R&D Systems Europe Cat#MAB18491; Clone 210847; Lot JRK0216081 Chemicals, Peptides, and Recombinant Proteins rh ICAM-1 (concentration 5 μg/mL) R&D Systems Cat#ADP4-200; Lot WV1915121 Phalloidin AF488 (staining concentration 3U/mL) Thermo Fisher Cat#A12379; Lot 1816955 Phalloidin AF532 (staining concentration 3U/mL) Thermo Fisher Cat# A22282 ; Lot 1417648 LysoTracker Red DND-99 (staining concentration 1/1000) Thermo Fisher Cat#L7528; Lot 983858 Cell Proliferation Dye eFluor 670 (staining concentration 1/1000) eBioscience Cat#65-0840-85; Lot 4297564 SYTOX Orange Nucleic Acid Stain (staining concentration 0.2 μM) Thermo Fisher Cat# S11368; Lot 1488607 DMSO, Anhydrous (dilution 1/500, 1/1000) Thermo Fisher Cat# D12345 Blebbistatin (concentration 40 μM) Sigma Aldrich Cat#B0560-1MG; Lot SLBM5499V CK666 (concentration 50 μM) Calbiochem Cat#182515-25MG; Lot 264765 Jasplakinolide (concentration 1 μM) ChemCruz Cat#sc-202191A; Lot A0417 SMIFH2 (concentration 50 μM) Sigma Aldrich Cat#S4826-5MG; Lot 075M4601V Critical Commercial Assays Human CD8+ T cell enrichment kit Stemcell Cat#15063; Lot 16F72180 T Cell Expansion Kit, human Miltenyi Biotec Cat#130-091-441; Lot 5150227115 NK Cell Isolation Kit, human Miltenyi Biotec Cat#130-092-657; Lot 5170608527 LookOut mycoplasma PCR detection kit Sigma Aldrich Cat#MP0035-1KT Amaxa Kit R Lonza Cat#VCA-1001 Experimental Models: Cell Lines NK92 ATCC Cat#CRL-2407 Experimental Models: Organisms/Strains Human: healthy donor Sample size is indicated in the legend of each relevant figure. All samples were acquired with approval from the Institutional Review Boards of Texas Children’s Hospital and University of Manchester under the guidelines of the Declaration of Helsinki. Recombinant DNA LAMP1-pHluorin plasmid [ 16 ] N/A mApple-LAMP1-pHluorin-N-8 plasmid Davidson Collection (unpublished) AddGene Plasmid #54918 LifeAct plasmid Dr Janis Burkhardt (University of Pennsylvania) N/A LeGO-E Emerald-GFP plasmid Dr. Boris Fehse AddGene Plasmid #27359 mTurquoise plasmid Dr. Theodorus Gadella (University of Amsterdam) N/A Software and Algorithms Imaris (v8.4.1 and v9.0.2) Bitplane http://www.bitplane.com/ MATLAB (v2016b and v2017b) The MathWorks https://www.mathworks.com/ Huygens (v16.10) Scientific Volume Imaging https://svi.nl/HomePage Volocity (v6.3) Perkin Elmer http://cellularimaging.perkinelmer.com/downloads/detail.php?id=14 Fiji v1.51n [ 60 ] https://fiji.sc/ NanoJ toolbox for ImageJ [ 40 ] https://bitbucket.org/rhenriqueslab/nanoj-core/wiki/Home QuimP toolbox for ImageJ v17.04.04 [ 61 ] https://www2.warwick.ac.uk/fac/sci/dcs/people/till_bretschneider/quimp/ KymographClear Macro toolset for ImageJ [ 62 ] https://sites.google.com/site/kymographanalysis/ LookUp Tables Dr David J Williamson (King’s College, London) https://github.com/quokka79/DavLUT Actin Mesh Analyzer [ 14 , 15 ] and this paper https://github.com/alexcarisey/ActinMeshAnalyzer GraphPad Prism 7.03 GraphPad Software https://www.graphpad.com/ DSS Research online tool (statistical power calculation) DSS Research https://www.dssresearch.com/KnowledgeCenter/toolkitcalculators/statisticalpowercalculators.aspx Illustrator CC 22.0.1 (64-bit) Adobe Systems Incorporated http://www.adobe.com/products/illustrator.html Contact for Reagent and Resource Sharing Further information and requests for resources and reagents should be directed to and will be fulfilled by the Lead Contact, Jordan S. Orange, MD PhD ( orange@bcm.edu ). The LAMP1-pHluorin plasmid is patented as US20150212064/WO2013025598A1.
Experimental Model and Subject Details Cell lines and cell culture
NK92 cell line was obtained from the ATCC and was maintained in alpha minimum modified Eagle medium, 0.2 mM myoinositol, 0.1 mM beta-mercaptoethanol, 0.02 mM folic acid, 12.5% heat inactivated horse serum, 12.5% heat-inactivated FBS (Sigma Aldrich), 2 mM L-glutamine and non-essential amino acids (ThermoFisher Scientific), supplemented with 100 U/mL Il-2 (Roche). NK92 expressing LAMP1-pHluorin cells were generated as described previously [ 16 ] and maintained as above. HeLa cells were cultivated in Dulbecco’s modified Eagle’s medium with high glucose, supplemented with 10% of heat-inactivated FBS (Sigma Aldrich), 2 mM L-glutamine and non-essential amino acids (ThermoFisher Scientific). All cell lines were maintained in 37°C, 5% CO2 tissue culture incubators and routinely confirmed to be mycoplasma negative using LookOut mycoplasma PCR detection kit (Sigma Aldrich). Functional validation of the LAMP1-pHluorin cell line was performed by flow cytometry to ensure detection of fluorescence following NK cell degranulation as previously described [ 16 ].
Primary cell isolation
T cells were isolated from peripheral blood of adult healthy donors using Pan T cell isolation kit (Miltenyi Biotec). To generate CTL subsets, T cells were sorted (BD Influx). Live, single, CD8 + cells (clone RPA-T8) were two-way sorted into CD45RO + (clone UCHL1) or CD45RA + (clone HI100). Cells were rested overnight at 37°C in clone media: Dulbecco’s modified Eagle’s medium supplemented with 10% human serum, 2 mM L-glutamine, 1 mM sodium pyruvate, 1 mM penicillin/streptomycin and 1 mM non-essential amino acids (all obtained from ThermoFisher Scientific). NK cells were isolated from peripheral blood using NK cell negative isolation kit (Miltenyi Biotec). For experiments using fresh NK cells, cells were maintained in clone media at 37°C and used 2-4 hr after isolation. Rested NK cells were maintained in clone media supplemented with 150 units/mL recombinant human IL-2 (Roche) and were used 5-6 days after isolation. All samples were acquired with approval from the Institutional Review Boards of Texas Children’s Hospital and University of Manchester under the guidelines of the Declaration of Helsinki. Method Details Plasmids and transfection mApple-LAMP1-pHluorin-N-8 was a gift from Dr. Michael Davidson (Addgene #54918). A LifeAct expressing plasmid was a gift from Dr. Janis Burkhardt (University of Pennsylvania). The LeGO-E plasmid containing Emerald-GFP was a gift from Dr. Boris Fehse (Addgene #27359) and LifeAct was cloned into BamHI and EcoRI restriction sites to create LifeAct.mEmerald. mTurquoise was a gift from Dr. Theodorus Gadella (University of Amsterdam). LifeAct.mTurquoise was generated by cloning LifeAct into the XhoI and EcoRI restriction sites of MIGR1 mTurquoise. NK92 cell lines were generated by retroviral transduction as previously described [ 16 ] or nucleofection using Amaxa Kit R per manufacturer’s instructions (Lonza). Positive cells were amplified under antibiotic selection pressure and were sorted for low, intermediate or high expression of the fluorescently tagged protein on an Aria II Fluorescence Activated Cell Sorter (BD). Each sorted population was then used for pilot experiments to determine the lowest possible expression level required for optimal imaging conditions by confocal, STED, TIRF or SIM.
Sample preparation for microscopy
NK or T cells were activated on #1.5 coverslips (Corning) or LabTek imaging chambers (Nunc) pre-coated with either 5 μg/mL anti-CD18 (clones IB4, TS1/18), anti-NKp30 (clones P30-15, 210847), recombinant human ICAM-1 (R&D Systems), anti-CD3 (clone OKT3) or anti-CD28 (clone CD28.2). Cell activation was performed at 37°C in pre-warmed media. Following activation, cells were fixed using BD CytoFix/CytoPerm or 4% PFA with 0.1% Triton X-100 at room temperature then gently washed with PBS 1% BSA and 0.1% Saponin buffer (Sigma Aldrich). Staining for F-actin was performed in this buffer using phalloidin AlexaFluor 488, or phalloidin AlexaFluor 532 with anti-perforin antibody directly conjugated to AlexaFluor 488 (clone dG9). Coverslips were mounted using ProLong Gold antifade reagent (ThermoFisher Scientific) and slides were cured for 18-24 hr prior to imaging for STED microscopy. For SIM microscopy, Vectashield H-1000 (Vector Laboratories) was used instead. For primary T and NK cell experiments and for live imaging, mounting media was not used and slides were imaged immediately after preparation. All live imaging experiments were performed after washing the cells twice and replacing the growth medium with phenol red free RPMI-1640 medium, supplemented 20mM HEPES (Sigma Aldrich), 2mM L-glutamine, non-essential amino acids (ThermoFisher Scientific) adjusted to pH 7.3. Before use, the medium was supplemented with 100 U/mL Il-2 (Roche) if needed. When indicated, cells were loaded with 1/1000 of LysoTracker Red DND-99 (ThermoFisher Scientific) for 30 min at 37°C before being washed three times or a directly conjugated monoclonal antibody anti-CD107a (clone H4A3) was added to the imaging medium. HeLa cells were labeled with eFluor670 to allow their detection in the live conjugation experiments. In all experiments involving cytoskeletal inhibitors, cells were seeded and incubated for 15 min prior to the addition of an equivalent volume of pre-warmed medium containing blebbistatin, CK666, jasplakinolide or DMSO (all from Sigma Aldrich) as a vehicle control at double the final concentration (final concentrations: 40 μM blebbistatin, 50 μM CK666, 1 μM jasplakinolide, 50 μM SMIFH2). On all systems, live imaging was performed at 37°C using environmental chambers or stage top inserts.
Confocal and STED microscopy
Images were acquired through an HCX PL APO 100 × /1.40 NA oil objective on a Leica TCS SP8 STED 3X laser scanning confocal microscope (Leica Microsystems). Excitation was performed by sequential combination using pulsed white-light laser and emission was detected using time-gated HyD detectors operating in standard mode. When indicated, STED depletion lasers (592 nm or 660 nm) were applied to obtain higher resolution for the dyes AlexaFluor 488 and AlexaFluor 532 (STED 592 nm) or for the fluorescent proteins mTurquoise and mEmerald (STED 660nm). Images were acquired by LASAF software v3.3 and exported for processing and analysis as raw data. Fixed cell images were deconvolved using CMLE algorithm in Huygens (v16.10, Scientific Volume Imaging) with a signal-to-noise ratio of 10.
TIRF microscopy live imaging acquisition
Images were acquired through an APO N TIRF 60 × /1.49 NA oil objective on an Olympus IX81. Excitation by 488 nm (Spectra Physics) and 561 nm (Cobolt) lasers was combined using an LMM5 laser merge module and delivered to a Spectral Diskovery TIRF (Oxford Instruments) with an identical penetration depth set to 150 nm for all wavelengths.
Image acquisition by a C9100 EM-CCD camera
(Hamamatsu) was handled by MetaMorph (v7.8.3).
Cell viability assay following drug treatment
NK92 cells were activated on #1 LabTek imaging chambers (Nunc) pre-coated with 5 μg/mL anti-CD18 (clone IB4) and anti-NKp30 (clones P30-15, 210847). Cell activation was performed at 37°C in pre-warmed imaging media for 15 min prior to the addition of an equivalent volume of pre-warmed imaging medium containing blebbistatin, CK666, jasplakinolide, SMIFH2, DMSO as a vehicle control, and Triton X-100 as a positive control (all from Sigma Aldrich) at double the final concentration (final concentrations: 40 μM blebbistatin, 50 μM CK666, 1 μM jasplakinolide, 50 μM SMIFH2, 1/500 DMSO, 0.2% Triton X-100). After 10 min of incubation in presence of the drug, the cells were washed twice with pre-warmed imaging medium before being covered with pre-warmed imaging medium containing 0.2 μM SYTOX orange (ThermoFisher Scientific). After 5 min of incubation, a 3x3 tile scan (1.72 × 1.72 mm 2 ) was acquired by confocal microscopy through an HC PL APO CS2 20 × /0.75 NA immersion objective on a Leica TCS SP8 STED 3X laser scanning confocal microscope. Excitation was performed using pulsed white-light laser and emission was detected using time-gated HyD detectors operating in standard mode, alongside with the transmitted light channel. Images were acquired by LASAF software v3.3 and exported for processing and analysis in Fiji. Images were analyzed using a custom script. Briefly, binary masks of individual cells were created using the threshold tool after applying a bandpass filter (10-30 pixels range) to the transmitted light channel. Cell outlines were filtered to remove incorrectly identified debris and shadows using size and circularity cut-offs (25-400μm 2 and 0.6-1.0, respectively). Intensity of SYTOX channel was then measured for each cell using the masks and plotted using GraphPad Prism.
Fixed SIM and live TIRF-SIM microscopy
Fixed cells were imaged using a GE DeltaVision OMX v3 with Blaze SIM module in SIM illumination mode. Fluorescence was collected through a 60 × /1.4 NA oil objective and captured on a sCMOS camera at 95 MHz across a 512 × 512 pixels area with no binning and a camera pixel size of 80 nm under the control of SoftWorx 6.5.2. Each frame was reconstructed using 3 orientations and 5 phase shifts and a Wiener filter constant of 0.005 before applying a Gaussian filter with a sigma value of 80 nm. The final reconstructed image has a pixel size of 40nm. Live cells were imaged using a GE OMX SR microscope in TIRF-SIM illumination mode. Fluorescence was collected through a 60 × /1.4 NA oil objective and captured on a sCMOS camera at 286 MHz across a 1024 × 1024 pixels area with no binning and a camera pixel size of 80 nm under the control of SoftWorx 6.5.2. Each frame was reconstructed using 3 orientations and 3 phase shifts and a Wiener filter constant of 0.005 before applying a Gaussian filter with a sigma value of 80 nm. The final reconstructed image has a pixel size of 40 nm.
Parameters of live cell imaging experiments Figure Method
Frame rate Duration Pixel size (final image) Average FWHM measured using a thin fibrillar structure 1 A Confocal Every 15 s 30 min 89 nm - 1 B and 1C Confocal Every 51-80 s 60 min 113 nm - 1 D Confocal Every 15 s 30 min 89 nm - 1 E Confocal Every 89 s 90 min 180 nm xy, 800 nm z - 1 F TIRF-SIM Every 10 s 10 min 40 nm 130 nm 1 G TIRF 1 frame - 65 nm 250 nm 2 A STED Fixed - 40 nm 120 nm 2 B STED Fixed - 40 nm 120 nm 2 C SIM Fixed - 40 nm 130 nm 2 D STED Every 10 s 3 min 30 nm 150 nm 2 E STED Fixed - 30 nm 120 nm 3 TIRF-SIM Every 5 s 5 min 40 nm 130 nm 4 A–4C TIRF-SIM Every 5 s 5 min 40 nm 130 nm 4 D STED Fixed - 30 nm 120 nm 4 E TIRF-SIM Every 5 s Discontinuous (drug treatment, washout) 40 nm 130 nm 5 A–5C STED Fixed - 30 nm 150 nm 5 D TIRF Every 1 s 5 min 65 nm 250 nm 5 E and 5F STED Every 10 s 3 min 50 nm 180 nm 5 G–5I STED Fixed - 30 nm 150 nm 6 STED Every 10 s 3 min 30 nm 150 nm S1 A Confocal Every 51-80 s 60 min 113 nm - S1 B Confocal Every 2min 60 min 113 nm - S1 C 3D-SIM Fixed - 40 nm xy, 125 nm z 130 nm xy, 300 nm z S1 D 3D-STED Fixed - 30 nm xy, 100 nm z 120 nm xy, 250 nm z S2 STED Fixed - 30 nm 120 nm S3 A and S3B TIRF-SIM Every 3 s 1 min 40 nm - S3 C and S3D STED Every 10 s 2 min 50 nm - S3 E TIRF-SIM Every 5 s 5 min 40 nm 130 nm S3 F STED Every 10 s 2 min 50 nm 180 nm S3 G STED Every 10 s 2 min 50 nm 180 nm S3 H STED Every 1 s 15 s 50 nm 180 nm S3 I STED Every 10 s 1 min 50 s 50 nm 180 nm S3 J TIRF-SIM Every 5 s 5 min 40 nm 130 nm S3 K TIRF-SIM Every 5 s 5 min 40 nm 130 nm S4 A Confocal 1 frame - 568 nm - S4 B TIRF-SIM Every 5 s Discontinuous for drug treatment and washout 40 nm 130 nm S4 C–S4E Confocal Every 1 min Discontinuous for drug treatment and washout 101 nm 230 nm S5 TIRF Every 1 s 5 min 65 nm 250 nm Image analysis Line profile Brightness and contrast in live cell images were uniformly thresholded prior to analysis using Fiji (v1.51n). Line profiles were generated in Fiji and measurements were exported to Prism for visualization.
Measurement of actin clearances
Detection and measurement of F-actin clearances was performed as described previously [ 16 ]. In summary, images were imported to Fiji and background subtracted using Rolling Ball Subtraction with a radius of 50 pixels. Pixel intensities were squared twice. An ROI (50-100 μm 2 ) was drawn in the central region of the synapse and thresholded using the default threshold in Fiji with “dark background” unchecked. Clearances were detected using the Analyze Particles function, with a clearance with an area of 0.05 μm 2 considered permissive for a 150 nm diameter lytic granule with the assumption of uniform circularity. Clearance measurements (number, area) were exported to Excel and the frequency of clearances was measured per μm 2 based upon the area of the ROI for the given cell. For live cell imaging series, this algorithm was applied to each frame individually. Multichannel images were split prior to analysis of only the F-actin channel. Measurement of mean hole area and granule penetrable area were made from STED, SIM and TIRF-SIM datasets using an updated version of the MATLAB app previously published [ 15 ]. The Orientation Filter Transform (OFT) was part of the NanoJ toolbox for ImageJ [ 40 ].
Quantification of LifeAct fluorescent signal
Measurement of LifeAct fluorescence signal intensity and NK92 cell footprint over time was performed by thresholding the raw data using the fluorescence channel information and using the Analyze Particles / Measurement functions in Fiji. When indicated, the footprint of the cell over time was normalized using the lowest value measured and the maximum area reached by each cell when the spreading measurement reaches a plateau. Measurement of the spreading speed of the NK92 cells onto the different coated surfaces was done by extracting the coefficient from the linear fit of the spreading area curve. The portion of the curve used for the fit is limited by the first time point when the cell is visible until the first time point when the cell has reached its maximum spreading area (plateau). All values were analyzed and plotted in Prism. Normalized sizes using 0% as the smallest footprint detected and 100% as the maximum footprint size are presented in Figure S1 A. Measurement of the edge of the IS Segmentation and plotting of the intensity of the LifeAct fluorescence signal in the 2 μm wide outer rim of the cell was obtained using QuimP plugin [ 61 ] for Fiji (v17.04.04).
Kymograph analysis
Kymographs analyzing the fluorescent signal over time were prepared using the Reslice tool in Fiji or using the KymographClear toolbox for Fiji [ 62 ] when extraction of the stable, forward and backward components was necessary.
Optical flow analysis
Raw images obtained by TIRF-SIM were subjected to linear signal scaling before being exported as 8-bit TIFF stacks using Fiji. A custom MATLAB script using Farnback algorithm for optical flow (opticalFlowFarneback function, implemented since r2015b) was then applied (NumPyramidLevels = 3, PyramidScale = 0.5, NumIteration = 3, NeighborhoodSize = 5, FilterSize = 15) and the resulting flow object was plotted with a decimation factor of 5 and a scaling value of 2.
Population-based degranulation measurement
Detection of lytic granules and degranulation of NK92.LAMP1-pHluorin for Figure 1 G was performed using image segmentation and detection algorithms in Volocity (PerkinElmer). The frequency of degranulation was calculated as the number of cells with a positive LAMP1-pHluorin signal over the total number of cells observed within 75 min of imaging following addition of cells to imaging chambers. Events smaller than 0.05 μm 2 were excluded from analysis and fluorescent thresholds were uniformly applied to each cell within a given experiment.
Degranulation analysis
NK92.mApple-LAMP1-pHluorin cells were plated on activating surface for 20 min and treated with cytoskeletal inhibitors for 10 min. In the following 15 min, 3 time lapses of 5 min each were acquired (1 frame/sec) and the number of degranulation in each cell was measured as follows. Raw multichannel acquired by TIRF microscopy were imported into Imaris (v8.4.1, Bitplane). All vesicles present in the mApple channel were segmented and tracked using the “Spot” tool with the following settings: size 0.5 μm, local background subtraction, auto quality setting filtering and default settings for tracking (1 frame gap allowed). The mean intensity of the pHluorin signal within each object was measured throughout the lifetime of the trajectory and the standard deviation of the intensity over time was calculated. Each object displaying a standard deviation equal to more than two times the standard deviation of a non-degranulating object was considered as a degranulation event after manual confirmation by visual inspection.
Figure preparation
Acquired images from microscopy based experiments were subjected to signal re-scaling using linear transformation using Fiji [ 60 ] for display in the figures. All figures were prepared using Illustrator CC 22.0.1 (Adobe Systems).
Quantification and Statistical Analysis
Sample sizes were determined using statistical power calculator with an alpha error level of 5% (DSS Research online tool). From the initiation of the study, datasets were tested for outliers using robust regression and outlier removal (ROUT) with a Q value of 1% [ 63 ]. Data was assessed for normality using D’Agostino and Pearson omnibus normality test and if criteria for Gaussian distribution were not met, Mann-Whitney tests were applied to compare datasets with two samples (two-tailed). Ordinary one-way ANOVA test for multiple comparisons with Tukey’s post hoc test was used for multiple comparisons of groups with normal distribution. Unpaired two-tailed Student’s t test was used for comparison of two samples with normal distribution. Welch’s correction was applied in case of unequal variance. A p value of less than 0.05 was considered significant. Statistical analyses and graphing were performed using Prism (v7.03, GraphPad). All boxplots graphs presented in this study indicate the mean value and the standard deviation for the population considered.
Figure Sample size and repeat Statistical test
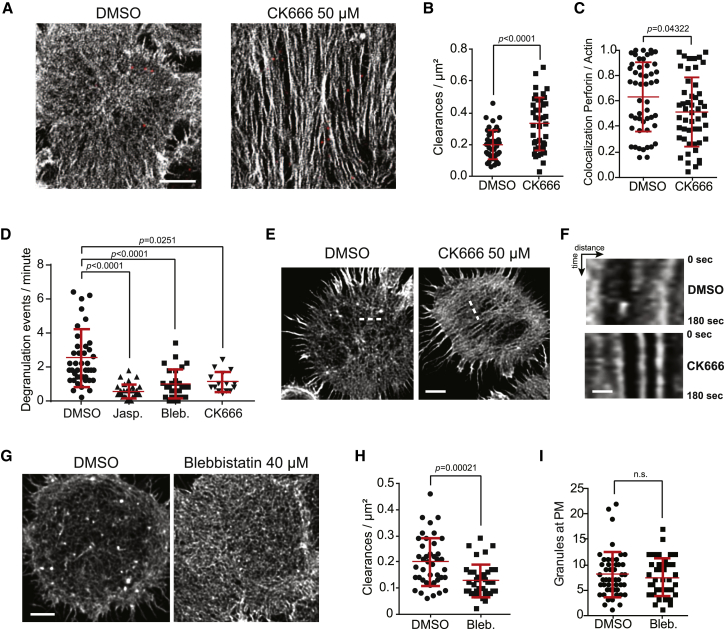
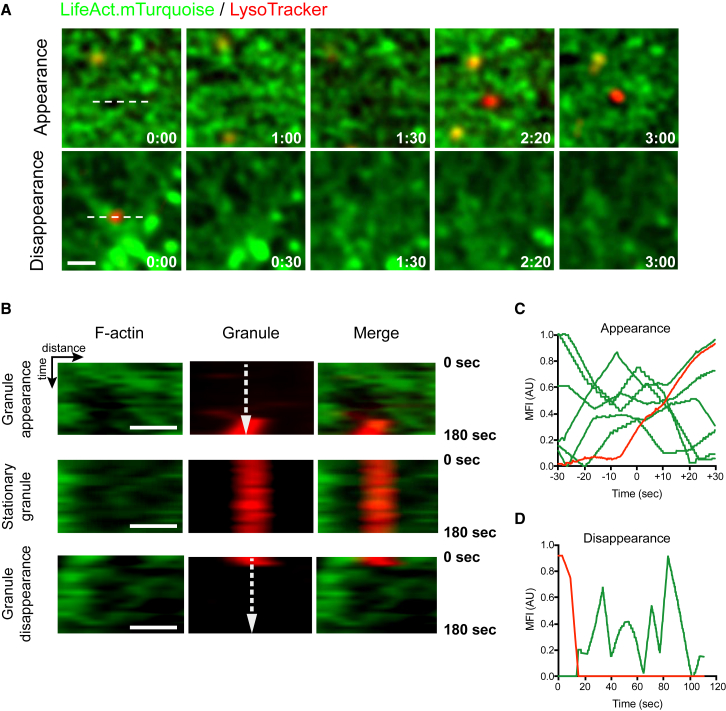
Outlier removal 1 A Representative images from 3 independent repeats with 10 cells each time. N/A N/A 1 B N = 37, 21 and 35 cells respectively per condition from 3, 4 and 4 independent experiments respectively One-way ANOVA Kruskal-Wallis test (Dunn’s) No 1 C N = 37, 21 and 35 cells respectively per condition from 3, 4 and 4 independent experiments respectively Ordinary one-way ANOVA with Tukey’s post hoc comparison No 1 D Representative cells from Figure 1 A N/A N/A 1 E Representative images selected from 3 independent repeats N/A N/A 1 F Representative images selected from 43 cells from 6 experiments N/A N/A 1 G N = 60, 67, 64 respectively from 3 independent experiments N/A N/A 2 A Representative images selected from more than 65 cells per condition pooled from 5 independent repeats N/A N/A 2 B N = 58, 59, 59 and 59 cells respectively per condition pooled from 4 independent repeats Ordinary one-way ANOVA with Tukey’s post hoc comparison No 2 C N = 20 cells per condition from 1 experiment representative of 3 independent repeats One-way ANOVA Kruskal-Wallis test (Dunn’s) ROUT 1% 2 D Representative images selected from 20 cells from 2 independent repeats N/A N/A 2 E N = 10, 13, 24, 37, 41, 50, 49, 50 and 61 cells respectively pooled from 3 independent repeats One-way ANOVA Kruskal-Wallis test (Dunn’s) No 3 A Representative images selected from 43 cells from 6 independent repeats N/A N/A 3 B Representative images selected from 43 cells from 6 independent repeats N/A N/A 3 C Quantification from dataset presented in Figures 3 B and 3D N/A N/A 3 D Representative images selected from 43 cells from 6 independent repeats N/A N/A 3 E Quantification from dataset presented in Figures 3 B and 3D N/A N/A 3 F Quantification from dataset presented in Figures 3 B and 3D N/A N/A 4 A Representative images selected from 43 cells from 6 independent repeats N/A N/A 4 B Details from dataset presented in Figure 4 A N/A N/A 4 C N = 20 cells from 4 independent repeats N/A No 4 D N = 10 and 13 cells respectively from 1 experiment representative of 4 independent repeats Mann-Whitney, two-tailed test No 4 E Representative images selected from 12 cells from 4 independent repeats N/A N/A 5 A Representative images selected from more than 100 cells imaged from 4 independent repeats N/A N/A 5 B N = 41 per condition from 2 pooled independent experiments representative of 4 independent repeats Unpaired t-test with Welch’s correction, two-tailed ROUT 1% 5 C N = 50 per condition from 2 pooled independent experiments representative of 4 independent repeats Unpaired Mann-Whitney, two-tailed test ROUT 1% 5 D N = 41, 28, 31 and 15 cells respectively per condition pooled from 3 independent repeats One-way ANOVA Kruskal-Wallis test (Dunn’s) ROUT 1% 5 E Representative images selected from 24 cells from 4 experiments N/A N/A 5 F Representative images selected from 24 cells from 4 experiments N/A N/A 5 G Representative images selected from 41 and 38 cells respectively from 4 experiments N/A N/A 5 H N = 41 and 38 cells respectively from two pooled independent experiments representative of 4 repeats Unpaired Mann-Whitney, two-tailed test ROUT 1% 5 I N = 48 and 39 cells respectively from two pooled independent experiments representative of 4 repeats Unpaired Mann-Whitney, two-tailed test ROUT 1% 6 A Data representative of 24 cells from 3 independent experiments. N/A N/A 6 B Data representative of 24 cells from 3 independent experiments. N/A N/A 6 C Data representative of 24 cells from 3 independent experiments (MFI of actin at the location of 6 granules normalized to their arrival, 1 example of granule in red) N/A N/A 6 D Data representative of 24 cells from 3 independent experiments (MFI of actin at the location of 1 granule normalized to their arrival, 1 example of granule in red) N/A N/A S1 A N = 37, 21 and 35 cells respectively per condition from 3, 4 and 4 independent experiments respectively N/A N/A S1 B Representative images selected from 7 independent repeats N/A N/A S1 C Representative image selected from 1 repeat from 2C N/A N/A S1 D Representative image selected from 1 repeat from 2A N/A N/A S2 A Representative images selected from 17 cells N/A N/A S2 B N = 11 cells pooled from 2 independent repeats N/A N/A S2 C N = 11 cells pooled from 2 independent repeats N/A N/A S2 D Representative images selected from S2EF N/A N/A S2 E N = 10 cells per condition per donor for 4 donors, each donor colored individually One-way ANOVA Kruskal-Wallis test (Dunn’s) No S2 F N = 10 cells per condition per donor for 4 donors, each donor colored individually One-way ANOVA Kruskal-Wallis test (Dunn’s) No S2 G Representative images selected from S2HI N/A N/A S2 H N = 10 cells per condition per donor for 4 donors, each donor colored individually One-way ANOVA Kruskal-Wallis test (Dunn’s) No S2 I N = 10 cells per condition per donor for 4 donors, each donor colored individually One-way ANOVA Kruskal-Wallis test (Dunn’s) No S2 J Representative images selected from S2KL N/A N/A S2 K N = 10 cells per condition per donor for 3 donors, each donor colored individually One-way ANOVA Kruskal-Wallis test (Dunn’s) No S2 L N = 10 cells per condition per donor for 3 donors, each donor colored individually One-way ANOVA Kruskal-Wallis test (Dunn’s) No S2 M Representative images selected from S2NO N/A N/A S2 N N = 10 cells per condition per donor for 4 donors, each donor colored individually One-way ANOVA Kruskal-Wallis test (Dunn’s) No S2 O N = 10 cells per condition per donor for 4 donors, each donor colored individually One-way ANOVA Kruskal-Wallis test (Dunn’s) No S3 A N = 33 cells pooled from 6 independent repeats N/A N/A S3 B N = 33 cells pooled from 6 independent repeats N/A N/A S3 C N = 6 cells from 1 experiment representative of 3 independent repeats N/A N/A S3 D N = 7 cells from 1 experiment representative of 3 independent repeats Unpaired Mann-Whitney, two-tailed test No S3 E Representative images selected from 43 cells from 6 independent repeats N/A N/A S3 F Representative images selected from 25 cells from 3 independent experiments N/A N/A S3 G N = 5 cells from 1 experiment representative of 3 independent repeats N/A N/A S3 H N = 6 cells from 1 experiment representative of 3 independent repeats N/A N/A S3 I N = 10 cells from 1 experiment representative of 3 independent repeats Unpaired Mann-Whitney, two-tailed test No S3 J Representative images selected from 43 cells from 6 independent repeats N/A N/A S3 K Representative images selected from 28 cells from 3 experiments N/A N/A S4 A N = 3846, 3451, 2358, 3829, 5124, 2476 and 4125 cells respectively from a representative experiment of 2 repeats. N/A N/A S4 B Representative images selected from 12 cells from 4 independent repeats N/A N/A S4 C N = 10 cells from a representative experiment out of 6 independent repeats (error bars represent 95% CI). N/A N/A S4 D N = 10 cells from a representative experiment out of 6 independent repeats (error bars represent 95% CI). N/A N/A S4 E N = 10 cells from a representative experiment out of 6 independent repeats (error bars represent 95% CI). N/A N/A S5 A N/A N/A N/A S5 B N = 6 representative traces from 11 cells from dataset used in Figures S5 D–S5I (DMSO) N/A N/A S5 C Representative images selected from 11 cells from dataset used in Figures S5 D–S5I (DMSO) N/A N/A S5 D N = 11 and 15 cells respectively from 1 experiment representative of 3 independent repeats Unpaired t-test with Welch’s correction, two-tailed No S5 E N = 11 and 15 cells respectively from 1 experiment representative of 3 independent repeats Unpaired t-test with Welch’s correction, two-tailed No S5 F N = 11 and 15 cells respectively from 1 experiment representative of 3 independent repeats N/A No S5 G N = 11 and 15 cells respectively from 1 experiment representative of 3 independent repeats N/A No S5 H N = 11 and 15 cells respectively from 1 experiment representative of 3 independent repeats N/A No S5 I N = 11 and 15 cells respectively from 1 experiment representative of 3 independent repeats N/A No
Experimental Model and Subject Details Cell lines and cell culture
NK92 cell line was obtained from the ATCC and was maintained in alpha minimum modified Eagle medium, 0.2 mM myoinositol, 0.1 mM beta-mercaptoethanol, 0.02 mM folic acid, 12.5% heat inactivated horse serum, 12.5% heat-inactivated FBS (Sigma Aldrich), 2 mM L-glutamine and non-essential amino acids (ThermoFisher Scientific), supplemented with 100 U/mL Il-2 (Roche). NK92 expressing LAMP1-pHluorin cells were generated as described previously [ 16 ] and maintained as above. HeLa cells were cultivated in Dulbecco’s modified Eagle’s medium with high glucose, supplemented with 10% of heat-inactivated FBS (Sigma Aldrich), 2 mM L-glutamine and non-essential amino acids (ThermoFisher Scientific). All cell lines were maintained in 37°C, 5% CO2 tissue culture incubators and routinely confirmed to be mycoplasma negative using LookOut mycoplasma PCR detection kit (Sigma Aldrich). Functional validation of the LAMP1-pHluorin cell line was performed by flow cytometry to ensure detection of fluorescence following NK cell degranulation as previously described [ 16 ].
Primary cell isolation
T cells were isolated from peripheral blood of adult healthy donors using Pan T cell isolation kit (Miltenyi Biotec). To generate CTL subsets, T cells were sorted (BD Influx). Live, single, CD8 + cells (clone RPA-T8) were two-way sorted into CD45RO + (clone UCHL1) or CD45RA + (clone HI100). Cells were rested overnight at 37°C in clone media: Dulbecco’s modified Eagle’s medium supplemented with 10% human serum, 2 mM L-glutamine, 1 mM sodium pyruvate, 1 mM penicillin/streptomycin and 1 mM non-essential amino acids (all obtained from ThermoFisher Scientific). NK cells were isolated from peripheral blood using NK cell negative isolation kit (Miltenyi Biotec). For experiments using fresh NK cells, cells were maintained in clone media at 37°C and used 2-4 hr after isolation. Rested NK cells were maintained in clone media supplemented with 150 units/mL recombinant human IL-2 (Roche) and were used 5-6 days after isolation. All samples were acquired with approval from the Institutional Review Boards of Texas Children’s Hospital and University of Manchester under the guidelines of the Declaration of Helsinki.
Method Details Plasmids and transfection mApple-LAMP1-pHluorin-N-8 was a gift from Dr. Michael Davidson (Addgene #54918). A LifeAct expressing plasmid was a gift from Dr. Janis Burkhardt (University of Pennsylvania). The LeGO-E plasmid containing Emerald-GFP was a gift from Dr. Boris Fehse (Addgene #27359) and LifeAct was cloned into BamHI and EcoRI restriction sites to create LifeAct.mEmerald. mTurquoise was a gift from Dr. Theodorus Gadella (University of Amsterdam). LifeAct.mTurquoise was generated by cloning LifeAct into the XhoI and EcoRI restriction sites of MIGR1 mTurquoise. NK92 cell lines were generated by retroviral transduction as previously described [ 16 ] or nucleofection using Amaxa Kit R per manufacturer’s instructions (Lonza). Positive cells were amplified under antibiotic selection pressure and were sorted for low, intermediate or high expression of the fluorescently tagged protein on an Aria II Fluorescence Activated Cell Sorter (BD). Each sorted population was then used for pilot experiments to determine the lowest possible expression level required for optimal imaging conditions by confocal, STED, TIRF or SIM.
Sample preparation for microscopy
NK or T cells were activated on #1.5 coverslips (Corning) or LabTek imaging chambers (Nunc) pre-coated with either 5 μg/mL anti-CD18 (clones IB4, TS1/18), anti-NKp30 (clones P30-15, 210847), recombinant human ICAM-1 (R&D Systems), anti-CD3 (clone OKT3) or anti-CD28 (clone CD28.2). Cell activation was performed at 37°C in pre-warmed media. Following activation, cells were fixed using BD CytoFix/CytoPerm or 4% PFA with 0.1% Triton X-100 at room temperature then gently washed with PBS 1% BSA and 0.1% Saponin buffer (Sigma Aldrich). Staining for F-actin was performed in this buffer using phalloidin AlexaFluor 488, or phalloidin AlexaFluor 532 with anti-perforin antibody directly conjugated to AlexaFluor 488 (clone dG9). Coverslips were mounted using ProLong Gold antifade reagent (ThermoFisher Scientific) and slides were cured for 18-24 hr prior to imaging for STED microscopy. For SIM microscopy, Vectashield H-1000 (Vector Laboratories) was used instead. For primary T and NK cell experiments and for live imaging, mounting media was not used and slides were imaged immediately after preparation. All live imaging experiments were performed after washing the cells twice and replacing the growth medium with phenol red free RPMI-1640 medium, supplemented 20mM HEPES (Sigma Aldrich), 2mM L-glutamine, non-essential amino acids (ThermoFisher Scientific) adjusted to pH 7.3. Before use, the medium was supplemented with 100 U/mL Il-2 (Roche) if needed. When indicated, cells were loaded with 1/1000 of LysoTracker Red DND-99 (ThermoFisher Scientific) for 30 min at 37°C before being washed three times or a directly conjugated monoclonal antibody anti-CD107a (clone H4A3) was added to the imaging medium. HeLa cells were labeled with eFluor670 to allow their detection in the live conjugation experiments. In all experiments involving cytoskeletal inhibitors, cells were seeded and incubated for 15 min prior to the addition of an equivalent volume of pre-warmed medium containing blebbistatin, CK666, jasplakinolide or DMSO (all from Sigma Aldrich) as a vehicle control at double the final concentration (final concentrations: 40 μM blebbistatin, 50 μM CK666, 1 μM jasplakinolide, 50 μM SMIFH2). On all systems, live imaging was performed at 37°C using environmental chambers or stage top inserts.
Confocal and STED microscopy
Images were acquired through an HCX PL APO 100 × /1.40 NA oil objective on a Leica TCS SP8 STED 3X laser scanning confocal microscope (Leica Microsystems). Excitation was performed by sequential combination using pulsed white-light laser and emission was detected using time-gated HyD detectors operating in standard mode. When indicated, STED depletion lasers (592 nm or 660 nm) were applied to obtain higher resolution for the dyes AlexaFluor 488 and AlexaFluor 532 (STED 592 nm) or for the fluorescent proteins mTurquoise and mEmerald (STED 660nm). Images were acquired by LASAF software v3.3 and exported for processing and analysis as raw data. Fixed cell images were deconvolved using CMLE algorithm in Huygens (v16.10, Scientific Volume Imaging) with a signal-to-noise ratio of 10.
TIRF microscopy live imaging acquisition
Images were acquired through an APO N TIRF 60 × /1.49 NA oil objective on an Olympus IX81. Excitation by 488 nm (Spectra Physics) and 561 nm (Cobolt) lasers was combined using an LMM5 laser merge module and delivered to a Spectral Diskovery TIRF (Oxford Instruments) with an identical penetration depth set to 150 nm for all wavelengths.
Image acquisition by a C9100 EM-CCD camera
(Hamamatsu) was handled by MetaMorph (v7.8.3).
Cell viability assay following drug treatment
NK92 cells were activated on #1 LabTek imaging chambers (Nunc) pre-coated with 5 μg/mL anti-CD18 (clone IB4) and anti-NKp30 (clones P30-15, 210847). Cell activation was performed at 37°C in pre-warmed imaging media for 15 min prior to the addition of an equivalent volume of pre-warmed imaging medium containing blebbistatin, CK666, jasplakinolide, SMIFH2, DMSO as a vehicle control, and Triton X-100 as a positive control (all from Sigma Aldrich) at double the final concentration (final concentrations: 40 μM blebbistatin, 50 μM CK666, 1 μM jasplakinolide, 50 μM SMIFH2, 1/500 DMSO, 0.2% Triton X-100). After 10 min of incubation in presence of the drug, the cells were washed twice with pre-warmed imaging medium before being covered with pre-warmed imaging medium containing 0.2 μM SYTOX orange (ThermoFisher Scientific). After 5 min of incubation, a 3x3 tile scan (1.72 × 1.72 mm 2 ) was acquired by confocal microscopy through an HC PL APO CS2 20 × /0.75 NA immersion objective on a Leica TCS SP8 STED 3X laser scanning confocal microscope. Excitation was performed using pulsed white-light laser and emission was detected using time-gated HyD detectors operating in standard mode, alongside with the transmitted light channel. Images were acquired by LASAF software v3.3 and exported for processing and analysis in Fiji. Images were analyzed using a custom script. Briefly, binary masks of individual cells were created using the threshold tool after applying a bandpass filter (10-30 pixels range) to the transmitted light channel. Cell outlines were filtered to remove incorrectly identified debris and shadows using size and circularity cut-offs (25-400μm 2 and 0.6-1.0, respectively). Intensity of SYTOX channel was then measured for each cell using the masks and plotted using GraphPad Prism.
Fixed SIM and live TIRF-SIM microscopy
Fixed cells were imaged using a GE DeltaVision OMX v3 with Blaze SIM module in SIM illumination mode. Fluorescence was collected through a 60 × /1.4 NA oil objective and captured on a sCMOS camera at 95 MHz across a 512 × 512 pixels area with no binning and a camera pixel size of 80 nm under the control of SoftWorx 6.5.2. Each frame was reconstructed using 3 orientations and 5 phase shifts and a Wiener filter constant of 0.005 before applying a Gaussian filter with a sigma value of 80 nm. The final reconstructed image has a pixel size of 40nm. Live cells were imaged using a GE OMX SR microscope in TIRF-SIM illumination mode. Fluorescence was collected through a 60 × /1.4 NA oil objective and captured on a sCMOS camera at 286 MHz across a 1024 × 1024 pixels area with no binning and a camera pixel size of 80 nm under the control of SoftWorx 6.5.2. Each frame was reconstructed using 3 orientations and 3 phase shifts and a Wiener filter constant of 0.005 before applying a Gaussian filter with a sigma value of 80 nm. The final reconstructed image has a pixel size of 40 nm.
Parameters of live cell imaging experiments Figure Method
Frame rate Duration Pixel size (final image) Average FWHM measured using a thin fibrillar structure 1 A Confocal Every 15 s 30 min 89 nm - 1 B and 1C Confocal Every 51-80 s 60 min 113 nm - 1 D Confocal Every 15 s 30 min 89 nm - 1 E Confocal Every 89 s 90 min 180 nm xy, 800 nm z - 1 F TIRF-SIM Every 10 s 10 min 40 nm 130 nm 1 G TIRF 1 frame - 65 nm 250 nm 2 A STED Fixed - 40 nm 120 nm 2 B STED Fixed - 40 nm 120 nm 2 C SIM Fixed - 40 nm 130 nm 2 D STED Every 10 s 3 min 30 nm 150 nm 2 E STED Fixed - 30 nm 120 nm 3 TIRF-SIM Every 5 s 5 min 40 nm 130 nm 4 A–4C TIRF-SIM Every 5 s 5 min 40 nm 130 nm 4 D STED Fixed - 30 nm 120 nm 4 E TIRF-SIM Every 5 s Discontinuous (drug treatment, washout) 40 nm 130 nm 5 A–5C STED Fixed - 30 nm 150 nm 5 D TIRF Every 1 s 5 min 65 nm 250 nm 5 E and 5F STED Every 10 s 3 min 50 nm 180 nm 5 G–5I STED Fixed - 30 nm 150 nm 6 STED Every 10 s 3 min 30 nm 150 nm S1 A Confocal Every 51-80 s 60 min 113 nm - S1 B Confocal Every 2min 60 min 113 nm - S1 C 3D-SIM Fixed - 40 nm xy, 125 nm z 130 nm xy, 300 nm z S1 D 3D-STED Fixed - 30 nm xy, 100 nm z 120 nm xy, 250 nm z S2 STED Fixed - 30 nm 120 nm S3 A and S3B TIRF-SIM Every 3 s 1 min 40 nm - S3 C and S3D STED Every 10 s 2 min 50 nm - S3 E TIRF-SIM Every 5 s 5 min 40 nm 130 nm S3 F STED Every 10 s 2 min 50 nm 180 nm S3 G STED Every 10 s 2 min 50 nm 180 nm S3 H STED Every 1 s 15 s 50 nm 180 nm S3 I STED Every 10 s 1 min 50 s 50 nm 180 nm S3 J TIRF-SIM Every 5 s 5 min 40 nm 130 nm S3 K TIRF-SIM Every 5 s 5 min 40 nm 130 nm S4 A Confocal 1 frame - 568 nm - S4 B TIRF-SIM Every 5 s Discontinuous for drug treatment and washout 40 nm 130 nm S4 C–S4E Confocal Every 1 min Discontinuous for drug treatment and washout 101 nm 230 nm S5 TIRF Every 1 s 5 min 65 nm 250 nm Image analysis Line profile Brightness and contrast in live cell images were uniformly thresholded prior to analysis using Fiji (v1.51n). Line profiles were generated in Fiji and measurements were exported to Prism for visualization.
Measurement of actin clearances
Detection and measurement of F-actin clearances was performed as described previously [ 16 ]. In summary, images were imported to Fiji and background subtracted using Rolling Ball Subtraction with a radius of 50 pixels. Pixel intensities were squared twice. An ROI (50-100 μm 2 ) was drawn in the central region of the synapse and thresholded using the default threshold in Fiji with “dark background” unchecked. Clearances were detected using the Analyze Particles function, with a clearance with an area of 0.05 μm 2 considered permissive for a 150 nm diameter lytic granule with the assumption of uniform circularity. Clearance measurements (number, area) were exported to Excel and the frequency of clearances was measured per μm 2 based upon the area of the ROI for the given cell. For live cell imaging series, this algorithm was applied to each frame individually. Multichannel images were split prior to analysis of only the F-actin channel. Measurement of mean hole area and granule penetrable area were made from STED, SIM and TIRF-SIM datasets using an updated version of the MATLAB app previously published [ 15 ]. The Orientation Filter Transform (OFT) was part of the NanoJ toolbox for ImageJ [ 40 ].
Quantification of LifeAct fluorescent signal
Measurement of LifeAct fluorescence signal intensity and NK92 cell footprint over time was performed by thresholding the raw data using the fluorescence channel information and using the Analyze Particles / Measurement functions in Fiji. When indicated, the footprint of the cell over time was normalized using the lowest value measured and the maximum area reached by each cell when the spreading measurement reaches a plateau. Measurement of the spreading speed of the NK92 cells onto the different coated surfaces was done by extracting the coefficient from the linear fit of the spreading area curve. The portion of the curve used for the fit is limited by the first time point when the cell is visible until the first time point when the cell has reached its maximum spreading area (plateau). All values were analyzed and plotted in Prism. Normalized sizes using 0% as the smallest footprint detected and 100% as the maximum footprint size are presented in Figure S1 A. Measurement of the edge of the IS Segmentation and plotting of the intensity of the LifeAct fluorescence signal in the 2 μm wide outer rim of the cell was obtained using QuimP plugin [ 61 ] for Fiji (v17.04.04).
Kymograph analysis
Kymographs analyzing the fluorescent signal over time were prepared using the Reslice tool in Fiji or using the KymographClear toolbox for Fiji [ 62 ] when extraction of the stable, forward and backward components was necessary.
Optical flow analysis
Raw images obtained by TIRF-SIM were subjected to linear signal scaling before being exported as 8-bit TIFF stacks using Fiji. A custom MATLAB script using Farnback algorithm for optical flow (opticalFlowFarneback function, implemented since r2015b) was then applied (NumPyramidLevels = 3, PyramidScale = 0.5, NumIteration = 3, NeighborhoodSize = 5, FilterSize = 15) and the resulting flow object was plotted with a decimation factor of 5 and a scaling value of 2.
Population-based degranulation measurement
Detection of lytic granules and degranulation of NK92.LAMP1-pHluorin for Figure 1 G was performed using image segmentation and detection algorithms in Volocity (PerkinElmer). The frequency of degranulation was calculated as the number of cells with a positive LAMP1-pHluorin signal over the total number of cells observed within 75 min of imaging following addition of cells to imaging chambers. Events smaller than 0.05 μm 2 were excluded from analysis and fluorescent thresholds were uniformly applied to each cell within a given experiment.
Degranulation analysis
NK92.mApple-LAMP1-pHluorin cells were plated on activating surface for 20 min and treated with cytoskeletal inhibitors for 10 min. In the following 15 min, 3 time lapses of 5 min each were acquired (1 frame/sec) and the number of degranulation in each cell was measured as follows. Raw multichannel acquired by TIRF microscopy were imported into Imaris (v8.4.1, Bitplane). All vesicles present in the mApple channel were segmented and tracked using the “Spot” tool with the following settings: size 0.5 μm, local background subtraction, auto quality setting filtering and default settings for tracking (1 frame gap allowed). The mean intensity of the pHluorin signal within each object was measured throughout the lifetime of the trajectory and the standard deviation of the intensity over time was calculated. Each object displaying a standard deviation equal to more than two times the standard deviation of a non-degranulating object was considered as a degranulation event after manual confirmation by visual inspection.
Figure preparation
Acquired images from microscopy based experiments were subjected to signal re-scaling using linear transformation using Fiji [ 60 ] for display in the figures. All figures were prepared using Illustrator CC 22.0.1 (Adobe Systems).
Supplemental Information Document S1. Figures S1–S5 Movie S1. Live-Cell Imaging Time Lapse Showing IS Formation between NK92 and HeLa Cells, Related to Figure 1E Live-cell imaging time lapse of NK92 expressing LifeAct-mEmerald and stained with LysoTracker red in culture with the target cell line HeLa stained with eFluor 670 (cyan) (Z-projected view acquired by line scanning confocal microscopy). Movie S2. F-Actin Structures Visible throughout the Formation of the IS in NK92 Cells, Related to Figure 1F Live-cell imaging of NK92 expressing LifeAct-mEmerald spreading onto glass coated with activating antibodies (anti-CD18 and anti-NKp30) imaged by TIRF-SIM. Left: the raw reconstructed movie. Right: the color-inverted filtered version of the same movie to highlight the presence of actin foci and transversal fibers across the synapse. Movie S3.
Optical Flow Analysis Showing the Absence of Continuous Retrograde
Flow at the Edge of the IS in NK92 Cells, Related to Figures 3C and S3E Live TIRF-SIM cell imaging of NK92 expressing LifeAct-mEmerald spread on glass coated with antibodies anti-CD18 and anti-NKp30 for 30 min. The arrows indicate the direction and amplitude of the flow of actin between frames (5 s). This dataset is used in Figures 3B–3F and S3E. Movie S4. Montage of the Different Visualization Tools Used to Characterize the Nanoscale Dynamism of Actin, Related to Figures 3D and S3J Montage of the various output produced by Actin Mesh Analyzer software from an original input acquired by TIRF-SIM.
Live-cell imaging of NK92 expressing
LifeAct-mEmerald spreading onto glass coated with activating antibodies (anti-CD18 and anti-NKp30) imaged by TIRF-SIM. Top row, from left to right: original image sequence; signal filtered and segmented as the cortical actin mesh; signal left out by the identification of the actin mesh, i.e., raw fluorescence channel within the detected clearances; OFT reconstruction using the filtered mesh. Bottom row, left to right: binary representation of the actin mesh; mapping of the clearance color coded by area (see first color bar at the bottom right); mapping of the penetrable area onto the original sequence, i.e., clearances allowing the passage of a lytic granule of a defined diameter (see second color bar at the bottom right). Movie S5. Treatment of the Mature IS in NK92 Cells with Jasplakinolide Leads to Increased Contraction of a Static Cortical Actin Network, Related to Figures 3B and S3K Live TIRF-SIM cell imaging of NK92 expressing LifeAct-mEmerald spread on glass coated with antibodies anti-CD18 and anti-NKp30 for 30 min. The cell on the right has been treated with 1 μM jasplakinolide to immobilize the F-actin network. The cell is undergoing contraction due to the increase of myosin activity but, more importantly, the whole actin architecture is sliding and not showing signs of nanoscale dynamism, unlike the control cell on the left. Movie S6. The Cortical Actin Network of NK92 Cells Displays Dynamic Actin-Rich Foci, Related to Figure 4B Live TIRF-SIM cell imaging of NK92 expressing LifeAct-mEmerald spread on glass coated with antibodies anti-CD18 and anti-NKp30 for 30 min. The lookup table has been inverted to improve the visualization of the dynamism of the actin foci. The boxes highlight the different types of behaviors of the actin foci observed in Figure 4B. Movie S7. Actin-Rich Foci Are Sensitive to Treatment with the Arp2/3 Inhibitor CK666, Related to Figures 4E and S4B Live TIRF-SIM cell imaging of NK92 expressing LifeAct-mEmerald spread on glass coated with antibodies anti-CD18 and anti-NKp30 for 30 min. Following a control period of imaging, 50 μM CK666 is added to the medium, leading to the disappearance of the actin foci previously visible and a decrease of the total amount of fluorescence of the F-actin reporter at the IS. Following washout of the drug with medium, the cell recovers and new actin foci appear within the first minute. Document S2. Article plus Supplemental Information
📊 Figures
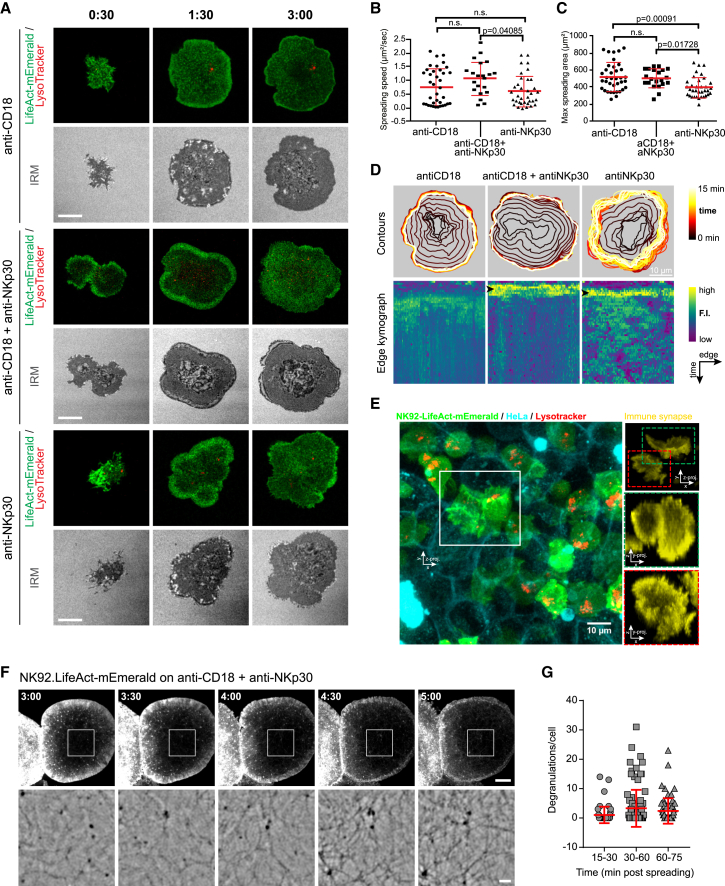
Figureu00a01
Mature NK Cell Lytic Synapse Is Defined by a Pervasive F-Actin Network (A) Representative frames from NK92.LifeAct-mEmerald stained with LysoTracker red and seeded on the indicated antibody-coated gla...
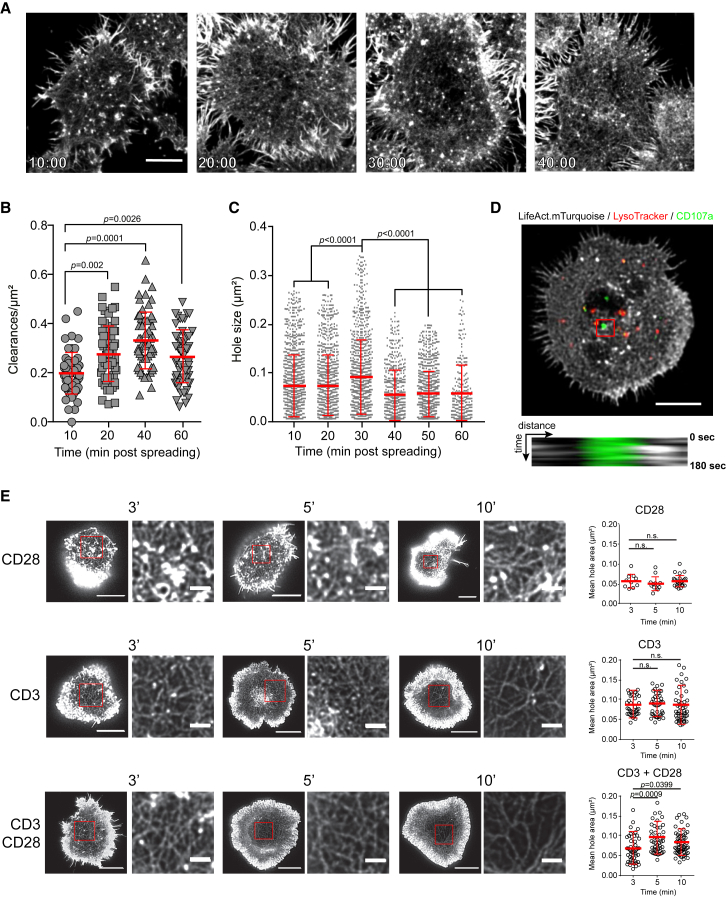
Figureu00a02
Granule-Permissive-Sized Clearances Persist following Degranulation and Are a Feature of NK and Cytotoxic T Cells (A) Representative images of NK92 activated on anti-CD18- and anti-NKp30-coated glass ...
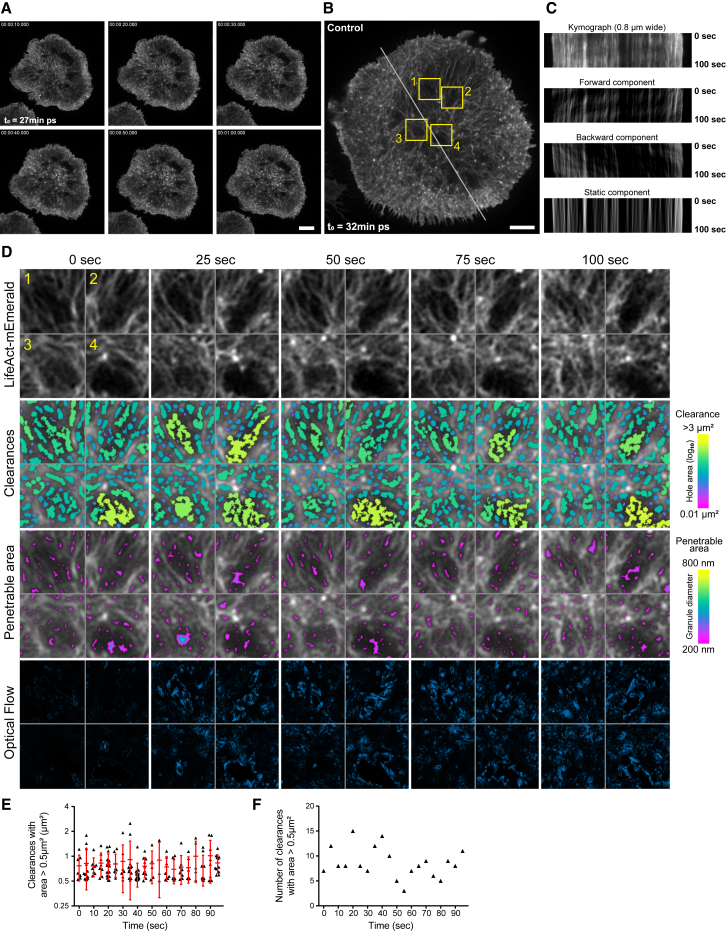
Figureu00a03
Global Actin Stability at the Mature NK IS Is Coupled to Local F-Actin Dynamism NK92.LifeAct-mEmerald cells were activated for 20u00a0min prior to initiation of imaging by TIRF-SIM microscopy at 5-s i...
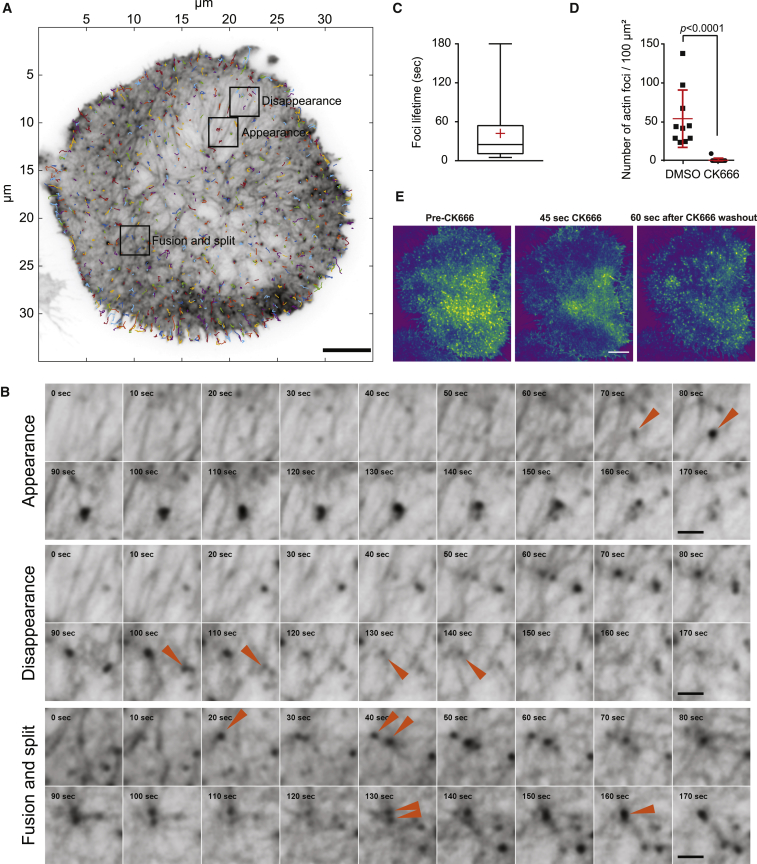
Figureu00a04
Foci Are Present at Sites of Local Actin Rearrangement (A and B) Representative NK92.LifeAct-mEmerald cell activated (A) (inverted color from Figureu00a03 B) for 20u00a0min on anti-CD18 and anti-NKp30...
Figureu00a05
Maintenance and Dynamism of Actin Clearances at the Lytic Synapse Allow Degranulation (A) F-actin (gray) and perforin (red) staining acquired by STED microscopy of NK92 cells activated on anti-CD18- a...
Figureu00a06
Actin Filament and Lytic Granule Movement Occur Independently NK92.LifeAct-mTurquoise cells were labeled with LysoTracker red prior to activation on anti-CD18- and anti-NKp30-coated glass for 20u00a0m...
Figure images are served from the NIH/NLM PubMed Central Open Access Subset or Europe PMC; copyright remains with the publishers and authors.
💬 Discussion
0 commentsNo comments yet. Be the first to start a discussion!
Leave a Comment