Abstract
The active zone (AZ) matrix of presynaptic terminals coordinates the recruitment of voltage-gated calcium channels (VGCCs) and synaptic vesicles to orchestrate neurotransmitter release. However, the spatial organization of the AZ and how it controls vesicle fusion remain poorly understood. Here, we employ super-resolution microscopy and ratiometric imaging to visualize the AZ structure on the nanoscale, revealing segregation between the AZ matrix, VGCCs, and putative release sites. Long-term blockade of neuronal activity leads to reversible AZ matrix unclustering and presynaptic actin depolymerization, allowing for enrichment of AZ machinery. Conversely, patterned optogenetic stimulation of postsynaptic neurons retrogradely enhanced AZ clustering. In individual synapses, AZ clustering was inversely correlated with local VGCC recruitment and vesicle cycling. Acute actin depolymerization led to rapid (5 min) nanoscale AZ matrix unclustering. We propose a model whereby neuronal activity modulates presynaptic function in a homeostatic manner by altering the clustering state of the AZ matrix.
🔬 Techniques
🔭 Microscopes
🧬 Organisms
✨ Fluorophores
🧪 Sample Preparation
🔬 Cell Lines
🏭 Microscope Brands
💻 Software Details
🏛️ Research Organizations (ROR)
Affiliated research institutions:
📋 Methods
Detailed experimental procedures and materials can be found in the Supplemental Information . For ratiometric imaging, coverslips with neurons were fixed, permeabilized, and labeled for immunocytochemistry using antibodies conjugated to two different fluorophores. For optogenetic stimulation, primary neuronal cultures were sparsely transfected with ChR2-YFP and stimulated for 48 hr. For quantification of synapse-specific correlation, coverslips were processed three-color immunocytochemistry, and recruitment of presynaptic machinery to the individual Bsn-positive puncta was correlated with the local R A/D values. For live imaging of presynaptic function, neurons were sparsely transfected with the vesicle cycling sensor CMV::SypHy or Ca 2+ sensor SyGCaMP6F and subjected to field stimulation while imaging. Images were analyzed using MATLAB codes (MathWorks). For correlative live-fixed imaging of presynaptic structure and function, live images of SypHy responses were aligned with the fixed ratiometric images using a MATLAB routine ( Figure S6 ). For STORM imaging, samples were fixed, permeabilized, stained for the proteins of interest, and imaged using either a commercially available N-STORM Nikon system or a custom-built setup as described before ( Winterflood et al., 2015 ). Imaging was performed in objective-type near-total internal reflection fluorescence (TIRF) mode. An image-correlation-based drift correction was employed. All data analysis was performed in ImageJ and MATLAB. Statistical analysis was carried out using GraphPad Prism 6.0. Sample distribution was assessed using D’Agostino and Pearson’s omnibus normality test; to assess the significance of differences between datasets, Mann-Whitney test was used unless noted otherwise. Error bars indicate 10–90 percentile range. ∗∗∗ p < 0.001, ∗∗ p < 0.01, ∗ p < 0.05.
Supplemental Information Document S1. Supplemental Experimental Procedures and Figures S1–S6 Document S2. Article plus Supplemental Information
📊 Figures
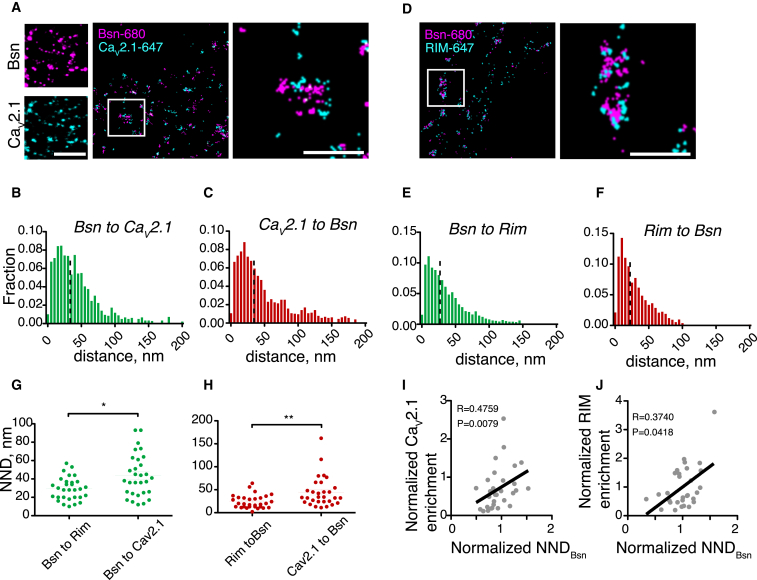
Figureu00a01
Dual-Color STORM Imaging of the AZ Structure (A) Imaging of Bsn and Ca v 2.1. Left, Ca v 2.1 and Bsn colocalize in puncta as visualized using confocal light microscopy. Scale bar, 5u00a0u03bcm. Right,...
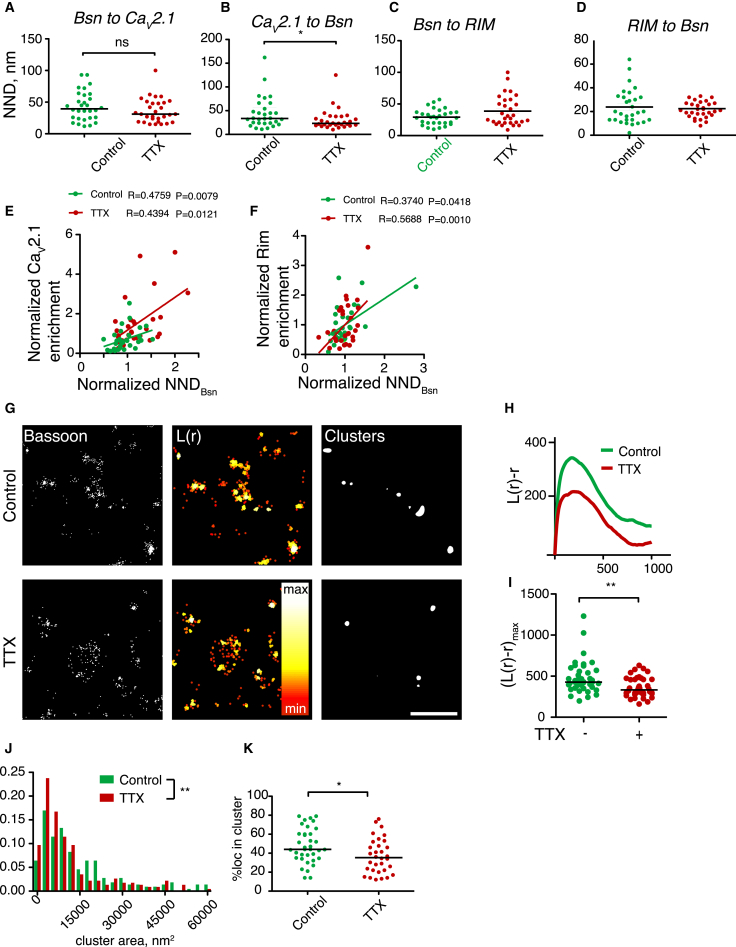
Figureu00a02
STORM Imaging Reveals the Effect of Activity Blockade on the AZ Structure (A) Bsn-to- Ca v 2.1 NND is unaffected by TTX treatment. (B) Ca v 2.1-to-Bsn NND is reduced by TTX treatment. (C) Bsn-to-RIM N...
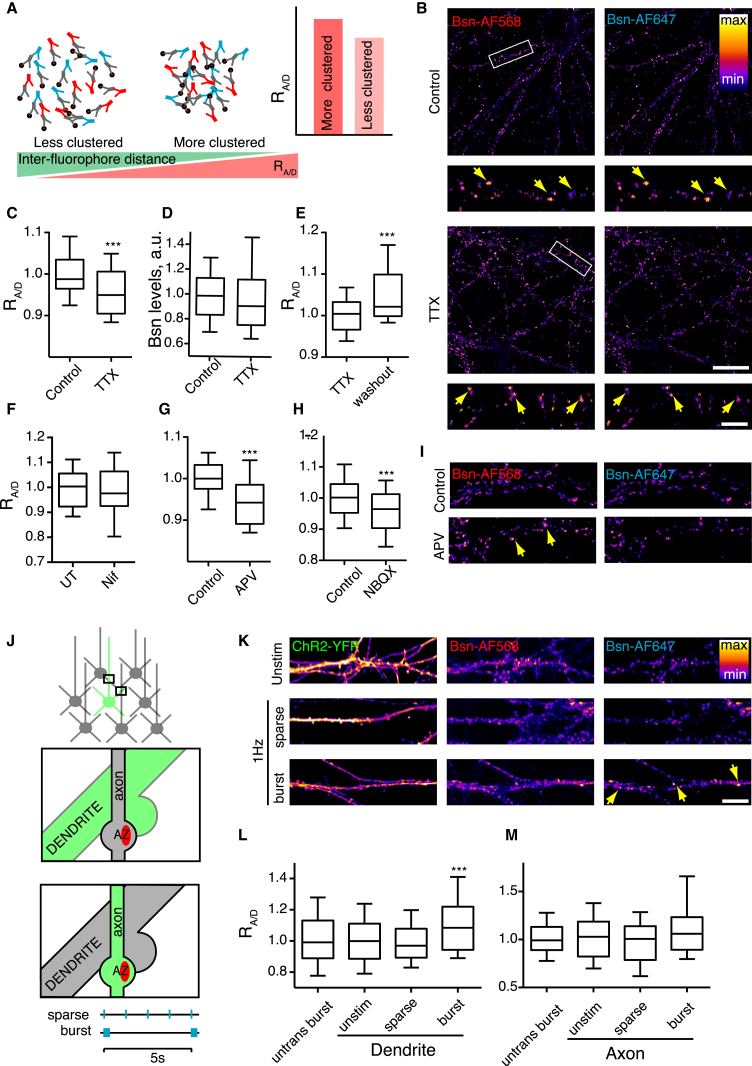
Figureu00a03
Ratiometric Imaging Reveals Activity-Dependent AZ Clustering on the Nanoscale (A) Schematic of the experimental approach; see Results and Experimental Procedures for detailed explanation. (B) Ratiomet...
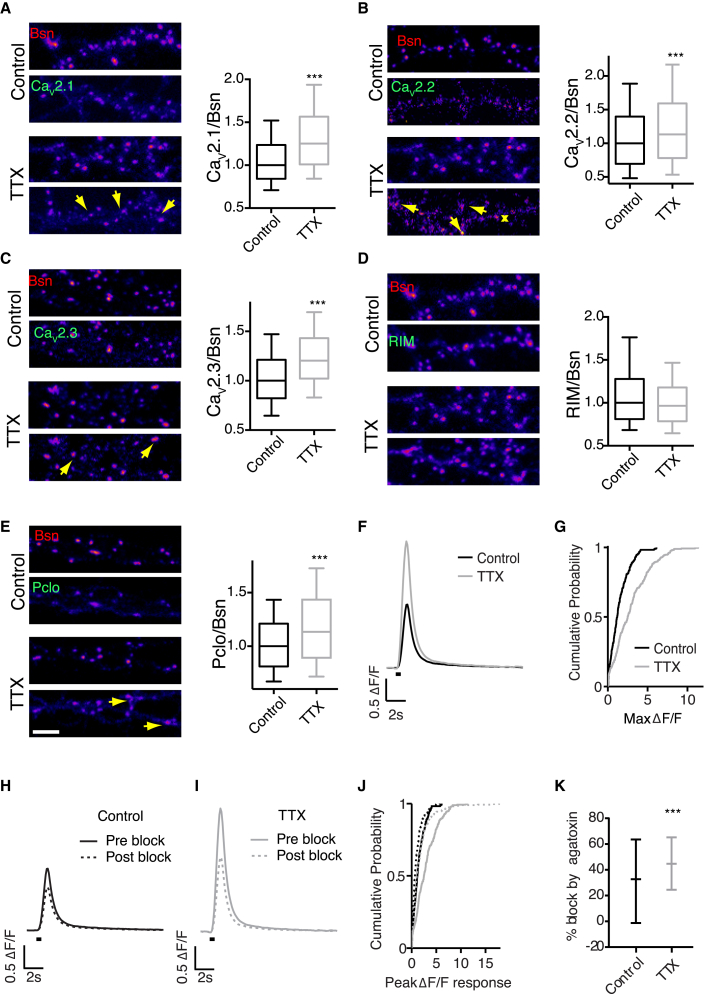
Figureu00a04
Activity Blockade Leads to Recruitment of Multiple AZ Proteins in Hippocampal Neurons and Upregulation of Presynaptic Ca 2+ Influx through P/Q-type VGCCs (A) TTX treatment (2u00a0u03bcM, 48u00a0hr) re...
Figureu00a05
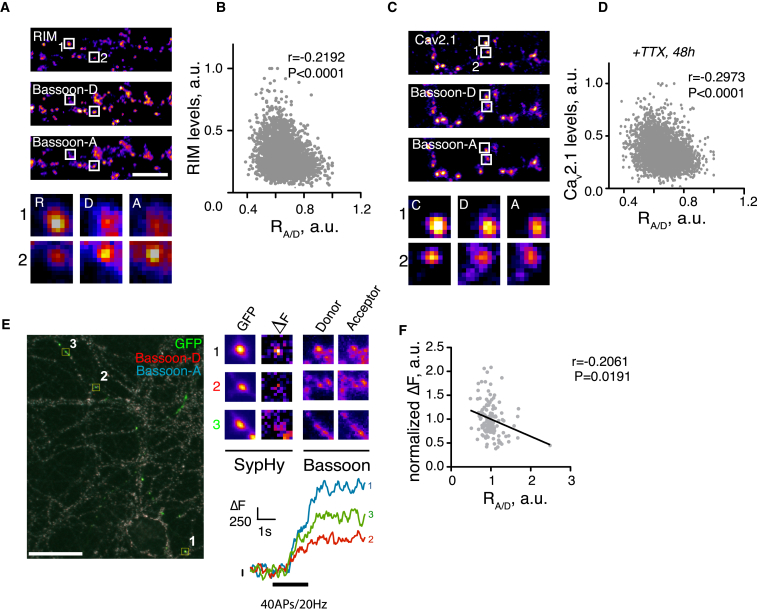
Recruitment of Presynaptic Machinery and Synaptic Vesicles Cycling Negatively Correlate with R A/D (A) Neurons were fixed and stained for RIM with AF-405 and Bsn with AF-568 and AF-647. Arrows depict ...
Figureu00a06
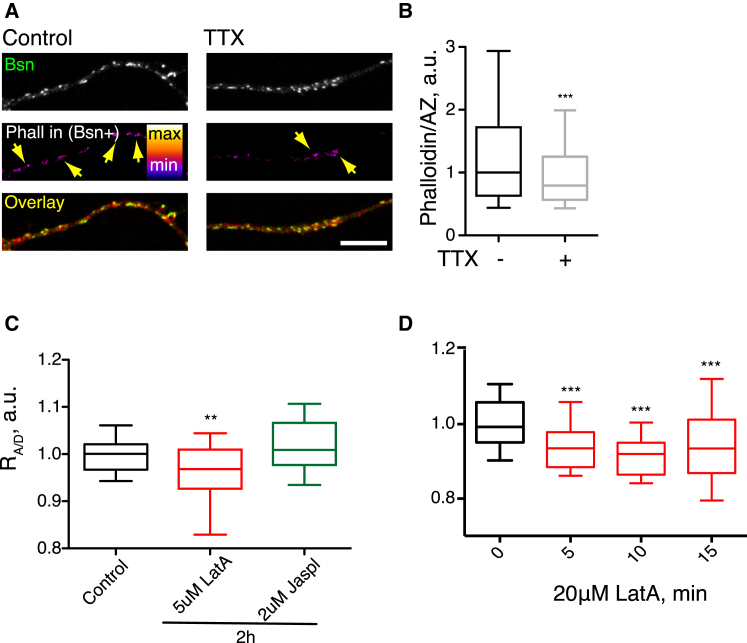
Activity-Dependent Actin Dynamics Regulate AZ Clustering (A) Synaptic F-actin levels are regulated by activity. Neurons were treated with TTX for 48u00a0hr and stained for Bsn and AF647-Phalloidin. Se...
Figureu00a07
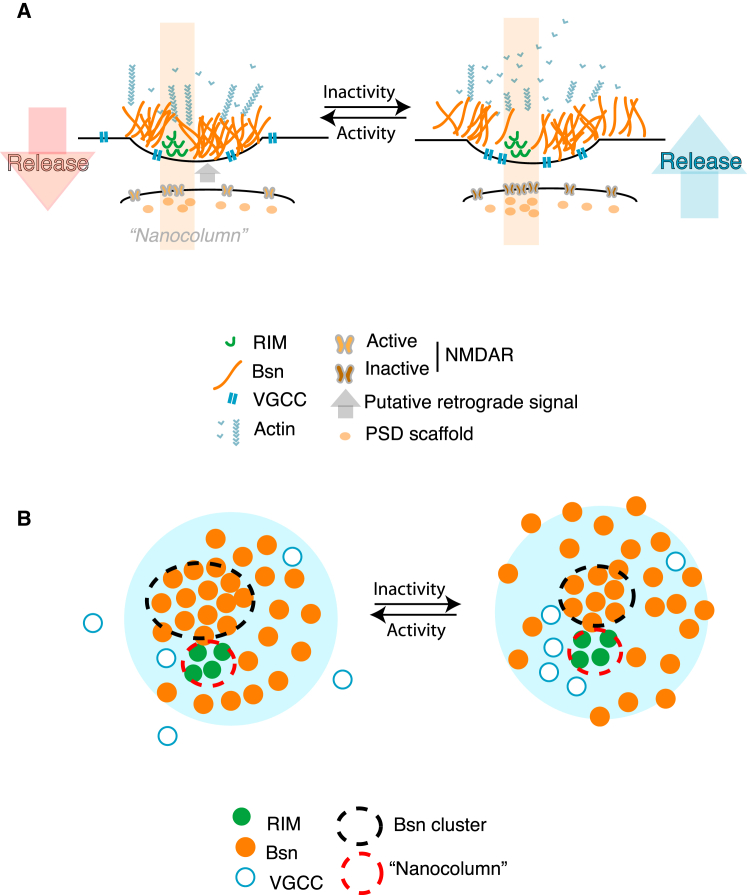
A Proposed Model for Local Integration of Postsynaptic Activity, Nanoscale Structure, and Function (A) Lateral view of the proposed synaptic organization. Left, postsynaptic NMDAR activity within the ...
Figure images are served from the NIH/NLM PubMed Central Open Access Subset or Europe PMC; copyright remains with the publishers and authors.
💬 Discussion
0 commentsNo comments yet. Be the first to start a discussion!
Leave a Comment