Abstract
AbstractImaging non-adherent cells by super-resolution far-field fluorescence microscopy is currently not possible because of their rapid movement while in suspension. Holographic optical tweezers (HOTs) enable the ability to freely control the number and position of optical traps, thus facilitating the unrestricted manipulation of cells in a volume around the focal plane. Here we show that immobilizing non-adherent cells by optical tweezers is sufficient to achieve optical resolution well below the diffraction limit using localization microscopy. Individual cells can be oriented arbitrarily but preferably either horizontally or vertically relative to the microscope’s image plane, enabling access to sample sections that are impossible to achieve with conventional sample preparation and immobilization. This opens up new opportunities to super-resolve the nanoscale organization of chromosomal DNA in individual bacterial cells.
🔬 Techniques
🧬 Organisms
✨ Fluorophores
🧪 Sample Preparation
🏭 Microscope Brands
🧪 Reagent Suppliers
📷 Detectors
🎨 Filters
💻 Software Details
🏛️ Research Organizations (ROR)
Affiliated research institutions:
📋 Methods
Super-resolution microscopy d
STORM was performed on an inverted microscope (IX-71; Olympus) using an oil-immersion objective lens (PlanApo, × 60, numerical aperture (NA) 1.45 or Apo N, × 60 NA 1.49; Olympus; Supplementary Fig. 1 ). For fluorescence excitation, 488 and 647 nm laser light emitted by an argon–krypton ion laser (Innova 70C; Coherent) was selected by an acousto-optic tunable filter (AOTFnC-VIS-TN 1001; AA Opto Electronic) and additionally filtered by a bandpass filter (FF01–390/482/563/640-25; Semrock). Using two lenses ( f =25 mm and f =120 mm), the beam was focused onto the back focal plane of the microscope objective lens. Behind the second lens, a mirror (BB02-E02; Thorlabs) was mounted on a linear translation stage to adjust the position of the beam entering the objective lens. d STORM experiments were performed in the highly inclined and laminated optical sheet mode, resulting in laser intensities of ∼5 kW cm −2 at the sample. The 647 nm laser line was used for the excitation of the fluorophore and conversion to the non-fluorescent triplet state of Alexa 647, whereas the 488 nm laser line was used for reversible photoswitching by recovery of the fluorescent singlet state. Fluorescence emission and white light images were magnified by a telescope and projected onto an EMCCD (electron-modifying charge coupled device) camera (iXon DV887DCS-BV; Andor) with a scale of 105 nm per pixel or 116 nm per pixel. For the selective suppression of excitation light and blocking of back-scattered light from the optical traps, three filters (LP02-647RU-25; Semrock, ET700/75 m; Chroma, FF01–775/SP-25; Semrock) were directly mounted to the camera. Alternatively, a white light source was used for position detection of the sample. For data acquisition, the software (Solis, Version 4.18; Andor) provided by the camera manufacturer was used. 3D-SIM was performed using a commercial OMX v4 Blaze system (GE Healthcare). The microscope was equipped with an oil-immersion objective lens (PlanApoN, × 60, NA 1.42; Olympus), a 488 nm excitation laser, a 528/48 emission filter and a scientific complementary metal-oxide-semiconductor (sCMOS) camera. Image stacks consisted of 15 images per 0.125 μm z -section, with full stack thicknesses of 1.75–3.0 μm. Holographic optical tweezers For the generation of holographic optical tweezers, a 2 W diode-pumped all-solid-state infrared laser (MIL-H-1064; CNI) emitting light at a wavelength of 1,064 nm was used ( Supplementary Fig. 1 ). The beam was expanded using a telescope (AC 254-030-B-ML, AC 254-100-B-ML; Thorlabs) before it was coupled through an objective lens (DIN 10, 10X, NA 0.25; Edmund) into a polarization-maintaining, high-power optical fibre (PMJ-A3HPM, 3S-1060-6/125-3AS-3; OZ Optics). The global infrared laser power was controlled with an adjustable neutral density (ND) filter wheel. Using either a lens (AC 508-200-B-ML; Thorlabs) in combination with an adjustable aperture for spatial filtering (not shown in the sketch) or a collimator (F810SMA-1064; Thorlabs), the infrared beam was expanded to overfill the active area of a SLM (XY Series 512 × 512; Boulder Nonlinear Systems). A 4 f -telescope consisting of two lenses (50 mm diameter, AC508-300-B-ML; Thorlabs) imaged the SLM onto the back focal plane of the microscope objective lens (PlanApo, × 60, NA 1.45; Olympus). The laser tweezers' light path was overlaid with the fluorescence excitation light path using a dichroic mirror (NFD01-1064-25x36, Semrock). To spectrally filter the excitation and trapping light from the fluorescence emission, a second dichroic mirror (FF502/670-Di01-25x36x3.0, Semrock) was used. A folding mirror inside the microscope body (not shown in the sketch) allows the imaging path to be guided through a short-pass filter (E700SP-2P; Chroma) to a CMOS camera (UI-1240SE-NIR-GL CMOS; IDS) (not shown in the sketch), which was used solely for alignment and video feedback for the software controlling the optical trap pattern, but not for super-resolution image acquisition. The camera and the SLM were connected to a computer (Intel i5–2400 3.1 GHz CPU, 4 GB RAM, Windows 7, 32-bit OS) equipped with a GPU (GeForce GTX 550Ti; Nvidia) for real-time computation of the phase pattern applied to the SLM. LabVIEW (LabVIEW 2010 SP1; National Instruments) software 26 27 was used to control the trapping experiment and to compute the phase pattern corresponding to the traps' positions either by a lens-and-prism-phase or Gerchberg–Saxton-based algorithm.
Show full methods section
Super-resolution microscopy d
STORM was performed on an inverted microscope (IX-71; Olympus) using an oil-immersion objective lens (PlanApo, × 60, numerical aperture (NA) 1.45 or Apo N, × 60 NA 1.49; Olympus; Supplementary Fig. 1 ). For fluorescence excitation, 488 and 647 nm laser light emitted by an argon–krypton ion laser (Innova 70C; Coherent) was selected by an acousto-optic tunable filter (AOTFnC-VIS-TN 1001; AA Opto Electronic) and additionally filtered by a bandpass filter (FF01–390/482/563/640-25; Semrock). Using two lenses ( f =25 mm and f =120 mm), the beam was focused onto the back focal plane of the microscope objective lens. Behind the second lens, a mirror (BB02-E02; Thorlabs) was mounted on a linear translation stage to adjust the position of the beam entering the objective lens. d STORM experiments were performed in the highly inclined and laminated optical sheet mode, resulting in laser intensities of ∼5 kW cm −2 at the sample. The 647 nm laser line was used for the excitation of the fluorophore and conversion to the non-fluorescent triplet state of Alexa 647, whereas the 488 nm laser line was used for reversible photoswitching by recovery of the fluorescent singlet state. Fluorescence emission and white light images were magnified by a telescope and projected onto an EMCCD (electron-modifying charge coupled device) camera (iXon DV887DCS-BV; Andor) with a scale of 105 nm per pixel or 116 nm per pixel. For the selective suppression of excitation light and blocking of back-scattered light from the optical traps, three filters (LP02-647RU-25; Semrock, ET700/75 m; Chroma, FF01–775/SP-25; Semrock) were directly mounted to the camera. Alternatively, a white light source was used for position detection of the sample. For data acquisition, the software (Solis, Version 4.18; Andor) provided by the camera manufacturer was used. 3D-SIM was performed using a commercial OMX v4 Blaze system (GE Healthcare). The microscope was equipped with an oil-immersion objective lens (PlanApoN, × 60, NA 1.42; Olympus), a 488 nm excitation laser, a 528/48 emission filter and a scientific complementary metal-oxide-semiconductor (sCMOS) camera. Image stacks consisted of 15 images per 0.125 μm z -section, with full stack thicknesses of 1.75–3.0 μm. Holographic optical tweezers For the generation of holographic optical tweezers, a 2 W diode-pumped all-solid-state infrared laser (MIL-H-1064; CNI) emitting light at a wavelength of 1,064 nm was used ( Supplementary Fig. 1 ). The beam was expanded using a telescope (AC 254-030-B-ML, AC 254-100-B-ML; Thorlabs) before it was coupled through an objective lens (DIN 10, 10X, NA 0.25; Edmund) into a polarization-maintaining, high-power optical fibre (PMJ-A3HPM, 3S-1060-6/125-3AS-3; OZ Optics). The global infrared laser power was controlled with an adjustable neutral density (ND) filter wheel. Using either a lens (AC 508-200-B-ML; Thorlabs) in combination with an adjustable aperture for spatial filtering (not shown in the sketch) or a collimator (F810SMA-1064; Thorlabs), the infrared beam was expanded to overfill the active area of a SLM (XY Series 512 × 512; Boulder Nonlinear Systems). A 4 f -telescope consisting of two lenses (50 mm diameter, AC508-300-B-ML; Thorlabs) imaged the SLM onto the back focal plane of the microscope objective lens (PlanApo, × 60, NA 1.45; Olympus). The laser tweezers' light path was overlaid with the fluorescence excitation light path using a dichroic mirror (NFD01-1064-25x36, Semrock). To spectrally filter the excitation and trapping light from the fluorescence emission, a second dichroic mirror (FF502/670-Di01-25x36x3.0, Semrock) was used. A folding mirror inside the microscope body (not shown in the sketch) allows the imaging path to be guided through a short-pass filter (E700SP-2P; Chroma) to a CMOS camera (UI-1240SE-NIR-GL CMOS; IDS) (not shown in the sketch), which was used solely for alignment and video feedback for the software controlling the optical trap pattern, but not for super-resolution image acquisition. The camera and the SLM were connected to a computer (Intel i5–2400 3.1 GHz CPU, 4 GB RAM, Windows 7, 32-bit OS) equipped with a GPU (GeForce GTX 550Ti; Nvidia) for real-time computation of the phase pattern applied to the SLM. LabVIEW (LabVIEW 2010 SP1; National Instruments) software 26 27 was used to control the trapping experiment and to compute the phase pattern corresponding to the traps' positions either by a lens-and-prism-phase or Gerchberg–Saxton-based algorithm.
Estimation of optical trap power
The power of the individual optical traps was controlled in two ways: The global power provided by the SLM was determined by adjusting the neutral density filter wheel and measuring the power reflected from the active SLM area. In addition, the 0th diffraction order (that is, the unmodulated part of the beam) was used as a power sink to effectively decrease the power of the holographic traps that were always created in locations different from the 0th diffraction order. To estimate the individual trap powers, we conducted a reference measurement by placing a small aperture in the focal plane behind the first lens of the 4 f -telescope, which is conjugate to the sample plane. This aperture was adjusted to block all infrared laser light from the SLM, except for one optical trap. The corresponding optical power of this single optical trap was measured by placing the sensor of a power meter at the position of the objective lens. Measurements were conducted for 45 different values of the relative sink power of the 0th diffraction order in combination with an overall number of one, two, three or four holographically created optical traps, as no more than four optical traps were simultaneously used throughout this work. From this table of 45 measured trap power values for each overall number of either one, two, three or four of the holographic optical traps, a cubic spline interpolation was used to estimate the effective single optical trap power for the sink power settings used in the according experiments.
Image acquisition
For the reconstruction of the super-resolved fluorescence images of microsphere samples obtained by d STORM, ∼1,500 to 12,000 frames were acquired at an exposure time of 29.55 ms per frame, with a detector temperature of −70 °C and an EMCCD gain setting of 200. As many measurements of the same sample were conducted in short succession, the number of frames necessary to achieve a sufficient number of localizations increased for later acquired data due to photobleaching. Hence, the acquisition time for these images ranges from ∼50–400 s. In the E. coli measurements, 8,000–66,000 frames were acquired with an exposure time of 4.64–8.24 ms, a detector temperature of −70 °C and an EMCCD gain setting of 200. Again, successive measurements of the same sample result in an increased number of frames for the second acquisition. The according acquisition times range from ∼90 s for the parallel alignment relative to the focal plane and up to 650 s for the orthogonal alignment. White light image stacks were recorded before or after d STORM data acquisition. These consist of ∼1,500–10,000 frames with a camera exposure time of 4.64–29.55 ms per frame. To achieve a higher contrast for the automated position detection used to determine the PDF, the bacteria were slightly displaced (∼700 nm) along the axial direction relative to the imaging plane by adjusting the axial position of the optical traps. The positions of the traps relative to each other were not changed and no significant changes in the movement of the bacteria were observed. d STORM image processing and analysis The open-source software rapid STORM 28 29 (Version 3.2 and Version 3.3) was used for single emitter fitting of the raw d STORM data. The output files containing the detected emitters' coordinates were used as inputs for a custom-written MATLAB programme to generate image files with adjustable pixel size and pixel values directly proportional to the number of detected single emitters by using linear interpolation. All d STORM reconstructions of E. coli cells used a pixel size of 25 nm × 25 nm, whereas all d STORM reconstructions of microspheres used a pixel size of 50 nm × 50 nm. Further analysis and processing was done either directly in MATLAB or in the open-source software Fiji 30 . The colour tables for displaying the images were chosen such that appropriate contrast was achieved and all colour bars were linearly scaled in terms of localization density, that is, localizations per pixel. In the case of E. coli bacteria attached to the coverslip ( Supplementary Fig. 4c ), custom-written MATLAB code was used for automated drift correction 31 .
Algorithmic data evaluation
To automatically measure the average FWHM of the edges of the trapped beads ( Fig. 1a ), custom-written MATLAB code was used: The centre of the bead was first determined algorithmically, followed by a transformation to polar coordinates around the centre and an averaging step over all angles. The FWHM of the edge was computed by fitting a Gaussian function to the average radial profile of the d STORM emitter localizations. A similar procedure without the fitting step was carried out to determine the radial intensity distributions for the labelled E. coli nucleoids ( Supplementary Fig. 7 ).
PDF generation and image deconvolution
To obtain the PDF of a trapped object, the position was detected in several transmitted light image frames using a custom-written MATLAB script based on a centre of mass algorithm 16 : Thresholding was applied to slightly smoothed images to create a filtering mask, which was overlaid with the raw image data. The centre of mass of the region inside the mask was computed according either to the pixel values in a normalized, background-subtracted image or a binary image to obtain the object's position. A 2D histogram was generated from all detected positions in one image stack. An elliptical, 2D Gaussian function ( Supplementary Note 1 ) was fitted to this deviation. The function was normalized and stored in an image file as PDF. The PDF pixel size was chosen to match the pixel size of the d STORM image for which it was used during the subsequent deconvolution process, which was performed using the Richardson–Lucy algorithm implementation of the ImageJ/Fiji plug-in DeconvolutionLab (see Vonesch, C., Terrés Cristofani, R. and Schmit, G. DeconvolutionLab http://bigwww.epfl.ch/algorithms/deconvolution ).
Microsphere labelling
The streptavidin-coated surface of superparamagnetic microspheres (CM01N, Bangs Laboratories) with a mean diameter of 8.18 μm was labelled with Alexa 647 bound to a single-stranded, 10 nucleobases-long DNA strand functionalized with biotin (IBA). Four microlitres of bead stock solution and 8 μl of 10 −6 M solution of the labels were added to 400 μl bi-distilled water containing 0.01% (v/v) Tween 20 and vortexed at ∼1,000 r.p.m. at room temperature for ∼30 min. Subsequently, the beads were pulled to the bottom of the reaction tube by a permanent magnet and washed three times with water containing 0.01% (v/v) Tween 20 to remove unwanted residuals. After the last washing step, the tube was filled with 170 μl of PBS with 0.15% (w/v) BSA (Sigma Aldrich). Forty microlitres were mixed with 55 μl imaging buffer (10 μl of 1 M mercaptoethylamine (Sigma-Aldrich) with 45 μl of oxygen scavenger system solution 9 ). Sixty microlitres of the final solution was applied to a sealed chamber (mostly to avoid the external induction of currents, for example, by air movement) and used for the experiments.
Labelling of chromosomal
DNA in E. coli The E. coli strain
MG1655 was inoculated from glycerol stocks and grown overnight in lysogeny broth (LB) medium (Sigma) at 32 °C, while shaking at 200 r.p.m. Working cultures were inoculated 1:200 in lysogeny broth medium from overnight. 5-Ethynyl-2′-deoxyuridine (EdU) (10 μM; Baseclick) was added for 40 min at an OD 600 of ∼0.25, to cover the time needed for one complete replication round. As up to three or four replication rounds occur concomitantly at fast growth rates (here: 27 min doubling time) 32 and chromosome replication requires ∼40 min at doubling times shorter than 60 min (ref. 33 ), 40 min of exposure to EdU are sufficient to label the entire chromosome, even if the primary replication round has already replicated most of the chromosome. After fixation with 1% formaldehyde in phosphate buffer, cells were centrifuged at 5,000 g for 5 min and washed twice in 100 mM phosphate buffer (pH 7.4). The click reaction was performed as published previously 19 . Cells were washed thrice with PBS (Sigma), centrifuged and kept as stock solution. A volume of 20 μl of 20% (v/v) of the E. coli stock solution in PBS was mixed with 55 μl of imaging buffer and 60 μl of this solution was used in a sealed chamber for the optical trapping and d STORM experiments. For 3D-SIM imaging, the E. coli stock solution was additionally labelled with 3.3 μM Sytox Green (ThermoFisher) for 5 min. This cell solution was immediately mixed with an equal volume of mounting media consisting of Vectashield H-1000 (Vector Laboratories) with 8.6 mM each of methyl viologen (Aldrich) and ascorbic acid (Fluka), before being mounted onto a slide and sealed from the external environment.
Data availability
All data and processing steps supporting the findings of this study are available within the article and its Supplementary Information files, or can be requested from the corresponding author upon request, including raw d STORM data and scripts for analysis.
Supplementary Material Supplementary Information Supplementary Figures 1-11, Notes 1-3 and References 1-18
📊 Figures
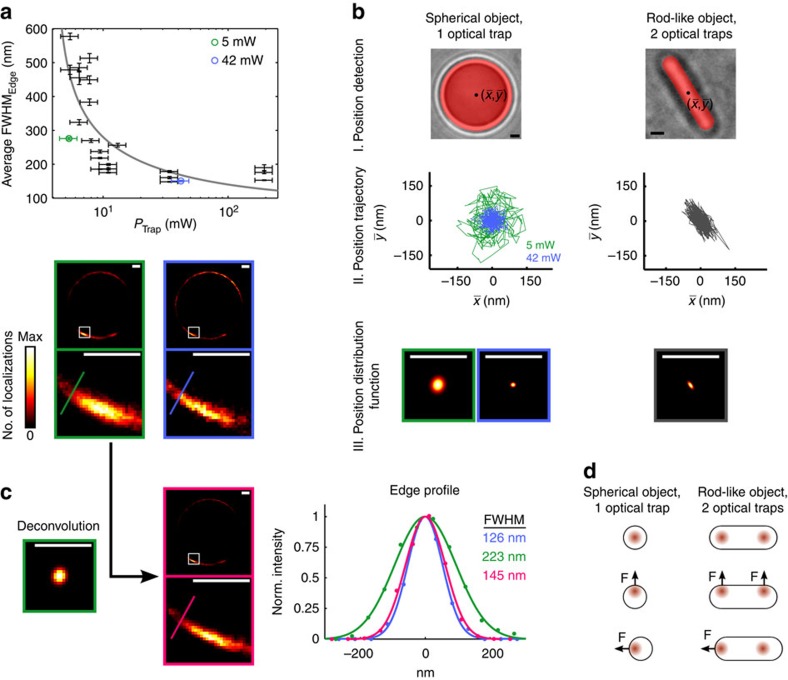
Figure 1
Response of the combined d STORM and optical tweezers setup.
( a ) Polystyrene beads (8.18u2009u03bcm mean diameter) with fluorophores attached to their surface are optically trapped by applying different trapping laser powers. The average FWHM in the d STORM r...
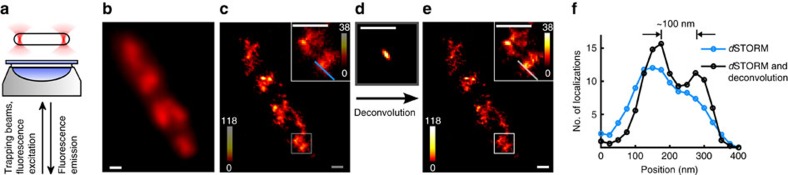
Figure 2
Super-resolution fluorescence microscopy of the chromosome of a fixed E. coli cell immobilized by two optical traps.
( a ) Schematics explaining the cell trapping by holding the bacterium using two optical tweezers at its end caps and the simultaneous super-resolution imaging experiment. ( b ) Diffraction-limited fl...
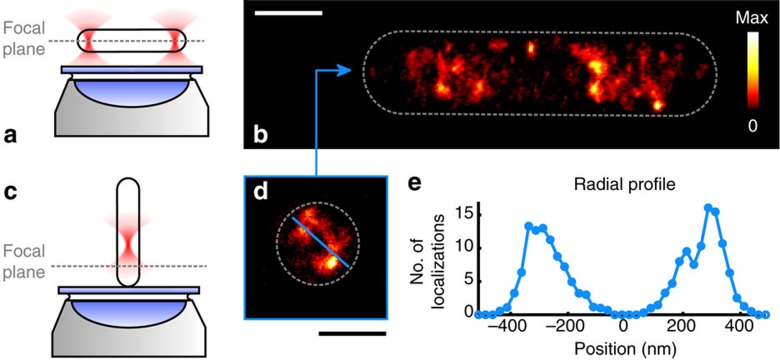
Figure 3
Holographic optical tweezers allow for super-resolution imaging of the same sample arranged in different orientations with respect to the focal plane.
( a , b ) Horizontal alignment reveals distinct structures of the labelled nucleoid DNA. ( c , d ) Vertical alignment indicates a heterogeneous distribution in the radial direction as well, with ( e )...
Figure images are served from the NIH/NLM PubMed Central Open Access Subset or Europe PMC; copyright remains with the publishers and authors.
💬 Discussion
0 commentsNo comments yet. Be the first to start a discussion!
Leave a Comment