Abstract
To understand how nuclear machineries are targeted to accurate locations during nuclear assembly, we investigated the pathway of the ribosomal RNA (rRNA) processing machinery towards ribosomal genes (nucleolar organizer regions [NORs]) at exit of mitosis. To follow in living cells two permanently transfected green fluorescence protein-tagged nucleolar proteins, fibrillarin and Nop52, from metaphase to G1, 4-D time-lapse microscopy was used. In early telophase, fibrillarin is concentrated simultaneously in prenucleolar bodies (PNBs) and NORs, whereas PNB-containing Nop52 forms later. These distinct PNBs assemble at the chromosome surface. Analysis of PNB movement does not reveal the migration of PNBs towards the nucleolus, but rather a directional flow between PNBs and between PNBs and the nucleolus, ensuring progressive delivery of proteins into nucleoli. This delivery appeared organized in morphologically distinct structures visible by electron microscopy, suggesting transfer of large complexes. We propose that the temporal order of PNB assembly and disassembly controls nucleolar delivery of these proteins, and that accumulation of processing complexes in the nucleolus is driven by pre-rRNA concentration. Initial nucleolar formation around competent NORs appears to be followed by regroupment of the NORs into a single nucleolus 1 h later to complete the nucleolar assembly. This demonstrates the formation of one functional domain by cooperative interactions between different chromosome territories.
🔬 Techniques
💻 Software
✨ Fluorophores
🧪 Sample Preparation
🔬 Cell Lines
🏭 Microscope Brands
🧪 Reagent Suppliers
📷 Detectors
💻 Software Details
🏛️ Research Organizations (ROR)
Affiliated research institutions:
📋 Methods
Plasmids
The cDNA corresponding to Nop52 was excised from a plasmid described previously ( Savino et al. 1999 ). The EcoRI sites at both termini were used for in frame subcloning of Nop52 into the pEGFP-C2 EcoRI sites (CLONTECH Laboratories, Inc.); pEGFP-C2 contains an enhanced GFP mutant under the control of the cytomegalovirus (CMV) promoter and a G-418 resistance gene. The full-length fibrillarin cDNA, a gift from J.P. Aris (Department of Anatomy and Cell Biology, University of Florida, Gainesville, FL) ( Aris and Blobel 1991 ) was excised from pBluescript; it was inserted in frame in the PstI and ApaI sites of pEGFP-C2. Cell Culture and Obtention of Stable Transfected Cell Lines HeLa cells were cultured in Eagle's minimum essential medium (Sigma-Aldrich) supplemented with 10% FCS and 2 mM l -glutamine (GIBCO BRL). HeLa cells were transfected at 60% confluence using the Superfect reagent (QIAGEN) following the manufacturer's instructions. Selection of stable transfected cells was carried out by treatment with G-418 sulfate (800 μg/ml; Life Technologies). After 15 d under the selection pressure, drug-resistant cells were sorted by flow cytometry according to expression levels. For Nop52-GFP, only one cell was plated per well. A clone that presented a normal cell cycle and high expression levels was used. For fibrillarin-GFP, a stable cell line was also obtained by successive sorting by flow cytometry.
Antibodies
Antibodies with the following specificities were used: a mouse monoclonal anti-fibrillarin, 72B9 ( Reimer et al. 1987 ), a human serum C13 containing specific autoantibodies against Nop52 ( Savino et al. 1999 ), a human serum against upstream binding factor (UBF; A17) ( Roussel et al. 1993 ), and mouse monoclonal antibodies against GFP (Roche). A human serum against fibrillarin, GM4, was used for Western blotting ( Fomproix et al. 1998 ). Anti–mouse secondary antibodies, conjugated to FITC or to Cy3, anti–human antibodies conjugated to Cy5, and goat antibodies conjugated to Texas Red were purchased from Jackson ImmunoResearch Laboratories. For Western blotting, peroxidase-conjugated goat anti–human and anti–mouse antibodies (Jackson ImmunoResearch Laboratories) were used.
Show full methods section
Plasmids
The cDNA corresponding to Nop52 was excised from a plasmid described previously ( Savino et al. 1999 ). The EcoRI sites at both termini were used for in frame subcloning of Nop52 into the pEGFP-C2 EcoRI sites (CLONTECH Laboratories, Inc.); pEGFP-C2 contains an enhanced GFP mutant under the control of the cytomegalovirus (CMV) promoter and a G-418 resistance gene. The full-length fibrillarin cDNA, a gift from J.P. Aris (Department of Anatomy and Cell Biology, University of Florida, Gainesville, FL) ( Aris and Blobel 1991 ) was excised from pBluescript; it was inserted in frame in the PstI and ApaI sites of pEGFP-C2. Cell Culture and Obtention of Stable Transfected Cell Lines HeLa cells were cultured in Eagle's minimum essential medium (Sigma-Aldrich) supplemented with 10% FCS and 2 mM l -glutamine (GIBCO BRL). HeLa cells were transfected at 60% confluence using the Superfect reagent (QIAGEN) following the manufacturer's instructions. Selection of stable transfected cells was carried out by treatment with G-418 sulfate (800 μg/ml; Life Technologies). After 15 d under the selection pressure, drug-resistant cells were sorted by flow cytometry according to expression levels. For Nop52-GFP, only one cell was plated per well. A clone that presented a normal cell cycle and high expression levels was used. For fibrillarin-GFP, a stable cell line was also obtained by successive sorting by flow cytometry.
Antibodies
Antibodies with the following specificities were used: a mouse monoclonal anti-fibrillarin, 72B9 ( Reimer et al. 1987 ), a human serum C13 containing specific autoantibodies against Nop52 ( Savino et al. 1999 ), a human serum against upstream binding factor (UBF; A17) ( Roussel et al. 1993 ), and mouse monoclonal antibodies against GFP (Roche). A human serum against fibrillarin, GM4, was used for Western blotting ( Fomproix et al. 1998 ). Anti–mouse secondary antibodies, conjugated to FITC or to Cy3, anti–human antibodies conjugated to Cy5, and goat antibodies conjugated to Texas Red were purchased from Jackson ImmunoResearch Laboratories. For Western blotting, peroxidase-conjugated goat anti–human and anti–mouse antibodies (Jackson ImmunoResearch Laboratories) were used.
Immunofluorescence
For immunofluorescence, cells were grown as monolayers on glass coverslips, fixed in 2% (wt/vol) paraformaldehyde for 20 min at room temperature, and permeabilized with 0.5% Triton X-100 for 5 min. Cells were incubated at room temperature for 60 min in PBS with the first antibody and then for 60 min with the secondary antibody. Samples were stained with the DNA-specific 4′,6-diamino-2-phenylindole (DAPI; Sigma-Aldrich) dye. All preparations were mounted with the antifading solution Citifluor (CITIFLUOR, Ltd.). Assay of RNA Pol I Activity In Situ (Run On) The run on assay was performed on HeLa cells grown as monolayers, essentially as described ( Roussel et al. 1996 ) in conditions set up to reveal RNA pol I transcription ( Moore and Ringertz 1973 ). BrUTP incorporation was detected by immunofluorescence labeling using a mouse anti-bromodeoxyuridine monoclonal antibody (Roche) revealed by FITC-conjugated goat anti–mouse antibodies (Jackson ImmunoResearch Laboratories).
Immunoblotting
For protein analysis, control HeLa cells, fibrillarin-GFP, and Nop52-GFP transfected HeLa cell lines were solubilized in SDS sample buffer and analyzed by 10% SDS-PAGE. Immunoblotting was as described ( Savino et al. 1999 ). Detection of immunoreactive bands was performed by chemiluminescence using peroxidase-conjugated antibodies and the supersignal kit (Pierce Chemical Co.) as enhancer, following the manufacturer's instructions. Membranes were exposed to a Fuji X-ray film (Fuji Photo Film Co. Ltd.). The membranes were dehybridized by incubation in 62.5 mM Tris-HCl, 100 mM β-mercaptoethanol, and 2% SDS for 30 min at 60°C, and then washed with PBS for subsequent immunoblotting.
Microscopy 3-D and 4-D Acquisition System
Pictures of fixed cells were collected using a 3-D deconvolution imaging system, whose detailed description and validation will be published elsewhere (Sibarita and De Mey, in preparation). In brief, it consisted of a Leica DM RXA microscope, equipped with a piezoelectric translator (PIFOC; PI) placed at the base of a 100× PlanApo N.A. 1.4 objective, and a 5 MHz Micromax 1300Y interline CCD camera (Roper Instruments). For the acquisition of Z-series, the streaming mode allows the camera to operate at full speed by controlling the piezo translator during the chip readout. Stacks of conventional fluorescence images were collected automatically at 0.2 μm Z-distance (Metamorph software; Universal Imaging Corp.). Wavelength selection was achieved by switching to the corresponding motorized selective Leica filter block before each stack acquisition. Exposure times were adjusted to provide circa 3000 grey levels at sites of strong labeling. Automated batch deconvolution of each Z-series was computed using a measured point spread function (PSF) with a custom-made software package (J.B. Sibarita, Institut Curie/Section de Recherche). The PSF of the optical system was extracted from 3-D images of fluorescent beads of 0.1 μm of diameter (Molecular Probes) collected at each wavelength. The high signal to noise ratio (SNR) of the data sets lead us to use iterative constrained deconvolution algorithms ( Meinel 1986 ), commonly used in the field of microscopy ( Agard et al. 1989 ). They are issued from the classical imaging equation: i = o ⊗ h + n , where i , o , h and n represent, respectively, the acquisition, the object one wishes to compute, the PSF, and the noise. In this class of algorithm the noise is neglected. The classical imaging equation can then be simplified and extended to its iterative form, from which various algorithms can be derived. We have chosen to use the multiplicative correction algorithm, described in its discrete formulation below, because of its rapid convergence, well suited for large data sets: documentclass[10pt]{article} usepackage{amsmath} usepackage{wasysym} usepackage{amsfonts} usepackage{amssymb} usepackage{amsbsy} usepackage{mathrsfs} usepackage{pmc} usepackage[Euler]{upgreek} pagestyle{empty}
oddsidemargin -1.0in
begin{document} begin{equation*}o_{m}^{ left left(k+1right) right }=Ko_{m}^{ left left(kright) right }frac{i_{m}}{{{sum_{l}}}h_{m-l}o_{l}^{ left left(kright) right }}{mathrm{,}}end{equation*}end{document} with o o = i , and where o ( k + 1) and o ( k ) are, respectively, the new and the previous estimates. To control the noise and avoid artefacts during the iterative process, we apply a gaussian filtering to the first estimate and every 5 to 7 iterations, depending on the noise level. Typically, deconvolution of a stack 400 × 400 × 50 takes 90 s per color on a Pentium III-866 MHz. Live cell 4-D microscopy was carried out using a novel imaging system, also capable of performing fast 5-D imaging (3-D plus 2 fluorophores plus time), whose detailed description and validation will be published elsewhere (De Mey and Sibarita, in preparation). In brief, it uses a bottom port Leica DM IRBE microscope. A piezoelectric translator controlled by a 5 MHz Micromax 872Y interline CCD camera (Princeton Instruments) assures rapid and reproducible Z-stepping in stream mode. Shuttering and illumination was assured by a 175 W Xenon lamp housed in a Sutter DG4 illuminator linked to the microscope by an optical fiber. For GFP imaging, a Leica GFP filter block was used. Stacks of images with a Z-step of 0.3 μm were acquired with a 100× PlanApo N.A. 1.4 oil immersion objective in stream mode (Metamorph) using the camera set at 2 × 2 binning. Each stack of 10 to 50 images was acquired in 1 to a few seconds with a frequency ranging from every 5 s to every 2.5 min. The number of images per stack was based on the exposure time in order to obtain entire stacks in
📊 Figures
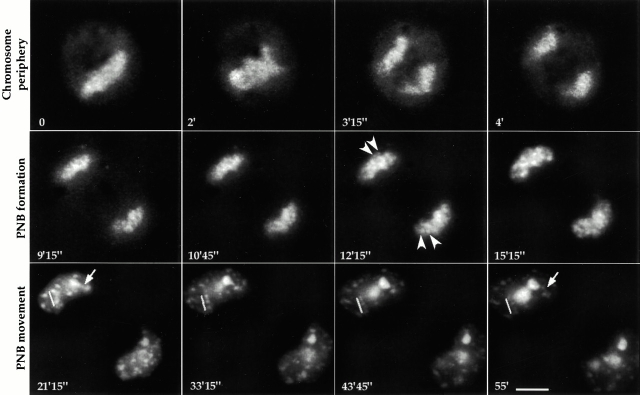
Figure 2
Time-lapse sequence of Nop52-GFP, from mitosis to early G1 phase. Projection of 15 focal planes. Nop52-GFP is found at the periphery of the chromosomes during metaphase (time 0). It follows chromosome...
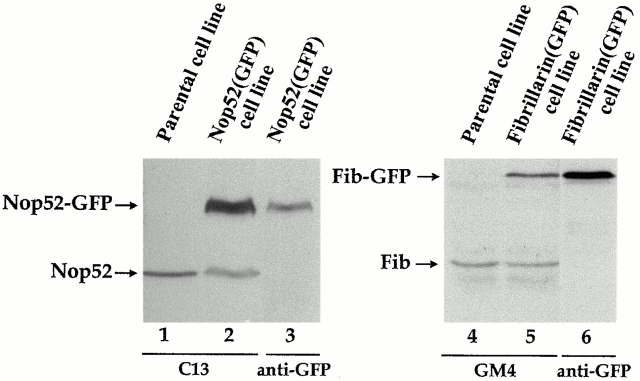
Figure 1
SDS-Page analysis of whole cell lysates of stably transfected and nontransfected HeLa cells. The same number of nontransfected parental cells and Nop52-GFP transfected cells were probed with C13. In l...
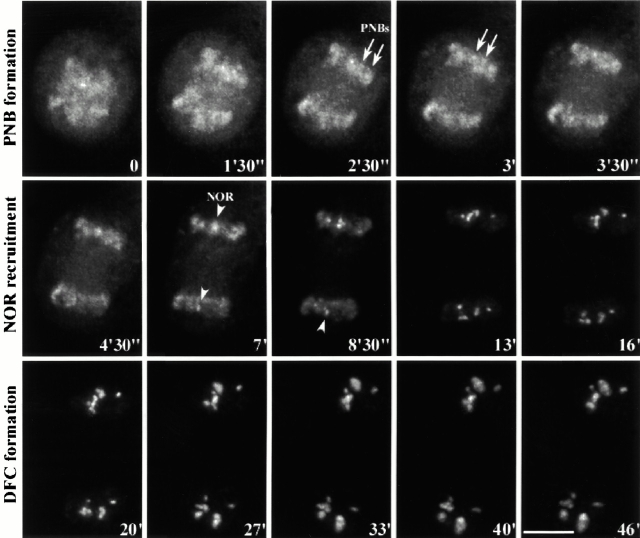
Figure 3
Time-lapse sequence of fibrillarin-GFP, from mitosis to early G1 phase. Projection of 33 focal planes. At 2u203230u2033, fibrillarin starts to assemble in PNBs (arrows). NORs become very distinct at 7...
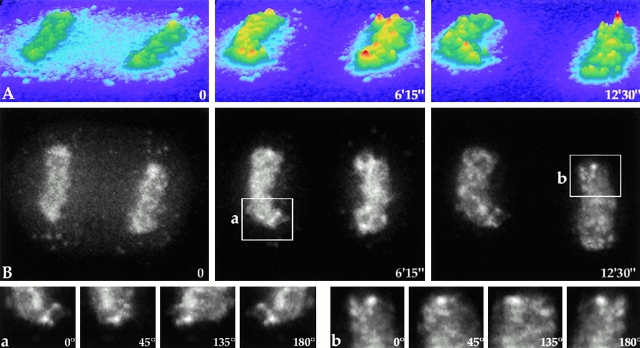
Figure 4
Localization of Nop52 during telophase in time-lapse sequences. Projection of 25 focal planes. Three key steps can be observed, the periphery of the chromosomes (time 0), PNB formation (6u203215u2033)...
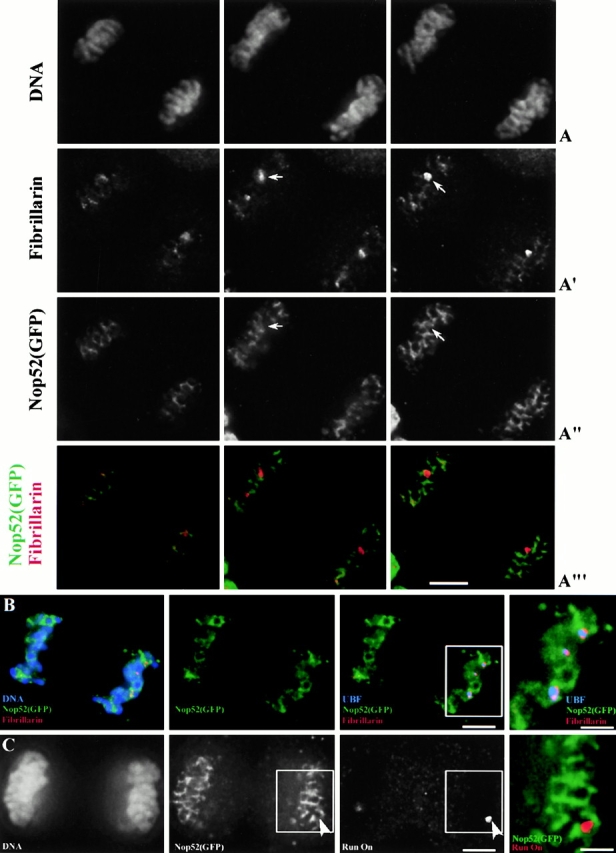
Figure 5
Relative distribution of Nop52 and fibrillarin in fixed cells in telophase. (Au2013Au2032u2032u2032) 55 focal planes of 0.2 u03bcm of a fixed cell were recorded. Three focal planes are shown, the cond...
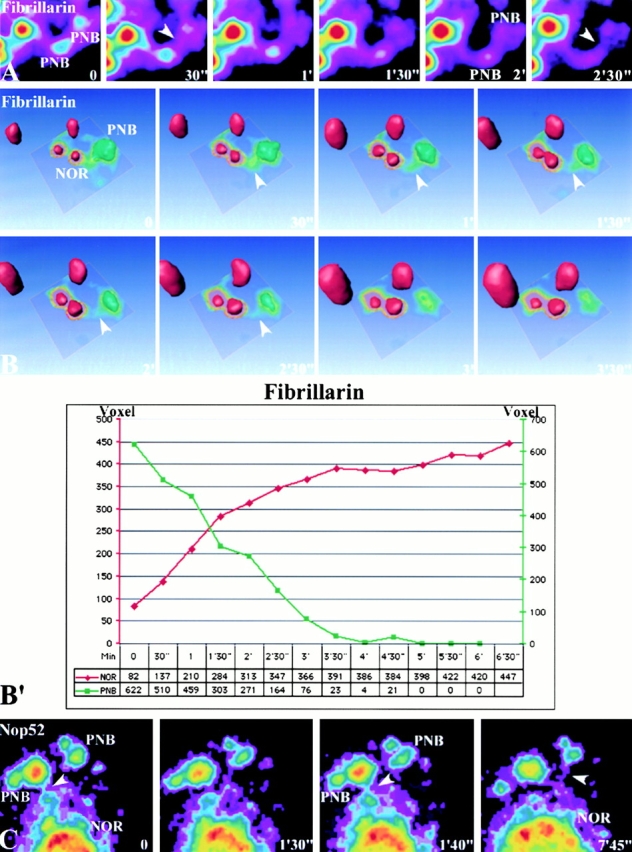
Figure 6
Protein delivery from PNBs to NORs/nucleoli and between PNBs. The delivery of material from PNBs to NORs is performed by flow (arrowheads); these flows do not last more than 2 min. This was observed f...
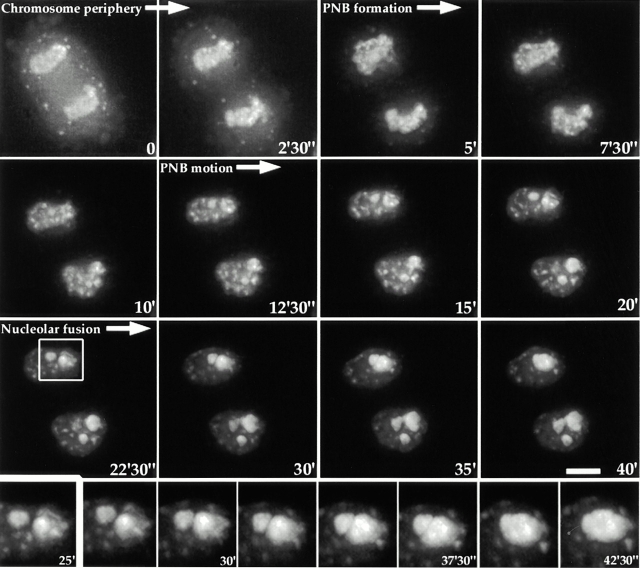
Figure 9
From telophase to an interphasic nucleolus. Time lapse sequence, with a 2.5-min frequency, shows the dynamics of Nop52 from the periphery of the chromosome, to PNB formation, and assembly in NORs foll...
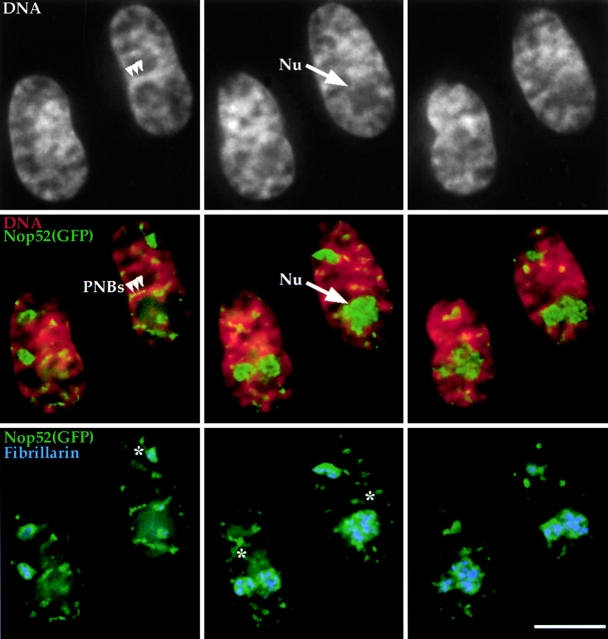
Figure 7
Distribution of Nop52 in fixed cells compared with DNA condensation and fibrillarin in G1 cells. Three different planes are shown. G1 cells still show some chromosome condensation as observed by DNA s...
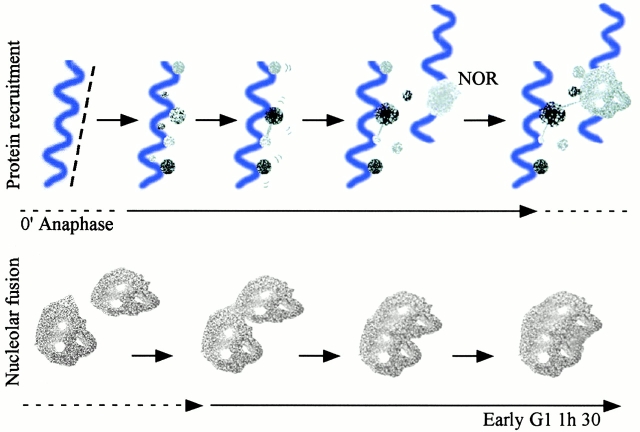
Figure 10
Schematic reconstruction of the nucleolus. Proteins at the periphery of chromosomes (dashed line) assemble in PNBs attached to condensed chromatin (blue), and movements on the spot of these PNBs are o...
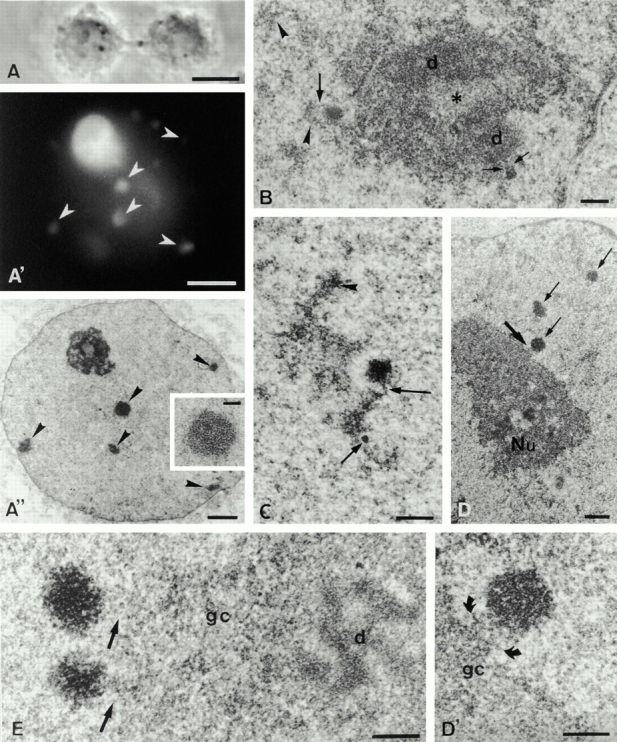
Figure 8
Structure of PNBs and modifications at the proximity of the nucleolus. Two early G1 Nop52-GFP HeLa cells are seen in phase contrast (A). Bar, 8 u03bcm. The lefthand daughter cell is observed by fluore...
Figure images are served from the NIH/NLM PubMed Central Open Access Subset or Europe PMC; copyright remains with the publishers and authors.
💬 Discussion
0 commentsNo comments yet. Be the first to start a discussion!
Leave a Comment