Abstract
We report a novel mechanism of action of ONC201 as a mitochondria-targeting drug in cancer cells. ONC201 was originally identified as a small molecule that induces transcription of TNF-related apoptosis-inducing ligand (TRAIL) and subsequently kills cancer cells by activating TRAIL death receptors. In this study, we examined ONC201 toxicity on multiple human breast and endometrial cancer cell lines. ONC201 attenuated cell viability in all cancer cell lines tested. Unexpectedly, ONC201 toxicity was not dependent on either TRAIL receptors nor caspases. Time-lapse live cell imaging revealed that ONC201 induces cell membrane ballooning followed by rupture, distinct from the morphology of cells undergoing apoptosis. Further investigation found that ONC201 induces phosphorylation of AMP-dependent kinase and ATP loss. Cytotoxicity and ATP depletion were significantly enhanced in the absence of glucose, suggesting that ONC201 targets mitochondrial respiration. Further analysis indicated that ONC201 indirectly inhibits mitochondrial respiration. Confocal and electron microscopic analysis demonstrated that ONC201 triggers mitochondrial structural damage and functional impairment. Moreover, ONC201 decreased mitochondrial DNA (mtDNA). RNAseq analysis revealed that ONC201 suppresses expression of multiple mtDNA-encoded genes and nuclear-encoded mitochondrial genes involved in oxidative phosphorylation and other mitochondrial functions. Importantly, fumarate hydratase deficient cancer cells and multiple cancer cell lines with reduced amounts of mtDNA were resistant to ONC201. These results indicate that cells not dependent on mitochondrial respiration are ONC201-resistant. Our data demonstrate that ONC201 kills cancer cells by disrupting mitochondrial function and further suggests that cancer cells that are dependent on glycolysis will be resistant to ONC201.
🔬 Techniques
💻 Software
✨ Fluorophores
🧪 Sample Preparation
🔬 Cell Lines
🏭 Microscope Brands
🧪 Reagent Suppliers
💻 Software Details
🏛️ Research Organizations (ROR)
Affiliated research institutions:
📋 Methods
Reagents
ONC201 was generously provided by Oncoceutics, Inc. Philadelphia, PA. ONC201 was dissolved with DMSO at 20mM and stored at −30°C. Recombinant GST-TRAIL protein was prepared in the lab as previously reported [ 63 ] and stored at −80°C in aliquots until used.The tetra-peptide pan-caspase inhibitor Z-VAD-FMK (cat#2163), necroptosis inhibitor necrostatin-1 (NEC1, cat#2324), necrosulfonamide (NSA, cat#5025), tunicamycin (cat#3516) were obtained from TOCRIS (Bristol, UK). Oligomycin (cat#O4876; stock 10mM in DMSO), metformin-hydrochloride (cat#PHR1084: stock 1M in PBS), rotenone (cat#R8875; stock 2mM in DMSO), and D-(+) galactose (cat#G5388), SP600125 (cat#S5567), ethidium bromide (EtBr, cat#E1510), Mdivi-1 (cat#M0199), and uridine (cat# U3003) were from Sigma-Aldrich (St. Louis, MO, USA). D-(+) glucose (cat#4912) was from Thomas Scientific (Swedesboro, NJ, USA). Doxorubicin (cat#S1208) was from Selleck Chemicals (Houston, TX, USA).
Cell culture
All human breast cancer cell lines (T47D, MCF7, HCC1500, ZR75-1, BT474, SKBR3, HCC1954, AU565, HCC1937, MDA-MB468, HCC1187, BT20, MDA-MB231, Hs578T, MDA-MB436, HCC38, BT549) were grown in RPMI1640 supplemented with 10 % fetal bovine serum (FBS) and 100 units/ml of penicillin, 100 microgram/ml of streptomycin (P/S) at 37°C, 5 % CO 2 incubator. Endometrial cancer cells ARK-1, ARK-2 were obtained from Dr. Alessandro Santin (Yale University), NCI-EC1 was from Dr. John Risinger (Michigan State University) and CRL1622 was obtained from ATCC (Manassas, VA). ARK-1 and ARK-2 (serous) were grown in RPMI1640 supplemented with 10% FBS and 1% P/S. NCI-EC1, CRL1622 (endometrioid) were grown in DMEM/F12 medium supplemented with 10% FBS and 1% P/S. Cell authenticity of each breast cancer and endometrial cell line was confirmed by Power Plex 16 (Laragen Inc., Culver City, CA, USA). Primary human foreskin fibroblast (HFF) cells [ 64 ] were kindly provided by Dr. Kenneth Yamada (National Institute of Dental and Craniofacial Research, NIH) and were maintained in DMEM supplemented with 10 % FBS and 1% P/S at 37°C, 10 % CO 2 incubator. HCT116 was also maintained in DMEM supplemented with 10 % FBS and 1% P/S at 37°C, 10 % CO 2 incubator. Glioblastoma stem cell line (GSC) was kindly provided by Dr. Deric Park (Neuro-Oncology Branch, NCI), and maintained in DMEM/F12 supplemented with B-27™ (final 1x, cat# 12587010, ThermoFisher), Epidermal Growth Factor (20ng/ml), Fibroblast Growth Factor (20ng/ml). UOK121 (renal cell carcinoma) and UOK262 fumarate hydratase ( FH ) deficient cells (hereditary leiomyomatosis renal cell carcinoma) [ 47 ] were maintained in rho0 medium (see Generation of rho0 cells section below). Cell authenticity of renal cancer cell lines were verified by Genetica Cell Line Testing, a LabCorp brand (Burlington, NC, USA).
Show full methods section
Reagents
ONC201 was generously provided by Oncoceutics, Inc. Philadelphia, PA. ONC201 was dissolved with DMSO at 20mM and stored at −30°C. Recombinant GST-TRAIL protein was prepared in the lab as previously reported [ 63 ] and stored at −80°C in aliquots until used.The tetra-peptide pan-caspase inhibitor Z-VAD-FMK (cat#2163), necroptosis inhibitor necrostatin-1 (NEC1, cat#2324), necrosulfonamide (NSA, cat#5025), tunicamycin (cat#3516) were obtained from TOCRIS (Bristol, UK). Oligomycin (cat#O4876; stock 10mM in DMSO), metformin-hydrochloride (cat#PHR1084: stock 1M in PBS), rotenone (cat#R8875; stock 2mM in DMSO), and D-(+) galactose (cat#G5388), SP600125 (cat#S5567), ethidium bromide (EtBr, cat#E1510), Mdivi-1 (cat#M0199), and uridine (cat# U3003) were from Sigma-Aldrich (St. Louis, MO, USA). D-(+) glucose (cat#4912) was from Thomas Scientific (Swedesboro, NJ, USA). Doxorubicin (cat#S1208) was from Selleck Chemicals (Houston, TX, USA).
Cell culture
All human breast cancer cell lines (T47D, MCF7, HCC1500, ZR75-1, BT474, SKBR3, HCC1954, AU565, HCC1937, MDA-MB468, HCC1187, BT20, MDA-MB231, Hs578T, MDA-MB436, HCC38, BT549) were grown in RPMI1640 supplemented with 10 % fetal bovine serum (FBS) and 100 units/ml of penicillin, 100 microgram/ml of streptomycin (P/S) at 37°C, 5 % CO 2 incubator. Endometrial cancer cells ARK-1, ARK-2 were obtained from Dr. Alessandro Santin (Yale University), NCI-EC1 was from Dr. John Risinger (Michigan State University) and CRL1622 was obtained from ATCC (Manassas, VA). ARK-1 and ARK-2 (serous) were grown in RPMI1640 supplemented with 10% FBS and 1% P/S. NCI-EC1, CRL1622 (endometrioid) were grown in DMEM/F12 medium supplemented with 10% FBS and 1% P/S. Cell authenticity of each breast cancer and endometrial cell line was confirmed by Power Plex 16 (Laragen Inc., Culver City, CA, USA). Primary human foreskin fibroblast (HFF) cells [ 64 ] were kindly provided by Dr. Kenneth Yamada (National Institute of Dental and Craniofacial Research, NIH) and were maintained in DMEM supplemented with 10 % FBS and 1% P/S at 37°C, 10 % CO 2 incubator. HCT116 was also maintained in DMEM supplemented with 10 % FBS and 1% P/S at 37°C, 10 % CO 2 incubator. Glioblastoma stem cell line (GSC) was kindly provided by Dr. Deric Park (Neuro-Oncology Branch, NCI), and maintained in DMEM/F12 supplemented with B-27™ (final 1x, cat# 12587010, ThermoFisher), Epidermal Growth Factor (20ng/ml), Fibroblast Growth Factor (20ng/ml). UOK121 (renal cell carcinoma) and UOK262 fumarate hydratase ( FH ) deficient cells (hereditary leiomyomatosis renal cell carcinoma) [ 47 ] were maintained in rho0 medium (see Generation of rho0 cells section below). Cell authenticity of renal cancer cell lines were verified by Genetica Cell Line Testing, a LabCorp brand (Burlington, NC, USA).
Cell viability assay
(MTS assay) Cells were seeded at 5,000 cells/well in a 96 well plate on the day before treatment. ONC201 or GST-TRAIL-mediated cytotoxicity was assessed using the Cell Titer 96® AQueous One Solution Cell Proliferation Assay (cat#G3581, Promega, Madison, WI, USA) as previously described [ 65 ]. All MTS measurements were done in 3 replicates and each experiment was carried out at least 3 times. Results were given as the mean +/− the standard error of the mean (SEM) for at least 3 independent experiments. When Z-VAD-FMK was used, cells were pretreated with Z-VAD-FMK (10 μM) for 30 minutes prior to any treatments. Control cells were incubated with DMSO at the same concentration as in the Z-VAD-FMK-treated cells. Cell viability was analyzed by the MTS assay after 5 days of incubation with ONC201 or GST-TRAIL.
CytoTox-Glo TM cytotoxicity assay
Cells were seeded at 5,000 cells/well in a white 96 well plate (cat#07-200-566, Fisher Scientific, Hampton, NH, USA) on the day before treatment. ONC201 or GST-TRAIL-mediated cytotoxicity was also assessed by CytoTox-Glo™ Cytotoxicity Assay (cat#G9290, Promega, Madison, WI, USA). All measurements were done in 3 replicates and each experiment was carried out at least 3 times. Results were given as the mean +/− SEM for at least 3 independent experiments. Cell viability was analyzed after 5 days of incubation with ONC201 or GST-TRAIL. siRNA transfection Cells were reverse-transfected with siRNA with Lipofectamine® RNAiMax (cat#13778150, ThermoFisher Scientific, Waltham, MA, USA), as recommended by the manufacturer's protocol. Briefly, for each siRNA (22.5μl of 20μM stock), RNAiMax (22.5μl) and Opti-MEM (4450 μl) were added and incubated for 20 minutes at room temperature (RT) (Mix1 4.5ml total). Cell suspensions were prepared at 10 5 cells/ml (Mix2). Mix1 and Mix2 were then combined with equal volume (4.5 ml + 4.5 ml), incubated for 5 minutes at RT, and plated 100 μl/well in 96 well plate for cell viability assay. Volume was changed as needed with the same ratio of each component (e.g. siRNA, RNAiMax reagent, OPTI-MEM, cells) of RNAi transfection mix. The remaining transfection mixture was plated in 6 well plates for protein analysis. Final concentration of siRNA was 50 nM. When two siRNA were combined, final concentration of siRNA was 25 nM each. For DR4/5 siRNA experiments, ONC201 or GST-TRAIL was added to the 96 well plates at 48 h post-transfection and MTS reagent was added at 5 days post-transfection for viability measurements. Cells plated in the 6 well plates were harvested for protein analysis at 7 days post-transfection. For Tfam siRNA experiments, cell viability, and ATP assays were performed 3 days post-transfection, and cells in 6 well plates were harvested for protein analysis at 3 days post-transfection. siNeg (AllStars Negative Control siRNA, cat#SI03650318), siDR4 (Hs_TNFRSF10A_1 FlexiTube siRNA, cat# SI00056728), siDR5 (Hs_TNFRSF10B_6 FlexiTube siRNA, cat# SI03094063), siTfam #2 (Hs_TFAM2 FlexiTube siRNA, cat# SI00049007), siTfam #4 (Hs_TFAM_4 FlexiTube siRNA, cat# SI00049021), siTfam #10 (Hs_TFAM_10 FlexiTube siRNA, cat# SI04988487) were obtained from Qiagen (Hilden, Germany). For target sequence of siRNA, see Supplementary Table 2 .
Western blotting
Protein was extracted from cells with lysis buffer (1% Triton-X 100, 10mM Tris-HCl, 150mM NaCl, 5mM EDTA, 10% glycerol, 1mM sodium vanadate, 1x cOmplete mini protease inhibitor cocktail [cat#11852700, Roche Diagnostics, Mannheim, Germany]). Protein lysates were cleared of debris by centrifugation at 15,000 ×g for 10 minutes at 4°C, and concentration was assessed by Bio-Rad colorimetric assay (cat#500-0006, Bio-Rad, Hercules, CA). Protein samples were boiled in an equal volume of Laemmli sample buffer (cat#161-0737, Bio-Rad, Hercules, CA, USA) containing 5% β-mercaptoethanol, fractionated by 10% or 4-20% sodium dodecyl sulfate polyacrylamide gel electrophoresis (SDS-PAGE) gel, and transferred to polyvinylidene fluoride membranes (cat#IPVH00010, Millipore, Bedford, MA). Antibodies used in the study were listed in Supplementary Table 2 . CellTiter-Glo® 2.0 assay ( ATP assay ) Cells were seeded at 10,000 cells/well in a 96 well white assay plate on the day before treatment. Cells were then treated in RPMI no-glucose growth medium (cat#11879-200, ThermoFisher) supplemented with either glucose (final 10mM) or galactose (final 10mM) with various concentration of the drugs such as ONC201, oligomycin, or metformin. Twenty-four or 72h after treatment, cellular ATP level was measured by adding same volume of CellTiter-Glo® 2.0 Assay reagent (cat#G9242, Promega). All ATP measurements were performed in triplicates and each experiment was carried out at least 3 times. Results were given as the mean +/− the SEM for at least 3 independent experiments. Mitochondrial respiration assay Oxygen Consumption Rate (OCR) and Extra Cellular Acidification Rate (ECAR) were measured with Seahorse XF e 24 Extracellular Flux Analyzer (Agilent Technologies, Santa Clara, CA, USA) with FluxPaks Mini (cat#100867-100). To measure OCR and ECAR of cells treated with ONC201 for 24 h, cells were seeded on XF24 cell culture microplate (60,000 cells/well for MB231, 30,000 cells/well for SKBR3 cells, 20,000 cells/well for HFF cells) with respective growth medium (Figure 3A , 6G , 7G ). Next day, medium was replaced with either glucose (10mM) or galactose (10mM)-supplemented medium with ONC201 (5 μM) or DMSO (Ctl.) and cells were incubated for 24 h. On the day of XF assay, cell culture medium was replaced with XF base medium (cat#102353-100, no glucose, no bicarbonate, no glutamine/GlutaMAX, nor sodium pyruvate) supplemented with glucose or galactose (10mM) with ONC201 (5μM) or DMSO (Ctl.) and subsequently OCR and ECAR were measured 3 times. For time-course experiments (Figure 3B ), MB231 cells were seeded on an XF24 cell culture microplate (60,000 cells/well). The next day, the culture medium was replaced with RPMI medium supplemented with galactose (10mM) and cells were incubated for 24 h. On the day of assay, medium was replaced with XF base medium supplemented with galactose (10mM), and drugs (ONC201 [5μM], oligomycin [1μM], metformin [20mM] and DMSO as control) were administered via injection port. OCR and ECAR were measured every 11 minutes (mix 3 minutes, wait 5 minutes, measure 3 minutes) for 20 h. For XF analyzer experiments with permeabilized MB231 cells ( Supplementary Figure 3E ), cells were seeded on an XF24 cell culture microplate (60,000 cells) one day before experiment. On the day of the experiment, 1x mitochondrial assay solution (MAS) (mannitol 220mM, sucrose 103.3mM, KH 2 PO 4 10mM, MgCl 2 5mM, HEPES 2mM, EGTA 1mM, fatty acid free BSA 0.2%, pyruvate 10mM, malate 1mM, pH=7.2) was prepared. Cells were washed with 1x MAS once, then permeabilized with 1x MAS supplemented with ADP (4mM final) and plasma membrane permeabilizer (PMP, 10μM, cat#102504-100, Agilent). Drugs (ONC201, oligomycin, rotenone etc.) were diluted in 1x MAS (without ADP and PMP) at 10x concentration and administered via ports of a cartridge at 1:9 volume ratio to achieve 1x concentration after administration. For XF analyzer experiments with freshly isolated mitochondria (Figure 3C ), mitochondria were isolated from MB231 cells using mitochondria/cytosol fractionation kit (cat# MIT1000, Millipore), as recommended by the manufacturer's protocol. Briefly, MB231 cells were grown in four or five 15 cm dishes until they became nearly confluent. The mitochondrial fraction was separated from cytosol fraction, and a part of mitochondrial fraction was lysed with the supplied mitochondrial lysis buffer to determine protein concentration. The rest of the isolated mitochondria were re-suspended in 1x MAS supplemented with pyruvate/malate/ADP (pH=7.2) at 20μg/50μl concentration. Isolated mitochondria were plated on an XF24 cell culture microplate at 20μg/50μl/well, the dish was spun down at 3000 x g , at 4°C for 15 minutes to let mitochondria attach to the bottom, and the final volume of each well was adjusted to 500 μl by adding 450 μl of 1xMAS supplemented with pyruvate/malate/ADP (pH=7.2). After 3 measurements of basal OCR/ECAR, drugs (DMSO control, Rotenone [final 2μM], ONC201 [final 20μM], and oligomycin [final 2μM]) were added to mitochondria, and OCR/ECAR were measured every 2.5 minutes (mix 30 seconds, wait 0, measure 2 minutes). For kidney cancer cells, OCR and ECAR were measured using XF96 extracellular flux analyzer (Figure 7A ). Twelve thousand cells were added per well in rho0 medium, and the cells were grown for 24 hours. One hour before the assay, the medium was replaced with Seahorse Assay Medium (DMEM without bicarbonate, 25mM D-glucose, 2mM L-glutamine, 1mM sodium pyruvate, pH=7.4).
Time-lapse live cell imaging
MB231 cells were seeded (60,000 cells/well) on a 24 well glass bottom plates (Part#P24-1.5H-N, CellVis, Mountain View, CA, USA) with RPMI1640 growth medium. The next day, medium was replaced with RPMI1640/galactose (10mM) supplemented with either ONC201 (5 μM) or DMSO, or RPMI1640/glucose (10mM) with GST-TRAIL (200 ng/ml). Each treatment was performed in duplicated wells. The phase-contrast images were captured from each well every 30minutes with AxioVision V4.8.2.0 software and Zeiss Observer Z1 microscope (40x objective) in 37°C, 5% CO 2 condition for up to 20 h. After recording the data, the image files were compiled using ImageJ (National Institutes of Health). Time-lapse live cell imaging experiments were repeated 4 times.
Mitochondrial fission analysis
MB231 cells (100,000 cells) were seeded on a 40mm glass cover slip (cat#40-1313-03192, Bioptechs Inc., Butler, PA) placed in a 60 mm cell culture dish. After treatment with ONC201 (5 μM) for 24 h, cells were stained with MitoTracker Deep Red (final 500nM, cat# M22426 , ThermoFisher) and Hoechst (1:2000, cat#33342, ThermoFisher) in complete growth medium for 30 minutes at 37°C in a CO 2 incubator. After washing with complete medium, images were acquired (see below “Confocal live cell imaging and image analysis”).
Mitochondrial membrane potential analysis
MB231 cells (100,000 cells) were seeded on a 40mm glass cover slip placed in a 60 mm cell culture dish. The next day, cells were co-stained with Tetramethylrhodamine methyl ester (TMRM, cat #T668, ThermoFisher) and MitotTacker Green FM (cat# M7514, ThermoFisher) for 30 minutes at 37°C CO 2 incubator. TMRM binds to lipophilic cations accumulated by mitochondria in proportion to membrane potential (ΔψΨm). MitoTracker Green FM covalently binds to mitochondrial matrix independent of ΔψΨm. After washing cells with complete medium twice, cells were treated with DMSO (Ctl.) or ONC201 (5 μM). Twenty-four hours later, Hoechst was added to culture medium (1:2000) and subsequently cell imaging was performed (see below “Confocal live cell imaging and image analysis”).
Mitochondrial DNA detection
MB231 cells seeded on a 40 mm glass cover slip as above were treated with DMSO (Ctl.) or ONC201 (5μM). Twenty-four hours later, cells were stained with MitoTracker Deep Red (final 500nM), PicoGreen (1:500, cat# P11495 , ThermoFisher) and Hoechst 33342 (1:2000, cat# H3570, ThermoFisher) in complete medium for 30 minutes at 37°C in a CO 2 incubator. After washing with complete medium, images were acquired as described below.
Confocal live cell imaging and image analysis
Coverslips were mounted on a temperature controlled, sealed chamber suitable for live cell imaging. Images were acquired with an Olympus FluoView 1000 Confocal Microscope (Olympus America) equipped with a 60x PLAPON oil immersion objective (NA 1.42) preheated to 37°C to avoid thermal aberrations. MitoTracker Green and Pico Green were excited with a 488-nm laser, TMRM was excited with a 561-nm laser, and MitoTracker Deep Red was excited with a 633-nm laser. Z-scans on cells were acquired at scan speeds of either 4 or 8 μs/pixel (320 ×320 pixels). Images were stored as TIFF files and analyzed using ImageJ (National Institutes of Health) or Imaris (Bitplane) software. Each experiment was performed in duplicates, and at least 3-4 images were captured from each sample. Electron microscopy MB231, HFF, and T47D cells were seeded in 6-well plates (200,000 cells/2 ml/well) with RPMI1640 growth medium and treated with ONC201 (5μM). After treatment for different times, cells were washed with phosphate buffer saline (PBS), trypsinized, and centrifuged at 1,000 rpm (216 x g ) for 10 minutes. After aspirating the supernatant, fixative (2% glutaraldehyde, 0.1M sodium cacodylate) was added to the cell pellets, samples were incubated for 2h at room temperature, then stored at 4°C.
Transmission electron microscope
(TEM) images were processed by Electron Microscopy Laboratory (EML) in the Advanced Technology Research Facility (ATRF), Leidos Biomedical Research, Inc. in Frederick National Laboratory for Cancer Research (Frederick, MD, USA). Mitochondrial DNA copy number analysis (experiments shown in Figure 5B, 5C , 6F , Supplementary Figure 5 , Supplementary Figure 8J ) Genomic DNA from cells were isolated with DNeasy Blood & Tissue kit (cat#69504, Qiagen). Change of mtDNA copy number was analyzed by quantitative PCR (qPCR) with Human mitochondrial to nuclear DNA ratio kit (cat#7246, Takara Bio USA Inc., Mountain View, CA). Briefly, relative mtDNA copy number was obtained by qPCR of two mtDNA genes (ND1, ND5) and two nuclear DNA (nDNA) genes (SLCO2B1, SERPINA1). For PCR reaction, PowerUp SYBR Green Master Mix was used (cat#A25742, ThermoFisher) with ViiA™ 7 Real-Time PCR System with 384-well block (cat#4453536, ThermoFisher). PCR cycle conditions were 50°C (2 minutes), 95°C (2 minutes), followed by 40 cycles of two-step cycling of 95°C (15 seconds) and 60°C (60 seconds). C t value of each target gene was obtained from qPCR results, then ΔC t 1 (C t [ND1]- C t [SLCO2B1]) and ΔC t 2 (C t [ND5]-C t [SERPINA1]) were obtained for each time point sample. Average value of 2 ΔC t1 and 2 ΔC t2 was calculated as relative mtDNA copy number. Generation of rho0 cells MB231 * rho0 (mtDNA depleted) cell lines were established by EtBr treatment, according to previously published protocol [ 48 ]. Briefly, cells were maintained in rho0 medium (DMEM high glucose [cat#11965092, ThermoFisher, 25mM glucose, 4mM L-glutamine] supplemented with 10 % FBS and 1 % P/S, sodium pyruvate [final 100ug/ml], uridine [final 50ug/ml]). Cells were plated at 1x 10 5 cells/10 cm and treated with EtBr (final 50 ng/ml). Approximately 1 week later, majority of the cells in the culture became non-viable and detached from the dish. Following several medium changes over the next few days, the remaining cells were trypsinized and re-plated onto several new 10 cm dishes at differing dilutions, and colonies were formed for approximately 2 weeks. Single colonies were picked using cloning rings and expanded further in the absence of EtBr. UOK121 * rho0 cell lines were established by EtBr treatment of UOK121 (renal cell carcinoma)[ 66 ] using similar protocol describe above. In brief, 1 × 10 6 UOK121 cells were plated on a 15cm tissue culture dish and grown continuously in the rho0 medium and viable single colonies were isolated and expanded as described above. Depletion of mtDNA was confirmed by qPCR using t-RNA-Leu (mtDNA gene) and POLG (DNA polymerase subunit gamma-1, nDNA gene, for primer sequence see Supplementary Table 2 ). The same PCR cycling condition was used as noted in the section above. Relative mtDNA copy number of parent and rho0 cells (Figure 7C, 7F ) was obtained as 2 ΔC t (C t [t-RNA-Leu]-C t [POLG]) . MB231 * rho0 cell clonal lines, UOK262, UOK121 * rho0 clonal line as well as parent cell lines were all maintained with rho0 medium.
RNA extraction for RNAseq
MB231 cells were seeded on four 6 well plates (1.25 × 10 6 cells/well). Cells in each plate were treated with ONC201 (5 μM) for different times (0, 3 h, 6 h, 24 h, 48 h). Cells were trypsinized and centrifuged at 310 x g for 5 minutes, then transferred to 1.5 ml tube, washed with PBS twice, snap frozen with ethanol-dry ice bath. RNA was isolated from cells using TRIZOL reagent (cat#15596018, ThermoFisher) as recommended by the manufacturer.
Library preparation and illumina sequencing
One microgram of total RNA per each time point was used as the input to an mRNA capture with oligo-dT coated magnetic beads. The mRNA was fragmented, and then a random-primed cDNA synthesis was performed. The resulting double-strand cDNA was used as the input to a standard Illumina library prep (TruSeq Stranded mRNA LT library prep kit, Illumina) with end-repair, adapter ligation and PCR amplification being performed to generate the library. The indexed mRNAseq libraries were quantitated by qPCR, pooled with equimolar amounts and sequenced on an Illumina HiSeq 2500 sequencer for a 2 x125 cycle run. Reverse transcriptase-PCR For experiment shown in Supplementary Figure 1B , MB231, MB468, SKBR3, T47D cells were grown in 60mm culture dishes, then treated with ONC201 at 5μM for 0, 24, 48, 72h. Total RNA was isolated with TRIZOL as described above. One microgram total RNA/each cell line was used for RT reaction (42°C for 15 minutes, 95°C for 3 minutes) with QuantiTect Reverse Transcription Kit (cat#205311, Qiagen). PCR reaction was performed with 2x PowerUp SYBER Green master mix (cat# A25777 , ThermoFisher Scientific). Primers used for qPCR were: TRAIL (Hs_TNFSF10_1_SG [cat#QT00079212]), DR4 (Hs_TNFRSF10A_1_SG [cat#QT00065723]), DR5 (Hs_TNFRSF10B_1_SG [cat#QT00082768)]), TFAM (Hs_TFAM_1_SG [cat#QT00012782]), DDIT3/CHOP (Hs_DDIT3_1_SG [cat# QT00082278]), GAPDH (Hs_GAPDH_1_SG [cat#QT00079247]), from Qiagen. All qPCR was performed with three technical replicates. PCR cycle condition was 50°C (2 minutes), 95°C (2 minutes), followed by 40 cycles of two-step cycling of 95°C (15 seconds) and 60°C (60 seconds). C t value of each target gene was obtained from qPCR results. Results were quantitatively analyzed with ΔΔC t method. Namely, ΔΔC t = (C t (target, treated) − C t (GAPDH, treated)) − (C t (target, untreated) − C t (GAPDH, untreated)). Then 2-ΔΔC t was used as relative copy number of each transcript. For experiment shown in Supplementary Figure 9 , total RNA was isolated and cDNA was prepared as described above. PCR reactions were performed with 2x PowerUp (described above) with DRD2 primers (Hs_DRD2_1_SG Quantitect Primer Assay, cat# 249900-QT00012558) and actin primers (Hs_ACTB_1_SG Quantitect Primer Assay, cat#249900-QT00095431, Qiagen). PCR cycle condition was 50°C (2 minutes), 95°C (2 minutes), followed by 40 cycles of two-step cycling of 95°C (15 seconds) and 60°C (60 seconds). C t value of each target gene was obtained from qPCR results. For quantitative analysis, first, ΔC t (DRD2 C t –actin C t ) was obtained in each cell line, ΔΔC t (difference of ΔC t between each cell line and reference cell line (GSC)) was calculated. Then 2-ΔΔC t was used as relative copy number of DRD2 transcript. Bioinformatics Bioinformatics analysis of RNAseq data was performed by CCR Collaborative Bioinformatics Resource, Leidos Biomedical Research, Inc. To generate heat map, 125 bp paired end reads for each sample were aligned using 2-pass STAR [ 67 ] aligner (v2.5.3a) to the human reference genome, hg19. Reads aligning to gene annotations (gencode release 19) were counted using RSEM [ 68 ] (v1.3) and differential gene expression analysis was performed using DESeq2 [ 69 ] R package. log2 fold changes for 3, 6, 12 and 24 h time points were then extracted for different time points and hierarchical clustering was performed to visualize expression changes for a variety of gene-sets as heatmaps generated using ClustViz [ 70 ]. Pre-ranked differentially expressed genes from DESeq2 [ 69 ] output where used to perform Gene Set Enrichment Analysis (GSEA) [ 71 ] with the Molecular Signature Database (MSigDB) [ 71 ] gene-set collection. Normalized enrichment scores (NES) for all mitochondrially relevant gene-sets for all time points where extracted from the GSEA results and hierarchical clustering was performed to depict temporal changes in the enrichment patterns. CellMiner Data analysis of ONC201 on the NCI-60 was performed using the NCI CellMiner website ( http://discover.nci.nih.gov/cellminercdb ).[ 72 , 73 ] Drug activities were plotted as z-score and TFAM mRNA expression as Affymetrix units.
Statistics
The significance of differences in data was determined with Student's t -test, or two-way ANOVA (see more details in figure legends). The differences were considered significant when p value was less than 0.05. Disclaimer (Electron Microscope Laboratory, Leidos Biomedical Research, Inc. Frederick National Laboratory for Cancer Research): This project has been funded in whole or in part with federal funds from the National Cancer Institute, National Institutes of Health, under contract HHSN26120080001E. The content of this publication does not necessarily reflect the views or policies of the Department of Health and Human Services, nor does mention of trade names, commercial products, or organizations imply endorsement by the U.S. Government.
📊 Figures
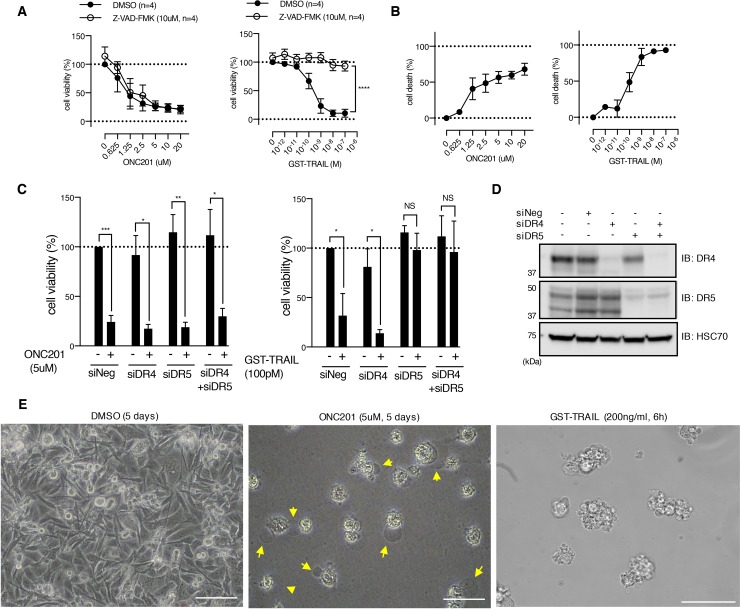
Figure 1
ONC201 kills breast cancer cells via caspase- and death receptor-independent mechanism
(A) Dose-dependent effect of ONC201 and GST-TRAIL on MB231 cell viability was examined with MTS assay for 5 days treatment, in the presence or absence of Z-VAD-FMK (10u03bcM). Results are shown as mea...
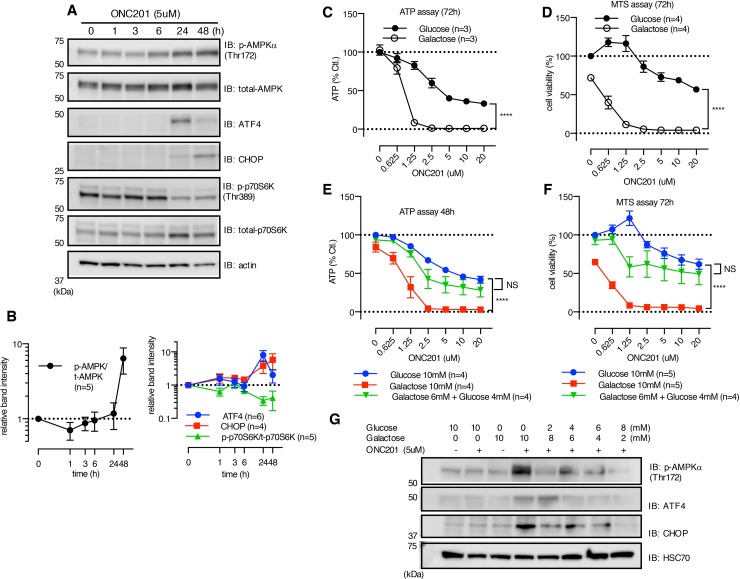
Figure 2
ONC201 induces AMPK activation
(A) Western blot showing the effect of ONC201 on MB231 cells at indicated time points. (B) Quantitative analysis showing band intensity of p-AMPK normalized with t-AMPK (left panel), and ATF4/CHOP and...
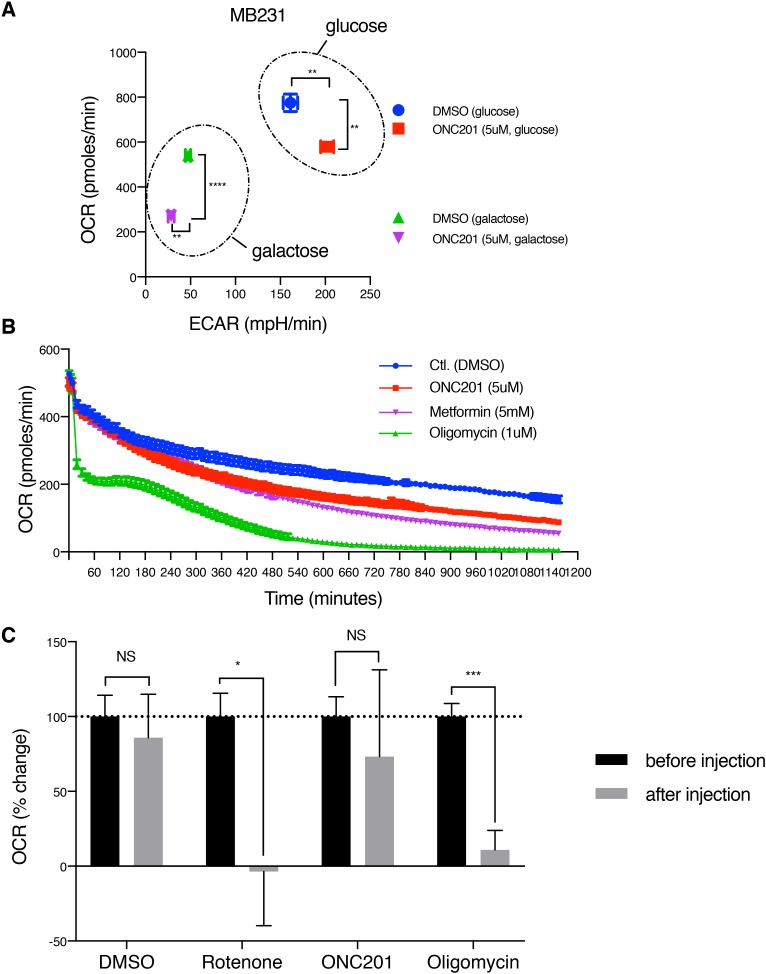
Figure 3
ONC201 inhibits mitochondrial respiration
(A) OCR/ECAR measurement of MB231 cells treated with either DMSO (Ctl.) or ONC201 (5u03bcM) in glucose or galactose medium for 24 h. OCR/ECAR were measured 5 times with 5 replicates for each condition...
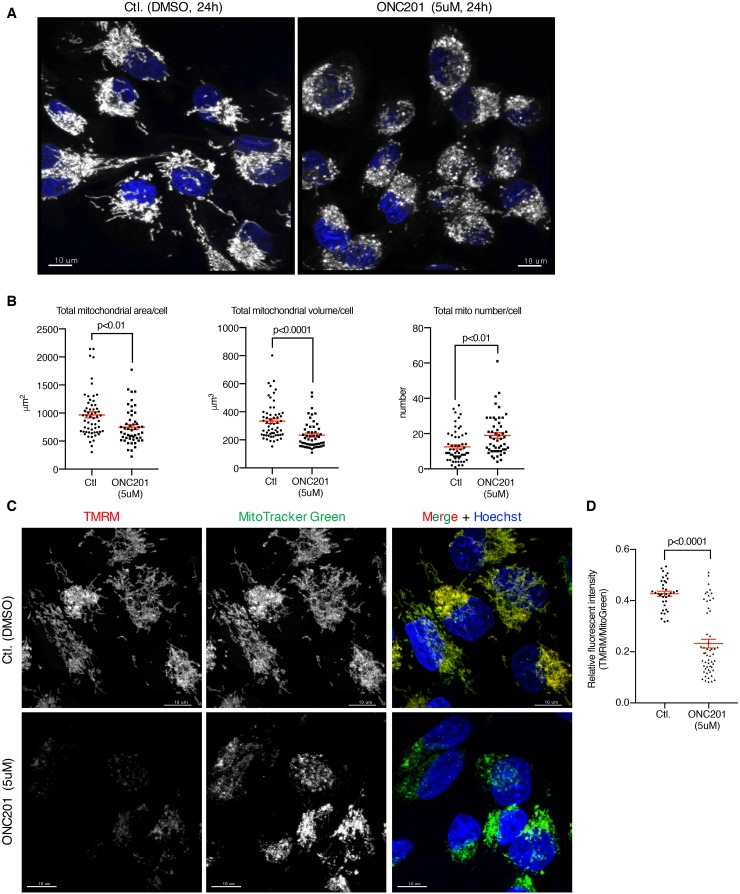
Figure 4
ONC201 induced mitochondrial structural damage and decreased mitochondrial membrane potential
(A) Confocal microscopy imaging of MB231 cells treated with DMSO (Ctl.) or ONC201 (5u03bcM). After 24 h drug treatment, mitochondria and nuclei were labeled with MitoTracker Deep Red (gray, pseudo col...
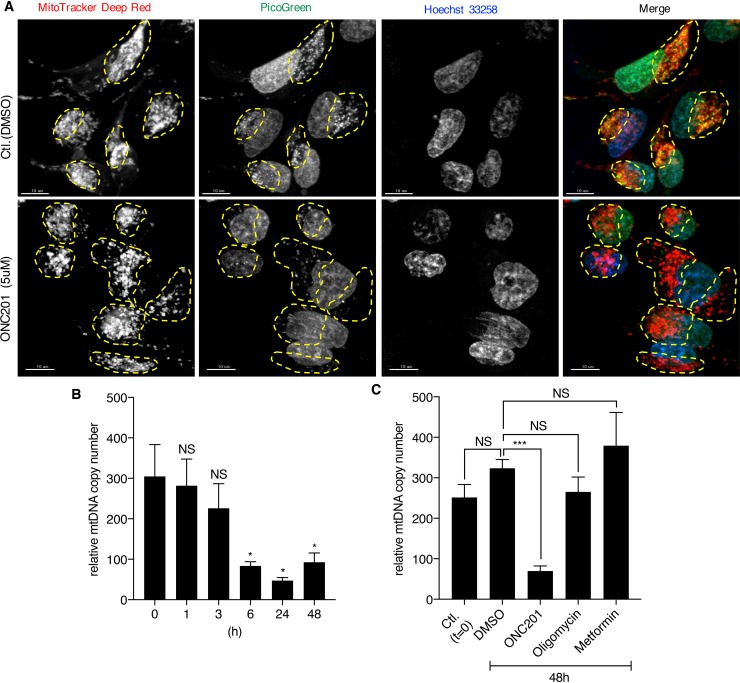
Figure 5
ONC201 depletes mtDNA
(A) Confocal microscopy images of MB231 cells. Cells were treated with DMSO (Ctl.) or ONC201 (5u03bcM) for 24 h in glucose medium, followed by co-staining with MitoTracker Deep Red (red), PicoGreen (g...
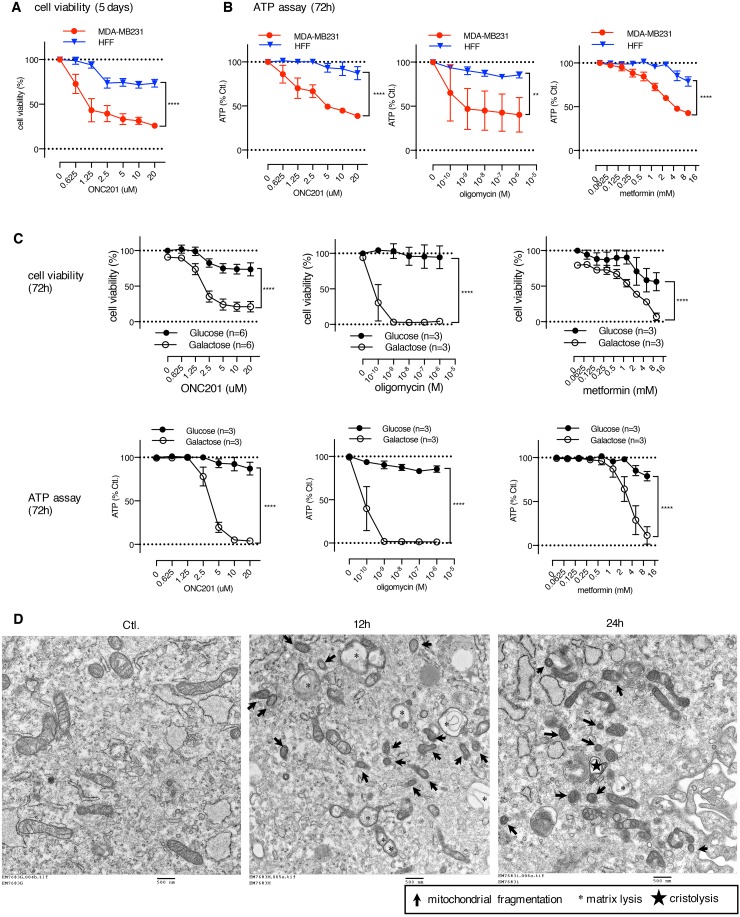
Figure 6
Human foreskin fibroblast cells are ONC201-resistant, despite mitochondrial damage and mtDNA depletion induced by ONC201
(A) Cell viability assays comparing the effect of ONC201 between MB231 and HFF cells in glucose medium. Results are shown as mean +/u2212 SEM of 3 independent experiments. (B) ATP assays comparing the...
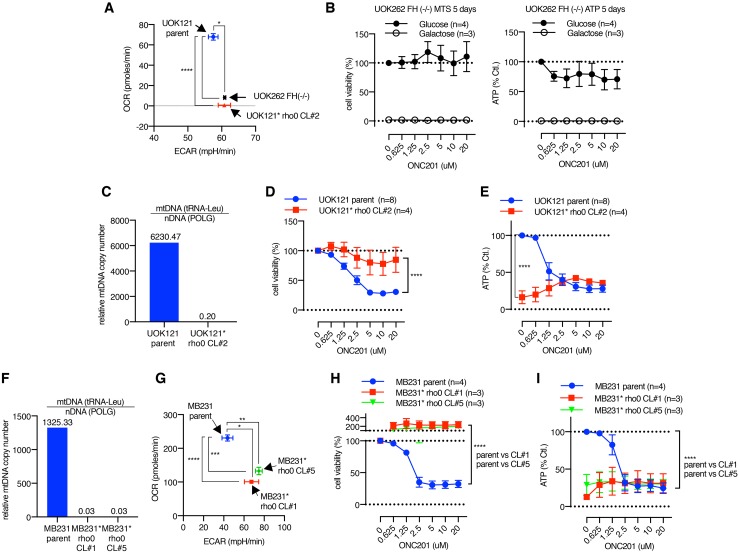
Figure 7
Cells with defective mitochondria are ONC201 resistant
(A) XF analyzer result illustrating OCR/ECAR of UOK262 FH (u2212/u2212) cells, UOK121 parent cells, and UOK121 * rho0 cells. Data is shown as mean +/u2212 SEM. * p<0.05, **** p<0.0001, t -test. ...
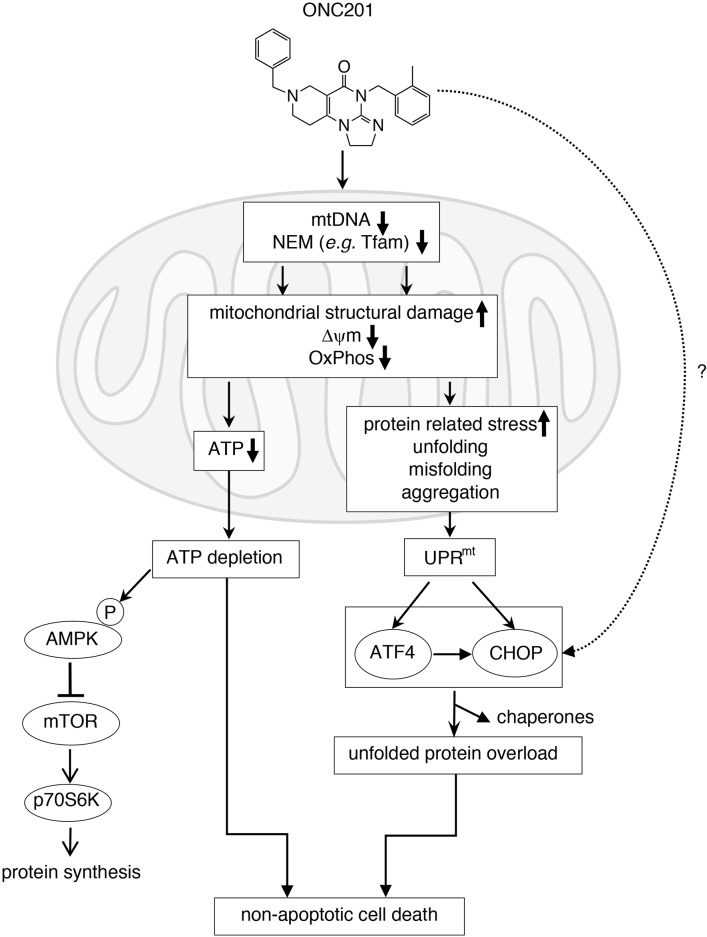
Figure 8
Proposed mechanism of action of ONC201 (see detail in Discussion)
Figure images are served from the NIH/NLM PubMed Central Open Access Subset or Europe PMC; copyright remains with the publishers and authors.
💬 Discussion
0 commentsNo comments yet. Be the first to start a discussion!
Leave a Comment