Abstract
Streptococcus pneumoniae is the main cause of bacterial meningitis, a life-threating disease with a high case fatality rate despite treatment with antibiotics. Pneumococci cause meningitis by invading the blood and penetrating the blood-brain barrier (BBB). Using stimulated emission depletion (STED) super-resolution microscopy of brain biopsies from patients who died of pneumococcal meningitis, we observe that pneumococci colocalize with the two BBB endothelial receptors: polymeric immunoglobulin receptor (pIgR) and platelet endothelial cell adhesion molecule (PECAM-1). We show that the major adhesin of the pneumococcal pilus-1, RrgA, binds both receptors, whereas the choline binding protein PspC binds, but to a lower extent, only pIgR. Using a bacteremia-derived meningitis model and mutant mice, as well as antibodies against the two receptors, we prevent pneumococcal entry into the brain and meningitis development. By adding antibodies to antibiotic (ceftriaxone)-treated mice, we further reduce the bacterial burden in the brain. Our data suggest that inhibition of pIgR and PECAM-1 has the potential to prevent pneumococcal meningitis.
🔬 Techniques
🔭 Microscopes
🧬 Organisms
💻 Software
✨ Fluorophores
🧪 Sample Preparation
🔬 Cell Lines
🏭 Microscope Brands
🧪 Reagent Suppliers
📷 Detectors
🔎 Objectives
🎨 Filters
💻 Software Details
🏛️ Research Organizations (ROR)
Affiliated research institutions:
📋 Methods
Pneumococcal strains and growth conditions
The bioluminescent TIGR4 strain of serotype 4 (Xenogen 3; PerkinElmer) was used in the in vivo mouse experiments. For in vitro experiments, nonbioluminescent WT TIGR4 and isogenic mutants in RrgA (TIGR4Δ rrgA ; Nelson et al., 2007 ) or PspC (TIGR4Δ pspC ; Dieudonné-Vatran et al., 2009 ) were used. Additionally, six clinical pneumococcal isolates were studied collected from patients who died of pneumococcal meningitis. All pneumococci were grown in Todd–Hewitt broth with 0.5% yeast extract (THY) at 37°C and growth was monitored by measuring the optical density (OD) at 600 nm with a spectrophotometer. At OD 600 =0.25–0.30 bacteria were harvested and collected in 1ml aliquots. For mouse experiments, bioluminescent TIGR4 aliquots were centrifuged at 10,000 rpm for 3 min and the pellet resuspended in 1 ml of sterile PBS. Serial dilutions were made in sterile PBS and plated on blood-agar plates to determine the dilutions required for 5 × 10 7 CFUs for intravenous challenge.
Human cell lines
HBMECs were obtained from J.M. van Dijl (University Medical Center Groningen, Groningen, Netherlands) and cultivated as previously described ( Iovino et al., 2013 ). Mouse experiments All animal experiments were approved by the local ethical committee (Stockholms Norra djurförsöksetiska nämnd). The bacteremia-derived meningitis model was performed as previously described ( Iovino et al., 2013 , 2016 ). All mice used (WT C57BL/6 and knockout mice [pIgR −/− and PECAM-1 −/− ]) were 6–7 wk old. pIgR −/− and PECAM-1 −/− mice were both in the C57BL/6 background. pIgR −/− breeding pairs were obtained from the Institute of Microbiology, ETH Zurich, Switzerland, and PECAM-1 −/− breeding pairs were obtained from the Blood Research Institute, Milwaukee, WI. For intravenous challenge, 200 µl of 5 × 10 7 CFU pneumococci was injected intravenously into the tail vein, and mice were sacrificed at 14 h after bacterial challenge. After sacrifice, unattached bacteria in the bloodstream were removed by perfusion with sterile PBS in the right ventricle via the vena cava until complete blood removal. After perfusion, mice were imaged using the IVIS Spectrum Imaging System and bioluminescent signal from the brain of the mice was imaged (for quantification of the bioluminescent signal, see Quantification of bioluminescent and fluorescent signal). After harvesting, one half of the brain (from five mice/group) was cryopreserved and stored with Shandon Cryomatrix (Thermo Fisher Scientific) at −80°C, whereas the other half, together with the full brains of the other mice, was used to prepare homogenate samples (see Preparation of mouse tissue homogenates). For antibody treatment in mice, 20 µg/ml receptor-specific antibodies (listed in the Antibodies and isotype controls section) was administered intravenously in a volume of 200 µl. All antibodies were diluted in sterile PBS. Antibodies were administered either 1 h before or after challenge with pneumococci. Anti-RrgA, PspC, and PspA antibodies (Table S5) were used to couple the bacteria (see description in Immunofluorescent stainings) 1 h before challenge of the mice. 100 mg/kg ceftriaxone (Sigma-Aldrich) was administered intravenously (either alone or in combination with anti-pIgR and anti–PECAM-1 antibodies) 1 h after challenge with pneumococci. Preparation of mouse tissue homogenates and bacteria count in the brain After harvesting, mouse brains were kept in 1 ml cold sterile PBS and homogenized using a cell strainer with a 100-µm filter (Falcon). Serial dilutions were made in sterile PBS and plated on blood-agar places for CFU counts.
Show full methods section
Pneumococcal strains and growth conditions
The bioluminescent TIGR4 strain of serotype 4 (Xenogen 3; PerkinElmer) was used in the in vivo mouse experiments. For in vitro experiments, nonbioluminescent WT TIGR4 and isogenic mutants in RrgA (TIGR4Δ rrgA ; Nelson et al., 2007 ) or PspC (TIGR4Δ pspC ; Dieudonné-Vatran et al., 2009 ) were used. Additionally, six clinical pneumococcal isolates were studied collected from patients who died of pneumococcal meningitis. All pneumococci were grown in Todd–Hewitt broth with 0.5% yeast extract (THY) at 37°C and growth was monitored by measuring the optical density (OD) at 600 nm with a spectrophotometer. At OD 600 =0.25–0.30 bacteria were harvested and collected in 1ml aliquots. For mouse experiments, bioluminescent TIGR4 aliquots were centrifuged at 10,000 rpm for 3 min and the pellet resuspended in 1 ml of sterile PBS. Serial dilutions were made in sterile PBS and plated on blood-agar plates to determine the dilutions required for 5 × 10 7 CFUs for intravenous challenge.
Human cell lines
HBMECs were obtained from J.M. van Dijl (University Medical Center Groningen, Groningen, Netherlands) and cultivated as previously described ( Iovino et al., 2013 ). Mouse experiments All animal experiments were approved by the local ethical committee (Stockholms Norra djurförsöksetiska nämnd). The bacteremia-derived meningitis model was performed as previously described ( Iovino et al., 2013 , 2016 ). All mice used (WT C57BL/6 and knockout mice [pIgR −/− and PECAM-1 −/− ]) were 6–7 wk old. pIgR −/− and PECAM-1 −/− mice were both in the C57BL/6 background. pIgR −/− breeding pairs were obtained from the Institute of Microbiology, ETH Zurich, Switzerland, and PECAM-1 −/− breeding pairs were obtained from the Blood Research Institute, Milwaukee, WI. For intravenous challenge, 200 µl of 5 × 10 7 CFU pneumococci was injected intravenously into the tail vein, and mice were sacrificed at 14 h after bacterial challenge. After sacrifice, unattached bacteria in the bloodstream were removed by perfusion with sterile PBS in the right ventricle via the vena cava until complete blood removal. After perfusion, mice were imaged using the IVIS Spectrum Imaging System and bioluminescent signal from the brain of the mice was imaged (for quantification of the bioluminescent signal, see Quantification of bioluminescent and fluorescent signal). After harvesting, one half of the brain (from five mice/group) was cryopreserved and stored with Shandon Cryomatrix (Thermo Fisher Scientific) at −80°C, whereas the other half, together with the full brains of the other mice, was used to prepare homogenate samples (see Preparation of mouse tissue homogenates). For antibody treatment in mice, 20 µg/ml receptor-specific antibodies (listed in the Antibodies and isotype controls section) was administered intravenously in a volume of 200 µl. All antibodies were diluted in sterile PBS. Antibodies were administered either 1 h before or after challenge with pneumococci. Anti-RrgA, PspC, and PspA antibodies (Table S5) were used to couple the bacteria (see description in Immunofluorescent stainings) 1 h before challenge of the mice. 100 mg/kg ceftriaxone (Sigma-Aldrich) was administered intravenously (either alone or in combination with anti-pIgR and anti–PECAM-1 antibodies) 1 h after challenge with pneumococci. Preparation of mouse tissue homogenates and bacteria count in the brain After harvesting, mouse brains were kept in 1 ml cold sterile PBS and homogenized using a cell strainer with a 100-µm filter (Falcon). Serial dilutions were made in sterile PBS and plated on blood-agar places for CFU counts.
Antibodies and isotype controls
All antibodies used for immunofluorescent detection, Western blot, and in vivo experiments are listed in Tables S1, S2, S3, S4, S5, S6, and S7. Immunofluorescent detection was performed using antibody combinations diluted in sterile PBS with 5% FCS (Biochrom) as follows. As isotype controls, rabbit and mouse IgG (Innovative Research), goat IgG (Santa Cruz Biotechnology, Inc.) and rat IgGs (Sigma-Aldrich) were used at the same dilution as those for specific primary antibodies where no fluorescent signal was detected. Antibodies used for Western blot experiments were diluted in PBS-T supplemented with 1% dry milk. Immunofluorescent stainings Tissue sections were fixed with acetone for 10 min and dried. Incubation with the antibodies was performed for 1 h, in the dark in case of fluorophore-labeled antibodies. Slides were washed twice in PBS for 5 min between the incubations. Once the staining was completed, Vectashield solution (Vector Laboratories) was added to each section before the coverslip was applied. Bacterial staining of RrgA, PspC (bacterial proteins), and pIgR, PECAM-1 (HBMEC receptors) was performed as previously described ( Iovino et al., 2016 ). In brief, after growth in THY medium, pneumococci were incubated with HBMEC lysate for 1 h. After incubation, the bacteria were washed three times with PBS-T, and immunofluorescent staining for RrgA/PspC and PECAM-1/pIgR was performed on bacterial pellets.
High-resolution microscopy imaging and 3D model reconstruction
Microscopic analysis was performed using a DV Elite microscope (Applied Precision Ltd.). The z-stack images were acquired using a scientific complementary metal-oxide semiconductor (sCMOS) camera and processed with SoftWoRx imaging program (Applied Precision Ltd.). Images (z-stacks) taken with the DV Elite Imaging System have been rotated using the 3D Volume Viewer function of the imaging software SoftWoRx.
STED super-resolution imaging
STED imaging was performed with an instrument from Abberior Instruments, built on a stand from Olympus (IX83), with a four-mirror beam scanner (Quad scanner; Abberior Instruments), and modified for two-color STED imaging. Two fiber-coupled, pulsed (20-MHz) diode lasers emitting at 637 nm (LDH-D-C; PicoQuant AG) and 594 nm (Abberior Instruments) are used for excitation (alternating pixel mode, with the excitation by the two lasers and gating of detector alternating in each pixel during scanning to minimize cross-talk). The beam of a pulsed fiber laser (model PFL-P-30-775-B1R, 775 nm emission, 40 MHz repetition rate, 1.2-ns pulse width, 1.2-W maximum mean power, 30-nJ pulse energy; MPB) is reshaped by a phase plate (VPP-1c; RPC Photonics) into a donut profile and then used for stimulated emission. The three laser beams are overlapped and then focused by an oil-immersion objective (UPLSAPO 100XO, NA 1.4; Olympus) into the sample. The fluorescence is collected through the same objective, separated from the excitation path via a dichroic mirror, passed through a motorized confocal pinhole (MPH16, set at 50-µm diameter; Thorlabs) in the image plane, split by a dichroic mirror, and then detected by two single-photon counting detectors (SPCM-AQRH-13; Excelitas Technologies), equipped with separate emission filters (FF01-615/20 and FF02-685/40-25; Semrock) and a common IR-filter (FF01-775/SP-25; Semrock) to suppress any scattered light from the STED laser. In this study, a spatial resolution (FWHM) of ∼25 nm could be reached. Image acquisition, including laser timing/triggering and detector gating, is controlled via a FPGA card and by the Imspector software (Abberior Instruments). Western blot analysis and quantification of protein expression 1 ml bacterial cultures (see Pneumococcal strains and growth conditions) was centrifuged at 10,000 rpm for 3 min, and the pellet was resuspended in 1× SDS-sample buffer (Thermo Fisher Scientific and Invitrogen) and boiled at 95°C for 5 min. Quality of each tissue homogenate was assessed by SDS-PAGE after Coomassie staining. Bacterial lysates were loaded onto a 10% NuPage Novex Bis-Tris Gel (Thermo Fisher Scientific and Invitrogen), and electroblotting was performed using the Bio-Rad Laboratories Trans-Blot Turbo Transfer System. Density of protein bands on Western blot membranes were measured with ImageJ ( Schneider et al., 2012 ). Rectangles were drawn around each protein band, the intensity of pixels from the top of the rectangle to the bottom of the rectangle was generated, and the areas of each peak of pixel intensity were calculated. Protein signal values (pIgR and PECAM-1) were corrected for the pneumolysin loading control.
PCR method
To assess the presence of rrgA and pspC genes in the clinical meningitis isolates, colony PCR was performed. Synthetic oligonucleotide primers (Sigma-Aldrich) used in PCR amplifications are listed below in List of primers used. PCR was performed using Fusion Flash Master Mix 2X (Thermo Fisher Scientific).
Preparation of human brain sections
The formaldehyde-fixed paraffin-embedded brain tissue blocks were cut at 4-µm thickness and mounted on the slide glass (Starfrost). Ethical approval was obtained from the Academic Medical Center of Amsterdam, Netherlands. In vitro interaction studies between S. pneumoniae and endothelial receptors using HBMECs Lysate of HBMECs was prepared as previously described ( Iovino et al., 2014b ). In brief, 250 µl RIPA lysis buffer was added to confluent HBMECs grown in T25 flasks (Starstedt). Cells were scraped and harvested and, after centrifugation at 13,000 rpm for 10 min at 4°C, the cell lysate in the supernatant was harvested. Quality of each tissue homogenate was assessed by SDS-PAGE after Coomassie staining. 100 µl HBMECs was added to 100 µl of the pneumococcal suspension in PBS (10 7 CFU/ml), and the mixture was incubated at 4°C with gentle agitation for 1 h. After cold centrifugation, the supernatant was removed and the bacterial pellet was resuspended in LDS sample buffer 1X LDS-sample buffer (Thermo Fisher Scientific and Invitrogen) and boiled at 95°C for 5 min. Lysates were loaded onto a 10% NuPage Novex Bis-Tris Gel (Thermo Fisher Scientific and Invitrogen), and electroblotting was performed using the Trans-Blot Turbo Transfer System.
Expression and purification of RrgA and PspA
Truncated rrgA encoding amino acids 39–868 was amplified by PCR from S. pneumoniae TIGR4 genomic DNA and ligated into pACYCDuet-1 vector (Novagen) to generate N-terminally 6x-His tagged RrgA 39–868 . Expression and purification was performed as described previously ( Moschioni et al., 2010 ), with a few changes. In brief, T7 express competent Escherichia coli cells (New England Biolabs, Inc.) expressing 6xHis- RrgA 39–868 were grown overnight at 16°C after induction of protein expression with isopropyl-β- d -thiogalactopyranoside at 1 mM final concentration. Cells were lysed by French press, and RrgA 39–868 was purified by nickel affinity chromatography on His-Trap HP columns (GE Healthcare) according to the manufacturer's instructions. Fractions containing purified protein were pooled and dialyzed overnight against 20 mM Tris-HCl, pH 7.5, for subsequent ion-exchange chromatography essentially as described elsewhere ( Moschioni et al., 2010 ). Pooled fractions containing RrgA 39–868 were dialyzed overnight against PBS and used for immunoprecipitation experiments. Part of the pspA open reading frame was PCR amplified from genomic DNA from the S. pneumoniae TIGR4 strain using primers pspA -frw and pspA -rev. The amplicon included codon 32–774 plus the TAA stop codon, thus excluded the 31st first codons encoding the N-terminal signal peptide. The primers also included nonannealing overhang sequences complementary to a sequence in the pET21d vector. The pET21d vector (EMD Millipore) was PCR amplified with the pET21d-frw and pET21d-rev primers. The pspA amplicon and the pET21d amplicon were purified with QIAquick PCR Purification kit (QIAGEN) and mixed and incubated with DpnI restriction enzyme for 2 h at 37°C to degrade the backbone template vector. An aliquot from the mixture was used to transform XL gold cells (Agilent Technologies), and the insert was integrated into the vector by in vivo homologous recombination ( Bubeck et al., 1993 ; Mellroth et al., 2012 ). The plasmid was recovered from colonies isolated from ampicillin-containing Luria agar plates. The sequence of the pspA -pET21d expression vector was confirmed by DNA sequencing. For protein expression, competent Rosetta 2 cells (EMD Millipore) were transformed with the pspA -pET21d, and protein expression and purification followed the same procedure previously described for purification of LytA ( Mellroth et al., 2012 ). List of primers used The following primers were used: pspC forward, 5′-CTTCTTCATATGACAGAGAACGAGGGAGCTACCCAAGTA-3′; pspC reverse, 5′-CTTCTTCTCGAGCGCCATTGAACCATCAGTATTGTA-3′; rrgA forward, 5′-CGCGGATCCGAAAAAAGTAAGAAAGATATTTCAGAAGGCAGTTG-3′; rrgA reverse, 5′-CGCGTCGACTTACGGATGTTTCCGTGTGTATAATAGAACTC-3′; aroE forward, 5′-AAGCTTGATGGCTATACACG-3′; aroE reverse, 5′-ATCCATGCCCACACTGG-3′; pspA forward, 5′-TATACCTTGGCTAGCAGATGGAAGAATCTCCACAAGTTGT-3′; pspA reverse, 5′-AGCAGCCGGATCCTCGAGTTAAACCCATTCACCATTGG-3′; pET21 forward, 5′-CTCGAGGATCCGGCTGCTAAC-3′; and pET21 reverse, 5′-CATCTGCTAGCCAAGGTATA-3′. Coimmunoprecipitation experiments between pneumococcal proteins and host receptors For each coimmunoprecipitation experiment, 50 µl magnetic Dynabeads (Thermo Fisher Scientific and Invitrogen) was transferred into an Eppendorf tube. The tube was placed on a magnet to separate beads from the solution, the supernatant was removed, and the tube displaced from the magnet. 100 µl anti-RrgA antiserum (1–5 µg) diluted in PBS was added to the beads and incubated rotating for 30 min at room temperature. The tube was placed on the magnet, the supernatant was removed, the bead–antibody complex was washed with PBS-T, the tube was placed on the magnet to remove the supernatant, and 100 µl antigen (1–5 µg) was added. The bead–antibody–antigen complex was incubated with rotation for 30 min at room temperature. The tube was placed on the magnet to remove the supernatant, and bead–antibody–antigen was washed with PBS-T. The tube was placed on the magnet to remove the supernatant, and either mouse pIgR (catalog no. CF-2800; R&D Systems) or PECAM-1 (catalog no. 3628-PC; R&D Systems) was added, and the bead–antibody–antigen–protein complex was incubated with rotation for 30 min at room temperature. The tube was placed on magnet to remove the supernatant, and the complex was washed with PBS-T. LDS sample buffer 1X (Thermo Fisher Scientific and Invitrogen) was added, and the complex was boiled at 95°C for 10 min. Beads were finally separated from proteins using the magnet, and protein detection was performed using SDS-PAGE and Western blot (see Western blot analysis). As a negative control, anti–GST antibody (Sigma-Aldrich) was coupled with beads and the same coimmunoprecipitation experiment was performed with pIgR and PECAM-1.
Quantification of bioluminescent and fluorescent signal
Bioluminescence signal (data shown in Fig. S2) was quantified using ImageJ ( Schneider et al., 2012 ). Bioluminescent signal was selected using the function Image-Adjust-Color Threshold. RGB Profile Plot was generated for each image taken with the IVIS Spectrum System, and intensities of blue/green/red colors were measured separately. Intensity of RGB (red, green, blue) colors was plotted in histograms displaying on the y axis the total RGB color intensity, and each column was divided into three parts (three colors: red, green, and blue) according to the intensity of each color. The color scale with the distinction of red (very severe infection), green (severe infection), and blue (mild infection) color range is shown. Fluorescent signal (data shown in Fig. S2, A–G) was quantified by ImageJ ( Schneider et al., 2012 ). Fluorescent signal for each separate fluorescent channel was selected using the function Image-Adjust-Color Threshold, and area covered by each fluorescent signal was measured using the function Analyze-Measure.
Colocalization analysis
Using the images obtained with Delta Vision Elite Imaging
System, colocalization between two separate fluorescent signals was performed using ImageJ (National Institutes of Health; Schneider et al., 2012 ) Colocalization plug-in function turns all colocalized pixels in white color. Quantification of the colocalized pixels was performed using the function Image-Adjust-Color Threshold to select the area of colocalization and the area was measured using the function Analyze-Measure.
Statistical analysis
For multiple comparisons, the nonparametric ANOVA test was used to assess the presence of the differences between the groups, and then the Dunn test was used to make pairwise comparisons. Supplemental material Fig. S1 includes additional data from the high-resolution immunofluorescent analysis of human brain biopsies. Fig. S2 shows IVIS imaging analysis detecting bioluminescent pneumococci in the brain in vivo mice. Tables S1, S2, S3, S4, S5, S6, and S7 include primary and secondary antibodies, markers, and fluorophores for in vitro and mouse-specific antibodies for in vivo experiments.
PCR method
To assess the presence of rrgA and pspC genes in the clinical meningitis isolates, colony PCR was performed. Synthetic oligonucleotide primers (Sigma-Aldrich) used in PCR amplifications are listed below in List of primers used. PCR was performed using Fusion Flash Master Mix 2X (Thermo Fisher Scientific).
Supplemental material Fig. S1 includes additional data from the high-resolution immunofluorescent analysis of human brain biopsies. Fig. S2 shows IVIS imaging analysis detecting bioluminescent pneumococci in the brain in vivo mice. Tables S1, S2, S3, S4, S5, S6, and S7 include primary and secondary antibodies, markers, and fluorophores for in vitro and mouse-specific antibodies for in vivo experiments.
Supplementary Material Supplemental Materials (PDF)
📊 Figures
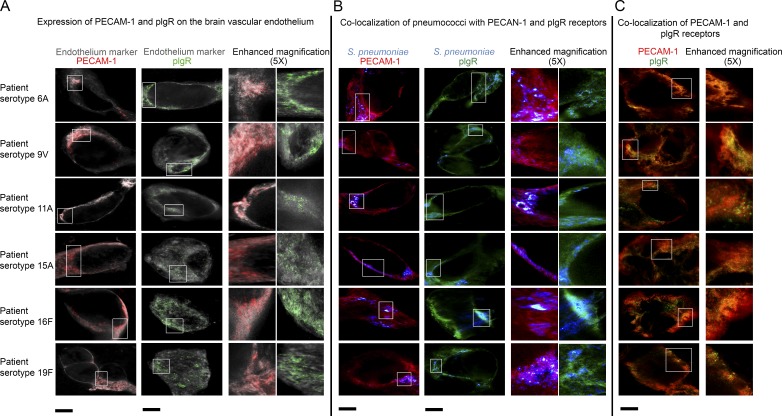
Figure 1.
STED super-resolution microscopy of biopsies from meningitis patients shows that pIgR and PECAM-1 are expressed on the BBB endothelium and colocalize with pneumococci. Immunofluorescent staining using...
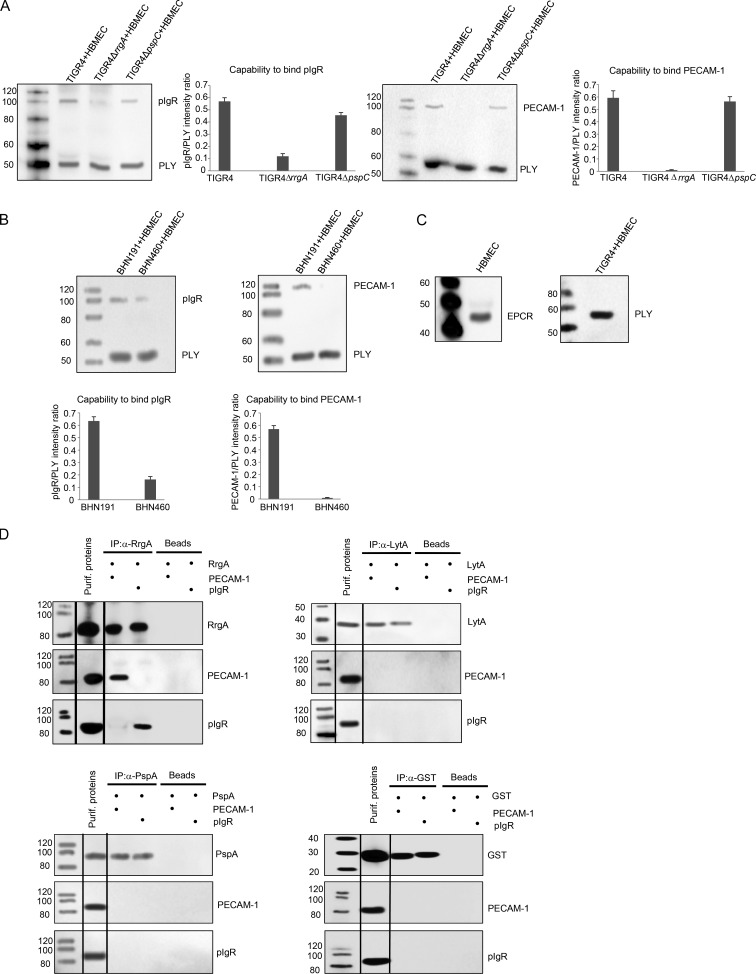
Figure 2.
RrgA and PspC are the pneumococcal ligands for pIgR, whereas only RrgA binds to PECAM-1 expressed by brain endothelial cells. Incubation of TIGR4, TIGR4 u0394rrgA , TIGR4 u0394pspC , and the clinical ...
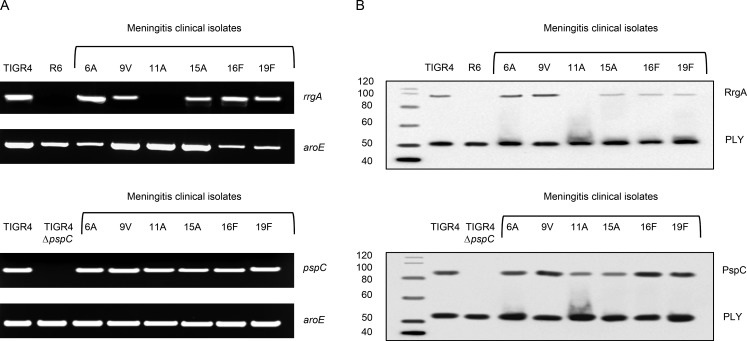
Figure 3.
Meningitis isolates that express RrgA and PspC bind to pIgR and PECAM-1 expressed by brain endothelial cells. (A) PCR analysis targeting rrgA and pspC genes in the clinical isolates from six meningiti...
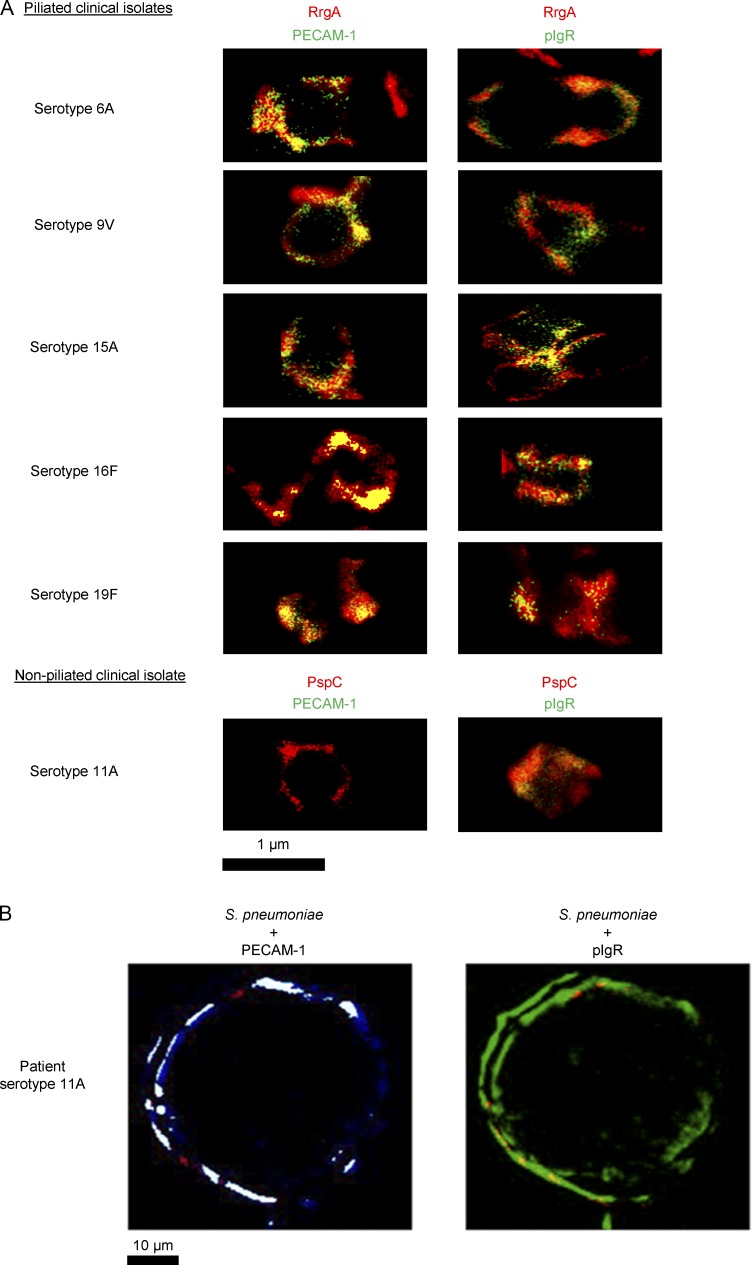
Figure 4.
STED super-resolution microscopy showing that endothelial pIgR and PECAM-1 colocalize with RrgA in piliated strains, whereas pIgR colocalizes with PspC in nonpiliated 11A pneumococci. (A) STED imaging...
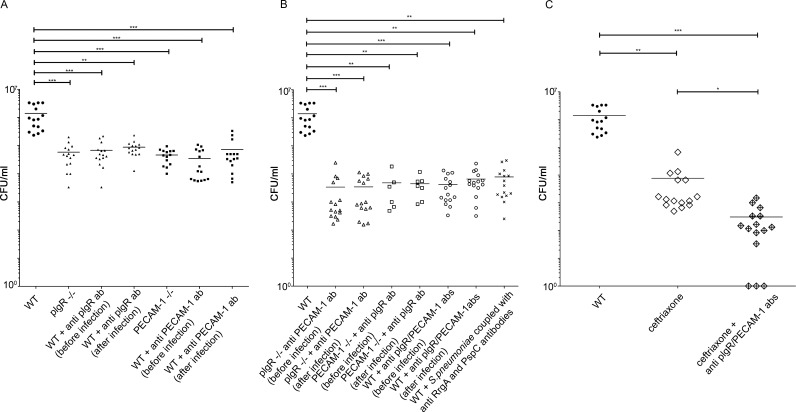
Figure 5.
Antibody treatment targeting PECAM-1 and/or pIgR reduces pneumococcal invasion of the brain in mice. C57BL/6 mice were infected intravenously with the bioluminescent TIGR4 strain. Information on the p...
Figure images are served from the NIH/NLM PubMed Central Open Access Subset or Europe PMC; copyright remains with the publishers and authors.
💬 Discussion
0 commentsNo comments yet. Be the first to start a discussion!
Leave a Comment