Abstract
Despite the lipolysis-lipogenesis cycle being a fundamental process in adipocyte biology, very little is known about the morphological changes that occur during this process. The remodeling of lipid droplets to form micro lipid droplets (mLDs) is a striking feature of lipolysis in adipocytes, but once lipolysis ceases, the cell must regain its basal morphology. We characterized mLD formation in cultured adipocytes, and in primary adipocytes isolated from mouse epididymal fat pads, in response to acute activation of lipolysis. Using real-time quantitative imaging and electron tomography, we show that formation of mLDs in cultured adipocytes occurs throughout the cell to increase total LD surface area by ~30% but does not involve detectable fission from large LDs. Peripheral mLDs are monolayered structures with a neutral lipid core and are sites of active lipolysis. Electron tomography reveals preferential association of mLDs with the endoplasmic reticulum. Treatment with insulin and fatty acids results in the reformation of macroLDs and return to the basal state. Insulin-dependent reformation of large LDs involves two distinct processes: microtubule-dependent homotypic fusion of mLDs and expansion of individual mLDs. We identify a physiologically important role for LD fusion that is involved in a reversible lipolytic cycle in adipocytes.
🔬 Techniques
🔭 Microscopes
✨ Fluorophores
🧪 Sample Preparation
🔬 Cell Lines
🏭 Microscope Brands
🧪 Reagent Suppliers
💻 Software Details
🏛️ Research Organizations (ROR)
Affiliated research institutions:
📋 Methods
Cell culture 3T3-L1 fibroblasts (American Type Culture Collection, Rockville, MD) were maintained as described previously ( Martin and Parton, 2005 ) and used between days 6 and 12 of postdifferentiation. Primary adipocytes were isolated from the epididymal fat pads of ∼12-wk-old C57BI/6 mice by collagenase digestion as described previously ( Lawrence et al. , 1990 ). To fix cells for immunofluorescence microscopy, 16% paraformaldehyde was added directly to suspended cells to give a final concentration of 4% and samples incubated at room temperature for 30 min. We placed 200-μl drops of fixed cells onto Parafilm, and a 22-mm 2 poly- l -lysine–coated coverslip floated on top of the drop for 15 min at room temperature to allow cells to adhere. All steps for immunolabeling were performed as described previously ( Murphy et al. , 2010 ). Antibodies, plasmids, and reagents Rabbit anti–Phospho PKA Substrate (RRXS/T; catalogue no. 9624) was obtained from Cell Signaling Technology (Beverly, MA), and rabbit anti–perilipin A (P1998) and mouse anti–α-tubulin clone DM 1A (T9026) were obtained from Sigma-Aldrich (St. Louis, MO). Alexa 488– and Alexa 594–conjugated secondary antibodies were obtained from Molecular Probes (Eugene, OR). Bodipy 493/503 was obtained from Molecular Probes and prepared as a saturated solution in ethanol (working dilution, 1:200). Phalloidin was obtained from Invitrogen (Carlsbad, CA). Oleic acid was obtained from Calbiochem (La Jolla, CA) and conjugated to fatty acid–free bovine serum albumin before use. All other reagents were obtained from Sigma-Aldrich unless stated otherwise.
Show full methods section
Cell culture 3T3-L1 fibroblasts (American Type Culture Collection, Rockville, MD) were maintained as described previously ( Martin and Parton, 2005 ) and used between days 6 and 12 of postdifferentiation. Primary adipocytes were isolated from the epididymal fat pads of ∼12-wk-old C57BI/6 mice by collagenase digestion as described previously ( Lawrence et al. , 1990 ). To fix cells for immunofluorescence microscopy, 16% paraformaldehyde was added directly to suspended cells to give a final concentration of 4% and samples incubated at room temperature for 30 min. We placed 200-μl drops of fixed cells onto Parafilm, and a 22-mm 2 poly- l -lysine–coated coverslip floated on top of the drop for 15 min at room temperature to allow cells to adhere. All steps for immunolabeling were performed as described previously ( Murphy et al. , 2010 ). Antibodies, plasmids, and reagents Rabbit anti–Phospho PKA Substrate (RRXS/T; catalogue no. 9624) was obtained from Cell Signaling Technology (Beverly, MA), and rabbit anti–perilipin A (P1998) and mouse anti–α-tubulin clone DM 1A (T9026) were obtained from Sigma-Aldrich (St. Louis, MO). Alexa 488– and Alexa 594–conjugated secondary antibodies were obtained from Molecular Probes (Eugene, OR). Bodipy 493/503 was obtained from Molecular Probes and prepared as a saturated solution in ethanol (working dilution, 1:200). Phalloidin was obtained from Invitrogen (Carlsbad, CA). Oleic acid was obtained from Calbiochem (La Jolla, CA) and conjugated to fatty acid–free bovine serum albumin before use. All other reagents were obtained from Sigma-Aldrich unless stated otherwise.
Indirect immunofluorescence microscopy and real-time video microscopy
Indirect immunofluorescence microscopy was performed as described previously ( Murphy et al. , 2010 ). The data were processed using the LSM 510 Meta software (Carl Zeiss, Jena, Germany), and images were assembled using Photoshop CS5 (Adobe Systems, Mountain View, CA). Confocal micrographs are representative of hundreds of cells observed in more than three experiments. Cells for real-time microscopy were plated onto glass-bottomed tissue culture dishes (MatTek Corporation, Ashland, MA) or 25-mm, round glass coverslips and transferred into CO 2 -independent medium (Invitrogen) supplemented with 0.1% fatty acid–free bovine serum albumen (Calbiochem). When used, Bodipy 493/503 was diluted 1:4000 directly to the imaging medium 10 min before start of imaging. Reagents were diluted in 1 ml of medium and added to 3 ml of medium covering cells before imaging. For 4D imaging, time series were collected at 37°C using Axiovert 200M SP LSM 510 META or 710 META confocal laser scanning inverted microscopes equipped with a 63× oil immersion objective (numerical aperture, 1.4) and a heated stage. The z -stack confocal images were taken at 30-s intervals using AIM, version 3.2, or Zen 2009 software (Zeiss). QuickTime videos (Apple, Cupertino, CA) were assembled using ImageJ 1.37p (National Institutes of Health, Bethesda, MD) or Imaris, version 7 (Bitplane, Zurich, Switzerland), and still images were compiled using Adobe Photoshop CS5.
Mathematical and statistical analysis
Given that analysis of confocal z -stack images demonstrated that the lipid droplets were spherical, surface area (S.A. = 2πr 2 ) and volume (V = [4/3]πr 3 ) were calculated from the radii of individual droplets, as measured in the xy -plane bisecting the largest apparent diameter of the LD. In fixed cells, measurement of the lipid droplet radii through one xy -plane was used to derive lipid droplet dimensions from micrographs. Between 500 and 1000 lipid droplets were analyzed in >100 cells from randomly chosen fields for each experiment and differences compared using an unpaired Student's t test (two tailed, unequal variance). Graphs depict average ± SEM unless otherwise stated.
Western blotting
SDS–PAGE and Western blot analysis was carried out as described previously ( Murphy et al. , 2010 ). Briefly cells were lysed in 10 mM Tris, 150 mM NaCl, 5 and mM EDTA, pH 7.4, containing phosphatase and proteinase inhibitors (Roche, Indianapolis, IN), and solubilized in Laemmli sample buffer containing 25 mM dithiothreitol. Immunolabeled proteins were visualized using horseradish peroxidase–conjugated secondary antibodies and developed using the Supersignal ECL reagent (Pierce/Quantum Scientific, Murarrie, Australia).
Electron microscopy
Sapphire disks (Engineering Office M. Wohlwend, Sennwald, Switzerland) were coated with atomized carbon using a Baltec MED 020 coating system (Leica, Wetzlar, Germany) and baked at 120°C for 6–12 h. The 3T3-L1 fibroblasts were plated onto sterilized sapphire disks and differentiated into adipocytes. All reagents used for electron microscopy sample preparation were obtained from ProSciTech (Kirwan, Australia) unless otherwise stated. Sample preparation for electron microscopy was performed as described previously ( Nixon et al. , 2009 ). Cells on sapphire disks were immersed in 0.7% low melting point agarose (Progen Biotechnik, Heidelberg, Germany) in DMEM at 37°C and placed into carriers for high-pressure freezing (HPF). HPF was performed using an EMPACT 2 HPF (Leica). Sapphire disks were rapidly fixed at 0°C and 2000-bar pressure. Subsequent cryosubstitution was performed with an EM AFS 2 (Leica). Samples for ultrastructural analysis were dehydrated in dry acetone and simultaneously postfixed and stained in a solution comprising1% osmium tetroxide, 0.5% uranyl acetate (SPI, West Chester, PA), and 5% H 2 O in acetone. Cryosubstitution was performed at −90°C over 52 h, raised to 20°C over 48 h, and samples were dehydrated stepwise into acetone using a BioWAVE microwave (Pelco, Ted Pelling, Redding, CA) at room temperature. Samples were sequentially microwaved at 250 W for 40 s in 50% acetone, 70% acetone, and 90% acetone and two 100% acetone washes before embedding in epoxy resin. For embedding, samples were microwaved at 250 W for 3 min under vacuum in 50% resin (in acetone) and then twice in 100% resin. The resin was polymerized in a 60°C oven for 48 h. Alternatively, samples for immunolabeling were frozen as detailed and cryosubstituted into 0.2% uranyl acetate and 5% H 2 O in acetone over 120 h at −85°C. Samples were embedded in Lowicryl (HM20) resin using an EM AFS2 S6E cryosubstitution machine with FSP robot attachment (Leica). Samples were dehydrated in acetone at −50°C (five 20-min washes) before embedding in Lowicryl resin. Samples were incubated at −50°C in 50% resin (in acetone) for 2 h and in 75% resin (in acetone) for 2 h, followed by three 15-h exchanges in 100% resin. The Lowicryl resin was polymerized under UV light for 48 h at −50°C, after which the temperature was increased to 20°C over 2 h and the sample further incubated under UV light for a further 48 h at 20°C. For immunolabeling, ultrathin sections (60–65 nm) of Lowicryl-embedded samples were washed for 2 min in 0.1 M PHEM (60 nM 1,4-piperazinediethanesulfonic acid, 25 mM 4-(2-hydroxyethyl)-1-piperazineethanesulfonic acid, 10 mM ethylene glycol tetraacetic acid, and 2 mM MgSO 4 , pH 7)/137 mM NaCl buffer, quenched in PHEM/NaCl with 10% glycine for 10 min, and blocked in PHEM/NaCl with 10% glycine, 10% fish skin gelatin, and 10% bovine serum albumin for 15 min. Sections were incubated for 30 min in primary antibody diluted 1:100 in blocking solution. Sections were washed twice in blocking solution, followed by two washes in PHEM/NaCl. Sections were then incubated for 30 min in 10 nm protein A–gold (obtained from the Cell Microscopy Center, University Medical Center, Utrecht, Netherlands), which was diluted 1:70 in blocking solution. After this, the sections were washed twice in blocking solution and then twice in PHEM/NaCl before incubation for 5 min in 1% glutaraldehyde in PHEM/NaCl. Sections were then washed twice in ultrapure water and dried on Whatman paper. For imaging of unlabeled, ultrathin epoxy resin sections (60–65 nm), samples were poststained first with a solution of 5% uranyl acetate and 50% ethanol in H 2 O for 2 min, followed by three 1-min washes in H 2 O, a 30-s incubation in Reynolds' lead citrate solution, and three further 1-min washes in H 2 O. Both epoxy resin– and Lowicryl-embedded samples were imaged in a JEOL 1011 electron microscope (JEOL, Peabody, MA) at 80 kV. Images were captured using a Morada digital camera (Olympus, Center Valley, PA), analyzed using ImageJ software, and compiled using Photoshop CS5. For all ultrastructural and immuno–electron microscopy a minimum of three experiments were performed, with at least two sapphire disks processed, sectioned, and imaged per condition. In some experiments 3T3L1 adipocytes were fixed in glutaraldehyde and processed for Epon embedding as described previously ( Parton et al. , 2002 ). For high-resolution tomography, each side of the thick sections (300 nm) was labeled for 5 min with 10 nm of protein A–gold diluted 1:10 in H 2 O, followed by three 5-min water washes, to generate fiducial markers. A Tecnai F30 microscope (FEI, Hillsboro, OR) was used to image the dual-axis tilt series at 2° increments from −60° to +60° at an accelerating voltage of 300 kV. Images were captured using an LC-1100 4K by 4K camera (Direct Electron, San Diego, CA) at a binning of 2 equipped with the microscope control program SerialEM. Tomogram alignments and weighted backprojection reconstructions were performed using IMOD software (Boulder Laboratories for 3D Electron Microscopy of the Cell, University of Colorado, Boulder, CO). Areas to be imaged were selected from four different isoproterenol-treated 3T3-L1 adipocytes, two cells each from two experiments. mLDs were identified as electron-lucent circular structures with diameters ≤500 nm. Organelles were manually segmented at high fidelity and meshed in 3dmod as previously described ( Richter et al. , 2008 ). The slicer tool was used in 3dmod, and optical slices were averaged to improve contrast and aid in resolving fine structures. Quantification of tomographic volumes was performed as follows. Subtomograms were extracted with dimensions 600 by 600 nm by the thickness of the section surrounding all mLDs, MVBs, and MC (chosen because these values were sufficient to encompass the full diameter of the organelle of interest, as well as any closely associated organelle in all directions). The program imodinfo in IMOD was used to extract all volumetric data within the given subtomograms, and statistical significance was determined using Student's t tests.
📊 Figures
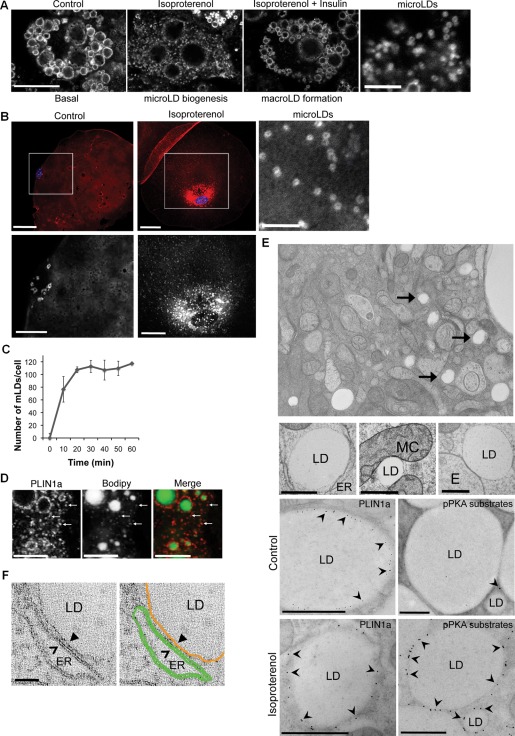
FIGURE 1:
mLDs are sites of active lipolysis and interact with other organelles. (A) 3T3-L1 adipocytes were stimulated with 10 u03bcM (in CO 2 -independent media containing 0.1% bovine serum albumin) Isop u00b1...
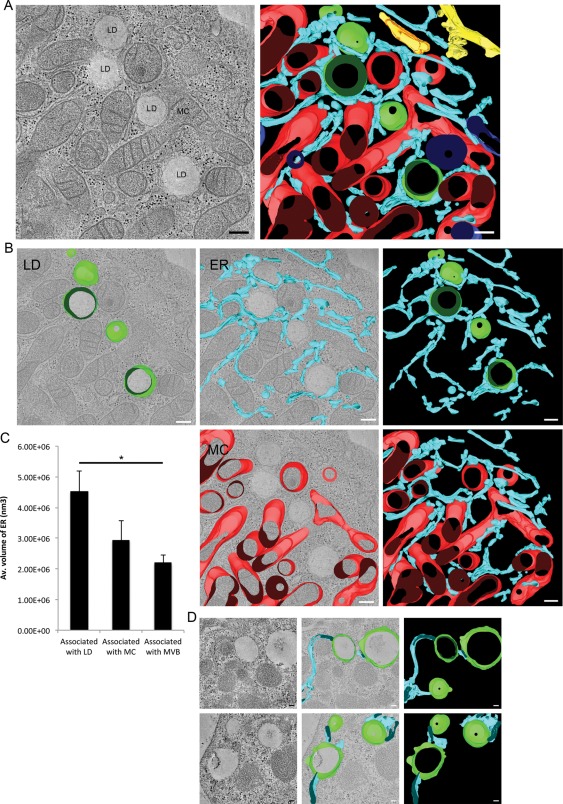
FIGURE 2:
mLDs interact preferentially with the endoplasmic reticulum. (A) An optical slice and complete reconstruction of several mLDs from HPF and Lowicryl-embedded, Isop-treated adipocyte. mLD, green; ER, li...
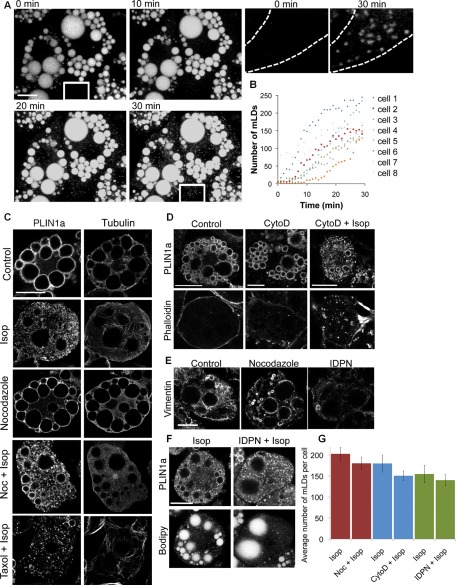
FIGURE 3:
mLD biogenesis does not require an intact cytoskeleton. (A) 3T3-L1 adipocytes stained with Bodipy 493/503 and treated with Isop immediately before time-lapse z -stack confocal imaging. Images were acq...
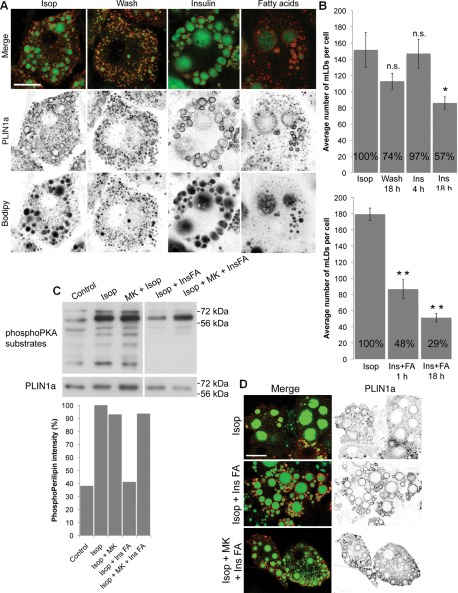
FIGURE 4:
Insulin stimulates macroLD formation from mLDs. (A) 3T3-L1 adipocytes were activated with Isop before an 18-h chase in normal medium (Wash), 100 nM insulin (Ins), or 50 u03bcg/ml oleic acid (fatty aci...
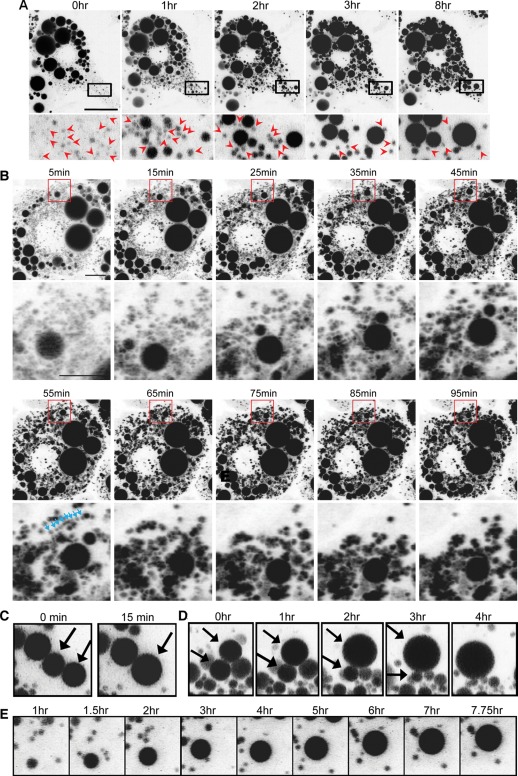
FIGURE 5:
Time-lapse imaging of macroLD formation reveals LD fusion and growth. (A, B) Volume-rendered z -stack confocal images of live 3T3-L1 adipocytes stained with Bodipy 493/503, activated with Isop for 30 ...
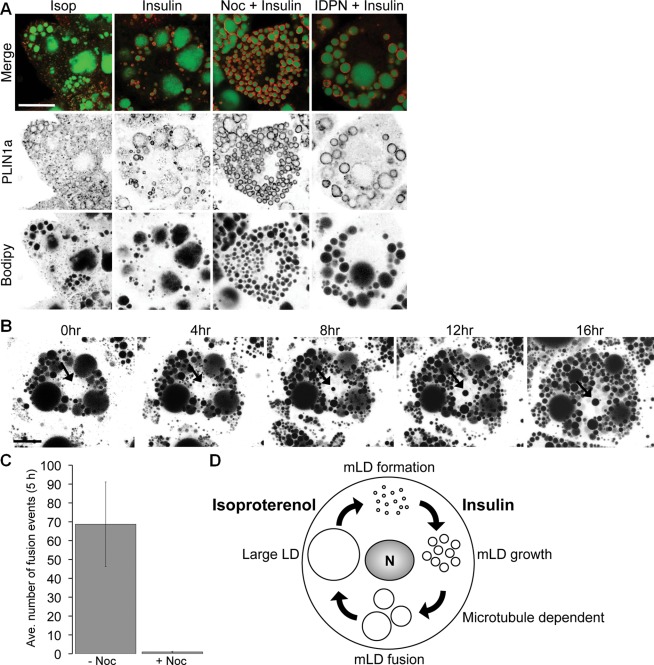
FIGURE 6:
MacroLD formation is microtubule dependent. (A) 3T3-L1 adipocytes were activated with Isop before incubation for 18 h with 100 nM insulin and 50u03bcg/ml oleic acid alone or in the presence of Noc (No...
Figure images are served from the NIH/NLM PubMed Central Open Access Subset or Europe PMC; copyright remains with the publishers and authors.
💬 Discussion
0 commentsNo comments yet. Be the first to start a discussion!
Leave a Comment