Abstract
The primary cilium is a central signaling hub in cell proliferation and differentiation and is built and disassembled every cell cycle in many animal cells. Disassembly is critically important, as misregulation or delay of cilia loss leads to cell cycle defects. The physical means by which cilia are lost are poorly understood but are thought to involve resorption of ciliary components into the cell body. To investigate cilium loss in mammalian cells, we used live-cell imaging to comprehensively characterize individual events. The predominant mode of cilium loss was rapid deciliation, in which the membrane and axoneme of the cilium was shed from the cell. Gradual resorption was also observed, as well as events in which a period of gradual resorption was followed by rapid deciliation. Deciliation resulted in intact shed cilia that could be recovered from culture medium and contained both membrane and axoneme proteins. We modulated levels of katanin and intracellular calcium, two putative regulators of deciliation, and found that excess katanin promotes cilia loss by deciliation, independently of calcium. Together, these results suggest that mammalian ciliary loss involves a tunable decision between deciliation and resorption.
🔬 Techniques
🔭 Microscopes
💻 Software
✨ Fluorophores
🧪 Sample Preparation
🔬 Cell Lines
🏭 Microscope Brands
🧪 Reagent Suppliers
🔎 Objectives
💻 Software Details
💻 Code & Software
💾 Data Repositories
🏛️ Research Organizations (ROR)
Affiliated research institutions:
📋 Methods
Cell culture
IMCD3 cells were grown in DMEM-F12 medium with 10% fetal bovine serum and 1% penicillin-streptomycin-kanamycin antibiotic cocktail at normoxic conditions. Cells were passaged every 2–3 days at a dilution of 1:10–1:20. Cells were tested for mycoplasma with Sigma LookOut Mycoplasma PCR Detection Kit (Cat# MP0035) as directed by the manufacturer, and incidences of mycoplasma contamination were treated with Mycoplasma Removal Agent (MP Biomedicals, #093050044). Following decontamination, experiments that were potentially affected by mycoplasma contamination were repeated at least three times to determine any difference in results, and no significant differences were observed.
Serum starvation and stimulation
Cells were seeded in 24- or 6-well dishes with glass coverslips for imaging following fixation or 35 mm glass-bottomed MatTek dishes (#P35G-0-10-C) for live imaging. Cells were seeded in 24-well dishes at a density of 1.5 x 10 4 cells and 6-well and 35 mm MatTek dishes at 1–1.5 x 10 5 to achieve 50%–70% confluence next day. For serum starvation, cells were washed once with 0.2% DMEM-F12 + PSK, then grown in 0.2% DMEM-F12 + PSK for 24 hrs. Serum stimulation was by either readdition of FBS directly to dishes to 10% final concentration or replacement with 10% FBS DMEM-F12.
Antibodies
The following antibodies and dilutions were used: acetylated tubulin mouse monoclonal 6-11B-1 (1:1,000 for IF and WB) (Sigma-Aldrich Cat# T7451); pericentrin rabbit polyclonal Poly19237 (1:500 for IF) (Covance Cat #PRB-432C, now BioLegend); Arl13b rabbit polyclonal (1:250–1:500 for IF) (Proteintech Cat# 17711-1-AP); N19-SSTR3 antibody (rabbit polyclonal) (Santa Cruz Cat #sc-11610, discontinued); IFT88 rabbit (1:500 for IF and WB) (GeneTex, Cat#79169); α-tubulin YL1/2 (1:1,000 for IF and WB), (ThermoFisher #MA1-080017); alpha-tubulin DM1a (1:1,000 for IF and WB) (ThermoFisher #62204); rabbit monoclonal anti-p60 EPR5071, (1:250 IF), (Abcam Cat# ab111881); rabbit polyclonal anti-KATNA1, (1:100–250 IF) (Proteintech Cat#17560-1-AP), anti-RPGRIP1L (Proteintech 55160-1-AP). Anti-rabbit GFP (1:250) (Life Technologies, #A11122); anti-mouse GFP (1:1,000) (Roche, #11063100). Secondary antibodies used were anti-mouse Rhodamine (1:1,000) (Jackson ImmunoResearch, #715-295-150); anti-rabbit FITC (1:1,000) (Jackson ImmunoResearch, #111-095-003); anti-rabbit Alexa647 (1:200) (Life Technologies, #A21245); anti-mouse Alexa647 (1:200) (Life Technologies, #A21236); Hoescht (1:1,000–2,000) (Molecular Probes, #H-3570). Chemicals Tubacin (Sigma-Aldrich, #SML0065) at 2 μM in DMSO; dibucaine hydrochloride (Sigma-Aldrich #285552) at 190 μM in DMSO. The following were used at 1 μM in DMSO: Cytochalasin D (Sigma-Aldrich #PHZ1063), Thapsigargin, (Sigma-Aldrich #T9033). BAPTA-AM (Sigma-Aldrich #A1076). Ionomycin 10-mM stock was a gift from the Rich Lewis Laboratory, Stanford University.
Show full methods section
Cell culture
IMCD3 cells were grown in DMEM-F12 medium with 10% fetal bovine serum and 1% penicillin-streptomycin-kanamycin antibiotic cocktail at normoxic conditions. Cells were passaged every 2–3 days at a dilution of 1:10–1:20. Cells were tested for mycoplasma with Sigma LookOut Mycoplasma PCR Detection Kit (Cat# MP0035) as directed by the manufacturer, and incidences of mycoplasma contamination were treated with Mycoplasma Removal Agent (MP Biomedicals, #093050044). Following decontamination, experiments that were potentially affected by mycoplasma contamination were repeated at least three times to determine any difference in results, and no significant differences were observed.
Serum starvation and stimulation
Cells were seeded in 24- or 6-well dishes with glass coverslips for imaging following fixation or 35 mm glass-bottomed MatTek dishes (#P35G-0-10-C) for live imaging. Cells were seeded in 24-well dishes at a density of 1.5 x 10 4 cells and 6-well and 35 mm MatTek dishes at 1–1.5 x 10 5 to achieve 50%–70% confluence next day. For serum starvation, cells were washed once with 0.2% DMEM-F12 + PSK, then grown in 0.2% DMEM-F12 + PSK for 24 hrs. Serum stimulation was by either readdition of FBS directly to dishes to 10% final concentration or replacement with 10% FBS DMEM-F12.
Antibodies
The following antibodies and dilutions were used: acetylated tubulin mouse monoclonal 6-11B-1 (1:1,000 for IF and WB) (Sigma-Aldrich Cat# T7451); pericentrin rabbit polyclonal Poly19237 (1:500 for IF) (Covance Cat #PRB-432C, now BioLegend); Arl13b rabbit polyclonal (1:250–1:500 for IF) (Proteintech Cat# 17711-1-AP); N19-SSTR3 antibody (rabbit polyclonal) (Santa Cruz Cat #sc-11610, discontinued); IFT88 rabbit (1:500 for IF and WB) (GeneTex, Cat#79169); α-tubulin YL1/2 (1:1,000 for IF and WB), (ThermoFisher #MA1-080017); alpha-tubulin DM1a (1:1,000 for IF and WB) (ThermoFisher #62204); rabbit monoclonal anti-p60 EPR5071, (1:250 IF), (Abcam Cat# ab111881); rabbit polyclonal anti-KATNA1, (1:100–250 IF) (Proteintech Cat#17560-1-AP), anti-RPGRIP1L (Proteintech 55160-1-AP). Anti-rabbit GFP (1:250) (Life Technologies, #A11122); anti-mouse GFP (1:1,000) (Roche, #11063100). Secondary antibodies used were anti-mouse Rhodamine (1:1,000) (Jackson ImmunoResearch, #715-295-150); anti-rabbit FITC (1:1,000) (Jackson ImmunoResearch, #111-095-003); anti-rabbit Alexa647 (1:200) (Life Technologies, #A21245); anti-mouse Alexa647 (1:200) (Life Technologies, #A21236); Hoescht (1:1,000–2,000) (Molecular Probes, #H-3570). Chemicals Tubacin (Sigma-Aldrich, #SML0065) at 2 μM in DMSO; dibucaine hydrochloride (Sigma-Aldrich #285552) at 190 μM in DMSO. The following were used at 1 μM in DMSO: Cytochalasin D (Sigma-Aldrich #PHZ1063), Thapsigargin, (Sigma-Aldrich #T9033). BAPTA-AM (Sigma-Aldrich #A1076). Ionomycin 10-mM stock was a gift from the Rich Lewis Laboratory, Stanford University.
Generation of stable cell lines
IMCD3-SSTR3::GFP-mCherry::PACT: mCherry::PACT was cloned from a pLV plasmid (pTS3488, created by multisite Gateway cloning by Christian Hoerner) onto a pLV-Puro-EF1a construct using Gibson cloning. Lentivirus with the cloned construct was generated in HEK293T and used to infect IMCD3-SSTR3::GFP (gift from Nachury laboratory, [ 55 ]) under selection with 800 ng/μL puromycin for 4–5 days. Infected cells were FACS sorted into polyclonal populations by mCherry fluorescence intensity, and a pool of low-expressing cells was selected to prevent overexpression phenotypes of a centrosomal protein.
Katanin expression constructs
Mammalian expression constructs for turboRFP and turboRFP::p60 (mKATNA1 [ NM_011835.2 ], build 37.2, Gene ID: 23924) were designed and ordered from VectorBuilder. All constructs were amplified by transformation in DH5α and maxi-prep (Qiagen #12165). IMCD3-SSTR3::GFP cells were transfected with each construct with ThermoFisher Lipofectamine 3000 according to manufacturer's protocol (#L3000015). The next day, cells were subjected to G418 selection (800 ng/μL for 5–6 days). Cells were sorted by FACS into low-, medium-, and high-expressing pools and maintained in DMEM-F12 10% FBS + PSK and 250 ng/μL G418 to maintain transgene expression. Transient transfection mCherry-α-tubulin mammalian expression construct (gift from Angela Barth) was transfected into IMCD3-SSTR3::GFP cells. Transfections were performed using Lipofectamine 3000 transfection reagent according to manufacturer’s protocol.
Immunofluorescence microscopy
Generally, fixation for immunofluorescence microscopy was done with 100% methanol for 5 minutes at −20°C, followed by washes with 0.1% Triton X-100 in PBS at room temperature for 2 minutes, and washed three times in PBS. Samples were blocked for 1 hr at RT or overnight at 4°C in 2% BSA, 1% goat serum, 75 mM NaN 3 . Antibodies were diluted to the indicated concentrations in blocking buffer. Primary antibody incubations were performed for 1 hr at RT or overnight at 4°C. Secondary antibody incubations were performed for 1–2 hrs at RT. Following each antibody incubation, samples were washed three times in PBS + 0.05% Tween-20 for 5 minutes each at RT. Images were acquired with a Zeiss Axiovert 200 inverted epifluorescence microscope and a 63x objective, or a Leica SP8 scanning laser confocal microscope with LASX Software, using mercury or argon lamps with white light laser excitation, and a 63x 1.4 NA objective. Exposure times were constant during each experiment. For imaging of serum-starved and serum-stimulated cells, fields of view were selected based on DAPI staining by two criteria: 1) to select for moderate cell density, in order to avoid effects of high density on cell cycle and ciliation and 2) to eliminate bias in percent cilia quantifications from scanning by ciliary markers.
Live-cell confocal microscopy
Cells were cultured on glass-bottomed Mattek dishes and imaged in DMEM-F12 media with 15 mM HEPES without phenol red. Movies were acquired 4–12 hrs after serum stimulation with a Leica SP8 scanning laser confocal microscope using 0.5-μm z-slices, 30–90-second intervals, autofocus (Best Focus function), in a 37°C incubator, and red and green channels were acquired simultaneously. The video file was saved as .lif from LASX software and opened in Imaris x64 8.0.2 as a 3D render for analysis of cilia disassembly dynamics and basal body positioning.
Data analysis
Cilia counts and length measurements were performed either manually in Fiji or Imaris x64 8.0.2 and 9.2.1 or through semiautomated detection in Imaris. Manual analysis involved detecting ciliary membrane, marked by an enrichment of SSTR3::GFP above background threshold, that were adjacent to a centriole (mCherry::PACT in dual-fluorescent cells or pericentrin immunofluorescence in single [SSTR3::GFP-expressing] or nonfluorescent cells), to distinguish from accumulations of SSTR3+ membrane elsewhere in the cell. Manual length measurements in Fiji [ 108 ] were made with the line function, and in Imaris (Bitplane, version 8.0.2 and up) with the Measurement tool. Generally, single z-plane images were analyzed in Fiji or Imaris, while confocal z-stacks were analyzed in Imaris which allowed more accurate length measurement due to the 3D render (Surpass) capability. When possible, length measurements in confocal images were semi-automated in Imaris using the Surfaces function to create an artificial object encompassing the ciliary membrane, and exporting Bounding Box data as a proxy for length (the longest dimension of the object). For live cell serum stimulation experiments, movies were visually scanned in Imaris for examples of disassembling cilia. Images of each disassembling cilium were cropped by time (from t0 to several mins after complete loss) and position (restricted to area of occupancy during the that time window) and then saved in a separate file. To generate ciliary length curves, the ciliary membrane was isolated as an artificial object using the Surface function. When possible, the object was automatically tracked over consecutive time points with length data generated at each time point. In cases where automatic tracking was not possible due to low signal-to-noise of ciliary membrane fluorescence, measurements were taken manually at 15–30 minute intervals until the initiation of ciliary disassembly, and at each time point during the disassembly event. Matlab Raw length measurement data from disassembling cilia movies were compiled into an Excel spreadsheet. The data were imported into a Matlab algorithm which performed Gaussian smoothing using a moving average and normalization to starved control cilia dataset. The start point of the cilium loss event was defined by scanning backwards from the final point (time at which length = 0 μm) until the derivative (length difference between consecutive time points) is not different in magnitude than the mean control slope (−0.005 μm/min). Based on this start point, each cilium loss event was categorized as follows: as follows: Gradual if the start point was earlier than the penultimate time point (T final-1 ); Instant if the length at the penultimate time point was above 1.532 μm (threshold based on measurement error); and Combined if both criteria are true. An output file containing disassembly rates, start and end time, start and end length, and proportion length lost per disassembly stage was generated for all cilium loss events. Full annotated script is available on Github: https://github.com/mmirvis/Mirvis-et-al.-2019-PLOS-Biol .
Cilia isolation
Cell culture: clones of IMCD3 cells, either unsorted and stably expressing GFP-SSTR3 or FACS-sorted for medium expression of GFP-SSTR3, were grown on 15-cm dishes at 3 x 10 6 cells/dish in DMEM/F12 with 10% FBS and antibiotics for 24 hrs. The cells were washed 3x with HDF wash buffer (136 mM NaCl, 5 mM KCl, 5 mM glucose, 4 mM NaHCO 3 , 0.7 mM EDTA), and medium was replaced with DMEM/F12 and 0.2% FBS and antibiotics (serum-starved) for 24 hrs. Then, all dishes were washed 3x with HDF buffer and half received phenol-red free DMEM/F12 with 0.2% FBS (serum-starved), and the other half received phenol red free DMEM/F12 with 10% FBS (serum-stimulated) for 24 hrs. Total serum starved time was 48 hrs and total serum stimulated time was 24 hrs.
Immune-capture method
Preparation of antibody-immobilized imaging dishes: glass in 35-mm glass-bottomed imaging dishes (MatTek) was functionalized by plasma cleaning at 250 moor, low setting, 45–60 seconds. Dishes were silanized with 500 μL of 2.5% triethoxysilyl-undecanal (TESU) in 100% ethanol, covered with Parafilm and incubated at RT for 1hr. Dishes were washed 3x with 100% ethanol, then baked at 85°C for 3 hrs. Next, silanized dishes were treated with the following series of reagents for 1hr at RT unless stated otherwise, with three PBS washes in between steps: 1) 50 mM NHS-LC- LC-biotin in water, 2) 5mg/ml neutravidin for 1hr at RT, 3) 300 μg/ml biotin-Protein A 4) block with 15 mM D-biotin in DMSO for 30 minutes, 5) anti-rabbit SSTR3 N19 (extracellular N-terminus) antibody (100–200 μg/mL) at 37°C, followed by one PBS wash. These protocols adapted from Dr. Nicholas Borghi [ 109 ].
Sample preparation
Culture medium was collected and subjected to centrifugation for 10 minutes at 1,000 x g at 4°C to remove large cell debris. Samples were then kept on ice until plating on treated dishes or stored at 4°C for a maximum of 1 day. 4 mL serum-stimulated or -starved medium was incubated on a treated MatTek dish overnight at 4°C, followed by three gentle PBS washes. Samples were then imaged directly, without fixation with a Leica SP8 confocal microscope. SEM Antibody-immobilized MatTek dishes incubated with serum stimulation medium were fixed for SEM in 4% PFA, 2% glutaraldehyde, and 0.1M Na cacodylate. Glass bottoms were removed, processed for imaging, and imaged with a Hitachi S-3400N VP SEM scope in the Beckman Imaging Facility, Stanford University.
Filter-spin concentration method
Harvest of cilia: Deciliation of starved IMCD3 cells (positive control): Serum-stimulated or -starved culture medium, or fresh culture medium (with 10% FBS, an additional control) was removed from six 150-cm dishes, combined, and centrifuged at 1,000 x g at 4°C for 10 minutes in the A-4-81 rotor, Eppendorf 5810R centrifuge to remove large cellular debris. Cells were washed two times with warm PBS containing 0.4% EDTA. 10 mL was added to a MatTek dish and incubated for 10 minutes at 37°C, followed by gentle up and down pipetting to remove cells from dish. An aliquot of cell suspension was removed for cell count. Cells were centrifuged at 13,000 x g for 5 minutes at RT. The cell pellet was resuspended in 5 mL ice cold deciliation buffer (62) (112 mM NaCl, 3.4 mM KCl,10 mM CaCl2, 2.4 mM NaHcO3, 2 mM HEPES, pH7.0, and a protease inhibitor tablet [Roche]). The cell suspension was incubated at 4°C for 15 minutes with end-over-end rotation, and then centrifuged at 1,000 x g for 5 mins at 4°C in an Eppendorf centrifuge. The resulting supernatant was used for biochemistry and immunostaining. Biochemistry Half of the supernatant material from deciliated, serum-starved or -stimulated cells was centrifuged at 21,000 x g for 15 minutes in JA25.5 rotor in Beckman Coulter Avanti J-25I centrifuge at 4°C. The supernatant was carefully removed, and pellets were resuspended in 160 μl of sample buffer (1% SDS, 10 mM Tris-HCl, pH 7.5, 2 mM EDTA). Samples were boiled at 95°C for 8 mins, and equal volumes were separated by 10% PAGE and transferred to PVDF. Blots were blocked (2% BSA, 1% normal donkey and goat serum in TBS, pH 7.4) for 1 hr at RT or overnight at 4°C. Membranes were blotted with YL1/2 (1:1,000), mouse acetylated-tubulin antibody (1:1,000), and IFT88 rabbit antibody (1:500) in blocking buffer for 1 hr at RT. Blots were washed 5x with TBST. Secondary anti-rabbit, anti-mouse, or anti-rat antibodies labeled with either IRDye680CW or IRDye800CW (Li-Cor Biosciences, #926–32213), at 1:30,000 dilution were incubated with blots for 30 minutes at RT. Blots were washed five times with TBST and scanned on Licor Odyssey scanner (Li-Cor BioSciences).
Immunofluorescence
Half of the supernatant material from deciliated, serum-starved, and serum-stimulated cells was concentrated using a 250 ml 0.2 μm PES filter unit with low-power house vacuum to reduce the volume (20 or 40 mL from one or two 15-cm dishes, respectively) to 2 mL, and finally a Millipore Ultrafree-MC filter (PVDF 0.2 μm size #UFC30GV100) to reduce the volume to approximately 0.5 mL. 5 μl of concentrated supernatant was pipetted onto an acid-treated glass slide. A 22-mm acid-treated circular glass coverslip was placed on the sample, and the slide was immediately plunged into liquid nitrogen for approximately 5 seconds. After removing the slide, the coverslip was removed and fixed in −20°C 100% methanol for 5 minutes. Alternatively, 400 μm of the sample were loaded into an 8-well glass-bottomed LabTek dish (Sigma-Aldrich, # Z734853), and centrifuged at 3,500 x g for 20 minutes, 4°C. Immunofluorescence staining was performed as described above.
Statistics
All analyses were performed in GraphPad Prism. Statistical tests used for each analysis are indicated in the figure legends. No explicit power analysis was used to determine sample size. All experiments were performed with at least three biological replicates, i.e., samples from independent cell culture passages. When used, technical replicates (i.e., repeats from the same cell culture passage) were averaged for each biological replicate. In brief, comparisons of mean values such as mean percent cilia across replicate experiments were compared using an unpaired t test. Analyses of individual measurements such as cilia length were subjected to normality tests (Kolmogorov–Smirnoff, D’Agostino and Pearson, and Shapiro–Wilk). If data passed all normality tests, unpaired t test was used; if not, the Mann–Whitney U test was used. If data passed normality by some tests but not others, both types of analyses were performed. Results were similar between parametric and nonparamentric tests unless stated otherwise.
Immune-capture method
Preparation of antibody-immobilized imaging dishes: glass in 35-mm glass-bottomed imaging dishes (MatTek) was functionalized by plasma cleaning at 250 moor, low setting, 45–60 seconds. Dishes were silanized with 500 μL of 2.5% triethoxysilyl-undecanal (TESU) in 100% ethanol, covered with Parafilm and incubated at RT for 1hr. Dishes were washed 3x with 100% ethanol, then baked at 85°C for 3 hrs. Next, silanized dishes were treated with the following series of reagents for 1hr at RT unless stated otherwise, with three PBS washes in between steps: 1) 50 mM NHS-LC- LC-biotin in water, 2) 5mg/ml neutravidin for 1hr at RT, 3) 300 μg/ml biotin-Protein A 4) block with 15 mM D-biotin in DMSO for 30 minutes, 5) anti-rabbit SSTR3 N19 (extracellular N-terminus) antibody (100–200 μg/mL) at 37°C, followed by one PBS wash. These protocols adapted from Dr. Nicholas Borghi [ 109 ].
Filter-spin concentration method
Harvest of cilia: Deciliation of starved IMCD3 cells (positive control): Serum-stimulated or -starved culture medium, or fresh culture medium (with 10% FBS, an additional control) was removed from six 150-cm dishes, combined, and centrifuged at 1,000 x g at 4°C for 10 minutes in the A-4-81 rotor, Eppendorf 5810R centrifuge to remove large cellular debris. Cells were washed two times with warm PBS containing 0.4% EDTA. 10 mL was added to a MatTek dish and incubated for 10 minutes at 37°C, followed by gentle up and down pipetting to remove cells from dish. An aliquot of cell suspension was removed for cell count. Cells were centrifuged at 13,000 x g for 5 minutes at RT. The cell pellet was resuspended in 5 mL ice cold deciliation buffer (62) (112 mM NaCl, 3.4 mM KCl,10 mM CaCl2, 2.4 mM NaHcO3, 2 mM HEPES, pH7.0, and a protease inhibitor tablet [Roche]). The cell suspension was incubated at 4°C for 15 minutes with end-over-end rotation, and then centrifuged at 1,000 x g for 5 mins at 4°C in an Eppendorf centrifuge. The resulting supernatant was used for biochemistry and immunostaining.
Supporting information S1 Fig Characterization of immunostained serum-stimulated cells. A) Serum-starved and stimulated cells were immunostained for PCNT to mark the basal body (white) and acTub to mark the axoneme (red). Scale bar = 10 μm. Nuclei and cell boundaries are outlined in yellow. B) Serum stimulation is accompanied by an increase in mitotic cells, inhibited by tubacin treatment. Quantifications are based on means of three independent experiments, with 150–200 cells analyzed per condition per replicate. Error bars = SEM. Source data can be found in supplementary data file S1 Data . acTub, acetylated tubulin; PCNT, pericentrin. (TIF) Click here for additional data file. S2 Fig Schematized workflow for automated analysis of ciliary disassembly dynamics. A) 10 control nondisassembling cilia from starved cells were imaged at 90-second intervals over a 12-hr period and analyzed. Cumulative metrics are shown here (μm). Slight changes in length and stochastic length fluctuations are inherently present, and used as a baseline for analysis of disassembling cilia. Marked in yellow—maximum standard deviation of length is used as a proxy for length measurement error and is thus used as a threshold length for Instant disassembly; average slope of best fit line represents background decline in length over 12-hr imaging period. B) Matlab workflow. Scale bar = 5 μm. Raw data are run through a smoothing function. Derivatives are calculated, then normalized to background reduction (A) to identify start point of disassembly event. Lastly, disassembly behaviors (Gradual, Instant, and Combined) are assigned as described in the text and Materials and methods. Source data can be found in supplementary data file S2 Data . Matlab script available at https://github.com/mmirvis/Mirvis-et-al.-2019-PLOS-Biol . (TIF) Click here for additional data file. S3 Fig Dynamics of dibucaine-induced ciliary shedding are consistent with serum-induced Instant disassembly. Starved cells were treated with 190 μm dibucaine and imaged by confocal microscopy at 30-second intervals. A) Still images from a representative ciliary shedding show complete ciliary loss in under 30 seconds. B) Length measurements from A show Instant disassembly dynamics. Source data can be found in supplementary data file S2 Data . (TIF) Click here for additional data file. S4 Fig Schematics of cilia capture methods. A) Immune capture of shed cilia. Medium from serum stimulated cells is incubated on an imaging dish bearing immobilized antibody against the SSTR3 membrane marker. B–C) Filter-spin concentration of shed cilia. B) Medium from serum-stimulated cells is concentrated either by centrifugation pelleting for subsequent western blot or by vacuum and centrifugation filtration for immunofluorescence. Medium from cells subjected to artificial deciliation (serum-starved cells treated with high calcium buffer) was included as a positive control. C) Visualization of concentrated cilia, showing native SSTR3::GFP fluorescence, immunofluorescence against acetylated tubulin, and DAPI staining. Scale bar = 20 μm. SSTR3, somatostatin receptor 3 (TIF) Click here for additional data file. S5 Fig tRFP-p60 overexpression reduces cytoplasmic acTub intensity but does not impair overall serum-induced ciliary disassembly. A) Localization of p60 in tRFP- and tRFP-p60–overexpressing cells SSTR3::GFP native fluorescence (green), turboRFP native fluorescence (red), total p60 immunofluorescence (white), and merge with DAPI staining. Scale bar = 20 μm. B) Quantification of total p60 immunofluorescence intensity from maximum intensity projections of confocal z-stacks. Data from three independent experiments, 30–50 cells per experiment. Statistical significance calculated by unpaired t test. C) Starved and 2-hr–stimulated tRFP and tRFP-p60 cells were fixed and stained for acTub (red, center column). Scale bar = 20 μm. Insets show acTub channel alone. Inset scale bar = 10 μm. D) Quantification of A). Mean cellular acTub intensity was normalized to cellular tRFP intensity. Data pooled from three independent experiments, 80–100 cells per condition.
Statistical significance from Mann–Whitney
U test. E) Western blot against α-tubulin (DM1α, top green) and acTub (bottom, red). F) Quantification of band intensity of (E), normalized to tRFP. Three independent experiments, statistical significance by unpaired t test. G) Serum-starved cells pretreated with DMSO, 2 μM Tubacin, or 1μM CytoD were serum stimulated (6 hrs). Proportion of ciliated cells was calculated by normalizing to Starved + DMSO for each cell line (dotted line). N = 3 experiments. Source data can be found in supplementary data file S4 Data . acTub, acetylated tubulin; SSTR3, somatostatin receptor 3; tRFP, turbo red fluorescent protein. (TIF) Click here for additional data file. S6 Fig tRFP and tRFP-p60 cells exhibit similar responses to elevated [Ca2+]i by ionomycin and dibucaine but not to thapsigargin. tRFP and tRFP-p60 cells were starved and pretreated with DMSO, A–B) 190 μM dibucaine (30 m), 1 μM ionomycin (30 minutes), and C–D) 5 μM Thps (1 hr). All experiments, including BAPTA-AM studies in Fig 4 , were performed in parallel and use the same values for DMSO controls. A and C) Cilia counts are from fixed populations and normalized to respective DMSO controls. Statistical significance was determined by unpaired t test. B and D) Length measurements from confocal z-stacks of live cells, taken in three dimensions using Imaris. Statistical significance was determined by Mann–Whitney U test for non-normal distribution. Data from at least three independent experiments. Source data can be found in supplementary data file S4 Data . Thps, thapsigargin; tRFP, turbo red fluorescent protein. (TIF) Click here for additional data file. S1 Movie Primary cilium of a serum-starved cell. Imaged at 90-second intervals over 12 hrs, 45 fps. The cilium undergoes rapid length fluctuations and a slight overall reduction in length at 0.003 μm/min. See Fig 2A.1 . (MP4) Click here for additional data file. S2 Movie Primary cilium loss by Gradual dynamics. Imaged at 90-second intervals, 45 fps. Cilium disassembles with an overall rate of 0.016 μm/min. See Fig 2A.2 . (MP4) Click here for additional data file. S3 Movie Primary cilium loss by Instant dynamics. Imaged at 90-second intervals, 15 fps. Cilium is lost in under 90 seconds, approximate minimum rate of 4.72 μm/min. See Fig 2A.3 . (MP4) Click here for additional data file. S4 Movie Primary cilium loss by Combined dynamics. Imaged at 46-second intervals, 25 fps. Cilium undergoes Gradual shortening (0.029 μm/min), followed by Instant loss (>5.69 μm/min). See Fig 2A.4 . (MP4) Click here for additional data file. S5 Movie Primary cilium shedding. Imaged at 54 second intervals. Ciliary membrane is released from cell surface (27:12–29:00). See Fig 3A . (MP4) Click here for additional data file. S6 Movie Primary cilium shedding. Top view of S5 Video. (MP4) Click here for additional data file.
S1 Data
Mean percentages of ciliated cells, mitotic cells, and non-canonical ciliary structures in response to serum stimulation in fixed IMCD3 cells. Data corresponding with Fig 1 and S1B Fig . (XLSX) Click here for additional data file.
S2 Data
Analysis of live cell ciliary disassembly dynamics, including raw data from individual cilia, and results of MATLAB analysis. Data corresponding with Fig 2 , S2 Fig and S3B Fig . (XLSX) Click here for additional data file.
S3 Data
Quantification of cilia isolated by immune capture. Data corresponding with Fig 3D . (XLSX) Click here for additional data file.
S4 Data
Effects of katanin and calcium modulation on ciliary structure and behavior, including characterization of tRFP-p60 overexpression and ciliary disassembly dynamics, and results of calcium drug experiments. Data corresponding with Fig 4 , S5 Fig and S6 Fig . (XLSX) Click here for additional data file.
📊 Figures
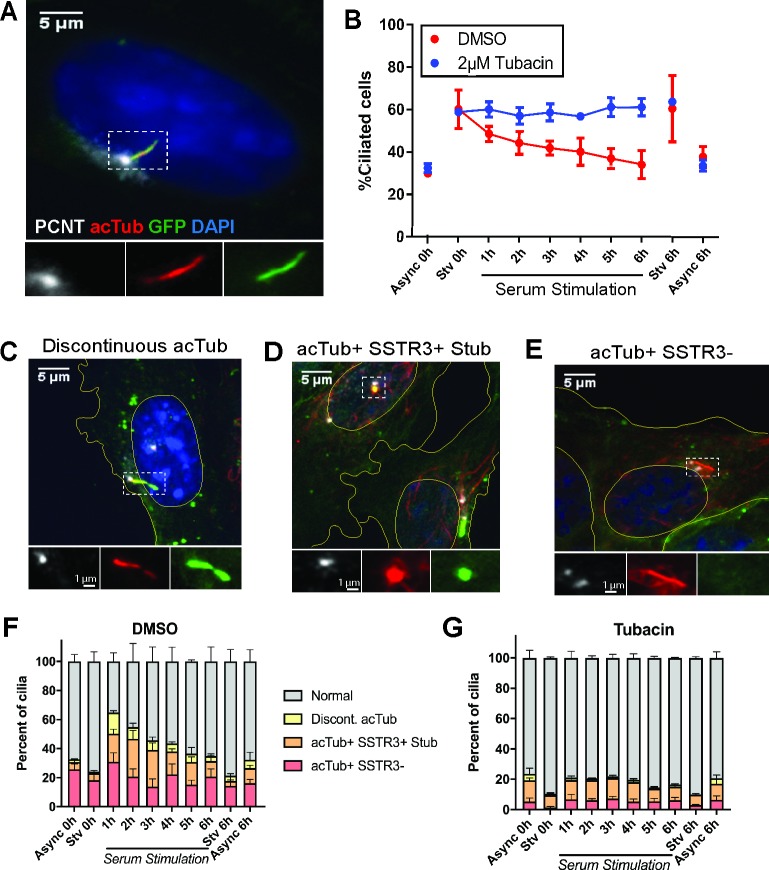
Fig 1
Serum stimulation of IMCD3 cells reveals noncanonical ciliary structures.
IMCD3-SSTR3::GFP cells were serum starved for 24 hrs, followed by stimulation with 10% serum in order to synchronize ciliary loss. A, Cu2013E) Cells were fixed at indicated time points after serum add...
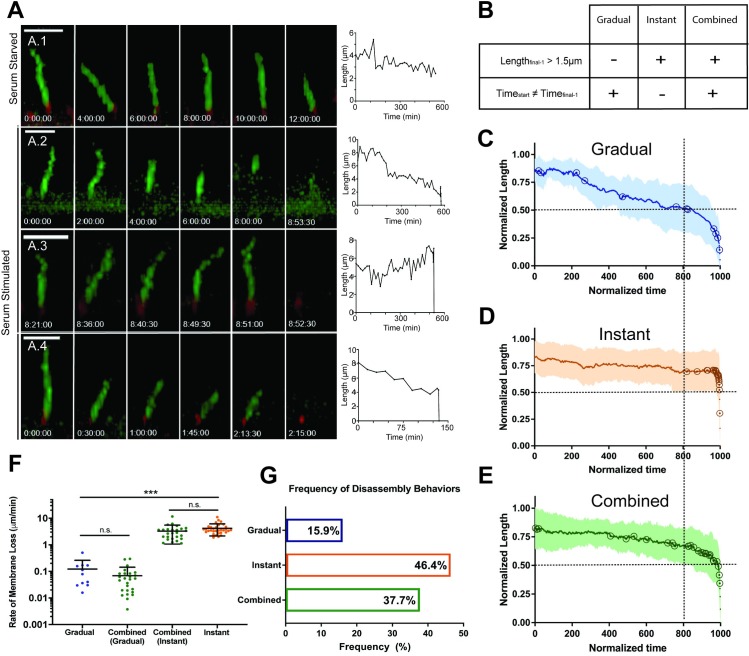
Fig 2
Live-cell analysis of ciliary loss reveal highly heterogeneous dynamics.
A) Still images and raw length curves representing dynamics of individual cilia-loss events. Length measurements based on SSTR3::GFP fluorescence. Scale bar = 5 u03bcm. A.1) Control serum starved cili...
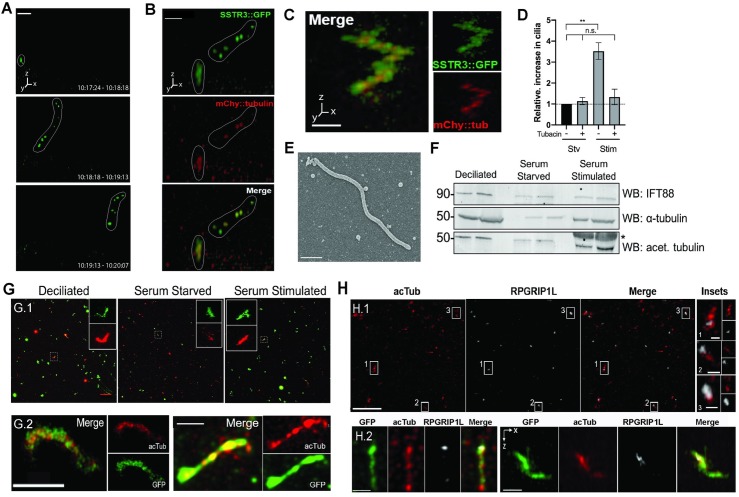
Fig 3
Observation and validation of whole-cilium shedding.
A) Serum-stimulated cell, imaged at 54-second intervals. A short ciliary membrane (in white outline) is visibly shed from the cell surface. Time labels are intervals of stack acquisition. Scale bar = ...
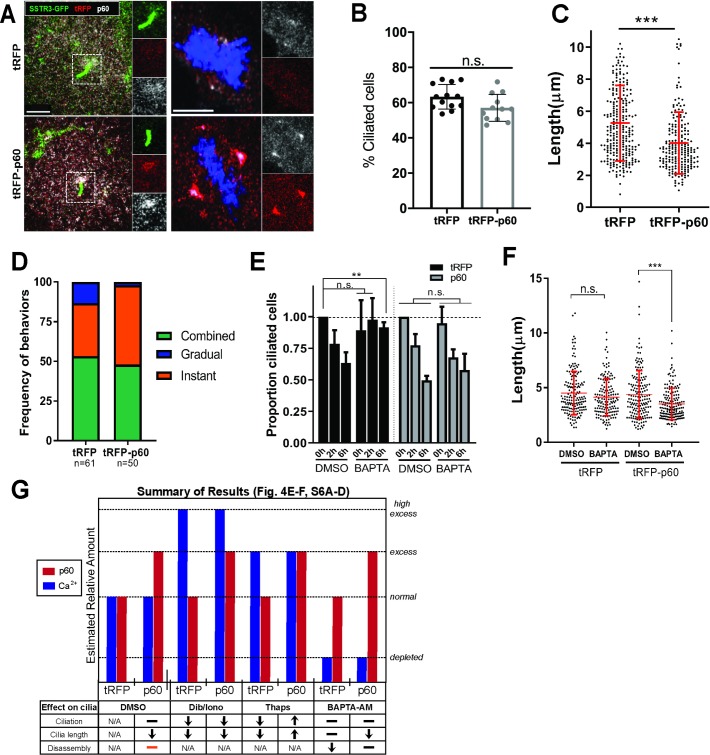
Fig 4
tRFP-p60 overexpression reduces ciliary length, promotes Instant loss, and counteracts effects of [Ca 2+ ] i modulation on cilia.
Au2013D) IMCD3-SSTR3::GFP cells stably expressing tRFP or tRFP-p60 fusion. A) Localization of p60 to ciliary base and spindle poles in tRFP and p60 cells immunostained with a polyclonal antibody again...
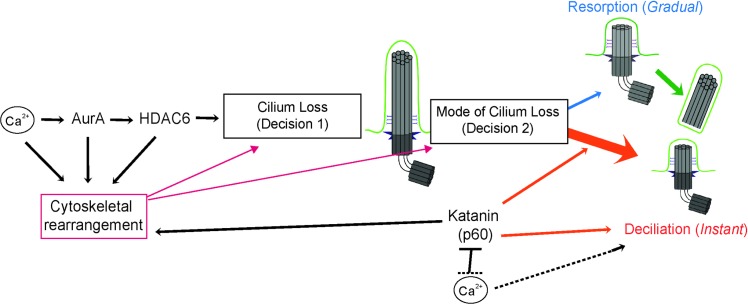
Fig 5
Model for regulation of ciliary disassembly.
Major regulators of ciliary disassembly function at two decision points: whether (Decision 1) and how (Decision 2) to disassemble the cilium, which is dominated by deciliation (orange) but also featur...
Figure images are served from the NIH/NLM PubMed Central Open Access Subset or Europe PMC; copyright remains with the publishers and authors.
💬 Discussion
0 commentsNo comments yet. Be the first to start a discussion!
Leave a Comment