Abstract
Most cancer cells accumulate genomic abnormalities at a remarkably rapid rate, as they are unable to maintain their chromosome structure and number. Excessively short telomeres, a known source of chromosome instability, are observed in early human-cancer lesions. Besides telomere dysfunction, it has been suggested that a transient phase of polyploidization, in most cases tetraploidization, has a causative role in cancer. Proliferation of tetraploids can gradually generate subtetraploid lineages of unstable cells that might fire the carcinogenic process by promoting further aneuploidy and genomic instability. Given the significance of telomere dysfunction and tetraploidy in the early stages of carcinogenesis, we investigated whether there is a connection between these two important promoters of chromosomal instability. We report that human mammary epithelial cells exhibiting progressive telomere dysfunction, in a pRb deficient and wild-type p53 background, fail to complete the cytoplasmatic cell division due to the persistence of chromatin bridges in the midzone. Flow cytometry together with fluorescence in situ hybridization demonstrated an accumulation of binucleated polyploid cells upon serial passaging cells. Restoration of telomere function through hTERT transduction, which lessens the formation of anaphase bridges by recapping the chromosome ends, rescued the polyploid phenotype. Live-cell imaging revealed that these polyploid cells emerged after abortive cytokinesis due to the persistence of anaphase bridges with large intervening chromatin in the cleavage plane. In agreement with a primary role of anaphase bridge intermediates in the polyploidization process, treatment of HMEC-hTERT cells with bleomycin, which produces chromatin bridges through illegimitate repair, resulted in tetraploid binucleated cells. Taken together, we demonstrate that human epithelial cells exhibiting physiological telomere dysfunction engender tetraploid cells through interference of anaphase bridges with the completion of cytokinesis. These observations shed light on the mechanisms operating during the initial stages of human carcinogenesis, as they provide a link between progressive telomere dysfunction and tetraploidy.
🔬 Techniques
🔭 Microscopes
🧬 Organisms
💻 Software
✨ Fluorophores
🧪 Sample Preparation
🔬 Cell Lines
🏭 Microscope Brands
🧪 Reagent Suppliers
🔎 Objectives
💻 Software Details
🏛️ Research Organizations (ROR)
Affiliated research institutions:
📋 Methods
Cells and culture conditions
HMECs were derived from normal breast tissue from two independent donors and were purchased from BioWhittaker (Walkersville, MD) and Cell Applications Inc. (San Diego, CA). Cells were cultured in a Human Mammary Epithelial Cell Growth Medium Kit (Cell Applications) at a temperature of 37°C in a 5% CO 2 atmosphere. The number of accumulated PDs per passage was determined using the equation PD = PD initial+log (n° viable cells harvested/n° viable cells plated)/log2.
Lentiviral transduction with hTERT and TRAP assay HMECs at early
PDs were transduced with viral particles containing LV.hTERT, a lentivirus construct provided by the Viral Vector Facility (CNIC; Spain), in the presence of 4 µg/ml Polybrene (Sigma-Aldrich; St. Louis, MO). After 24 h post-transduction, medium was replaced and cells were incubated at 37°C and 5% of CO 2 atmosphere. The number of accumulated PDs after transduction was calculated according to the equation described previously. To evaluate telomerase activity, protein extracts were prepared from transduced and control cells. They were washed twice with PBS1X and lysed with 1× CHAPS Lysis Buffer (TRAPEZE Gel-Based Telomerase Detection Kit, Millipore; Billerica, MA). Protein concentration was measured with a spectrophotometer (NanoDrop 2000, Thermo Fisher Scientific; Waltham, MA). Briefly, telomere repeat amplification protocol (TRAP) assay is based on the addition of telomeric repeats to the 3′ end of a synthetic primer by telomerase, if present. In a second step, the extended products are amplified by PCR. Then, samples are mixed with 1× loading dye and resolved in a 12% non-denaturing PAGE in 0.5× TBE buffer. Gel was stained with SYBR Safe DNA gel stain (Invitrogen, Life Technologies; Carlsbad, CA) for 30–45 minutes and images were obtained using a transilluminator. A non-template control, heat-inactivated samples and cell lysates from telomerase positive cells were included as controls.
Show full methods section
Cells and culture conditions
HMECs were derived from normal breast tissue from two independent donors and were purchased from BioWhittaker (Walkersville, MD) and Cell Applications Inc. (San Diego, CA). Cells were cultured in a Human Mammary Epithelial Cell Growth Medium Kit (Cell Applications) at a temperature of 37°C in a 5% CO 2 atmosphere. The number of accumulated PDs per passage was determined using the equation PD = PD initial+log (n° viable cells harvested/n° viable cells plated)/log2.
Lentiviral transduction with hTERT and TRAP assay HMECs at early
PDs were transduced with viral particles containing LV.hTERT, a lentivirus construct provided by the Viral Vector Facility (CNIC; Spain), in the presence of 4 µg/ml Polybrene (Sigma-Aldrich; St. Louis, MO). After 24 h post-transduction, medium was replaced and cells were incubated at 37°C and 5% of CO 2 atmosphere. The number of accumulated PDs after transduction was calculated according to the equation described previously. To evaluate telomerase activity, protein extracts were prepared from transduced and control cells. They were washed twice with PBS1X and lysed with 1× CHAPS Lysis Buffer (TRAPEZE Gel-Based Telomerase Detection Kit, Millipore; Billerica, MA). Protein concentration was measured with a spectrophotometer (NanoDrop 2000, Thermo Fisher Scientific; Waltham, MA). Briefly, telomere repeat amplification protocol (TRAP) assay is based on the addition of telomeric repeats to the 3′ end of a synthetic primer by telomerase, if present. In a second step, the extended products are amplified by PCR. Then, samples are mixed with 1× loading dye and resolved in a 12% non-denaturing PAGE in 0.5× TBE buffer. Gel was stained with SYBR Safe DNA gel stain (Invitrogen, Life Technologies; Carlsbad, CA) for 30–45 minutes and images were obtained using a transilluminator. A non-template control, heat-inactivated samples and cell lysates from telomerase positive cells were included as controls.
Fluorescence in situ hybridization
(FISH), immuno–FISH, and cell staining PNA–FISH Metaphase chromosome preparations were obtained by means of treatment with colcemid 0.02 µg/ml for 8 hours, followed by hypotonic shock and methanol/acetic fixation. Cell suspensions were dropped onto clean slides, which were stored at −20°C. Centromeres and telomeres were labeled by means of PNA-FISH techniques using a Cy3-( CCCTAA ) 3 PNA-probe for telomeres and a FITC- AAACACTCTTTTTGTAGA PNA-probe for centromeres (PE Biosystems; Foster City, CA), as previously described [50] . For evaluation of telomere dysfunction, metaphase karyotyping was performed by reverse DAPI staining, which results in a reproducible G band-like pattern that allows individual chromosomes to be identified accurately. Thereafter, pantelomeric probes allowed us to determine the chromosome arms that had signal-free telomeres (SFT). The SFT rate was obtained by dividing the number of chromosome arms without a telomere signal by the number of scored metaphases at each PD analyzed. Immuno–FISH HMECs seeded in chamber slides were grown until 70% confluence was reached. Fixation was carried out with cold methanol for 10 minutes. Cells were then permeabilized in 1×PBS-1%TritonX100 solution. The blocking step was carried out with 1×PBS-0.1%Tween20-2%Fetal Calf Serum for 1 hour at 37°C. Primary antibodies against microtubules (mouse anti alpha and beta-tubulin; Sigma-Aldrich) were diluted with blocking solution at a final concentration of 1∶500. Secondary antibody was anti-mouse Alexa-488 (1∶500; Molecular Probes, Life Technologies). Three rounds of washes with blocking solution were performed after each antibody incubation. The FISH protocol was then applied using a mixture of centromeric DNA probes specific for chromosomes 4 (CEP4; SpAqua) and 18 (CEP18; SpGreen) (Abbott Laboratories. Inc.; Downers Grove, IL), as previously described [21] . Texas Red-X phalloidin staining Texas Red-X phalloidin staining (Invitrogen) was diluted with blocking solution at a final concentration of 1.5 U/ml. Finally, all slides were dehydrated and mounted in antifade solution containing 0.125 µg/ml 4′,6-diamidino-2-phenylindole (DAPI) in antifade solution before proceeding to the microscopic analysis. Fluorescent signals were visualized under an Olympus BX60F5 epifluorescent microscope equipped with epifluorescent optics specific for each fluorochrome. Capture and analysis was carried out with the Cytovision platform (Genetix; UK).
Flow cytometry and cell sorting Sub-confluent
HMECs were collected and fixed with ethanol 70% and kept at −20°C until analysis. Permeabilization was performed with 1×PBS-1%TritonX100 solution. The primary antibody rabbit anti-cyclin D1 (1∶100; Abcam; UK) and anti-rabbit Alexa-488 (1∶500; Molecular Probes) were applied using standard procedures that have been previously described [51] . Before acquiring the samples, they were counterstained with 0.5% Propidium Iodide (PI; 1 mg/ml) in 1×PBS-0.1%TritonX100 containing 0.2 mg/ml RNAase A DNAase-free (Sigma-Aldrich). Cell-cycle analysis was performed in a FACSCalibur. In order to prevent the cytometer recording two different cells as one event, which would result in false polyploid HMECs, doublet cells were gated out using a width-FL2/area-FL2 plot. Artificially induced binucleated cells were collected and fixed with ethanol 60%, stained with PI, and sorted with FACSCantoII (BD Biosciences; Franklin Lakes, NJ). All results were analysed with the BDFacsDiva software (BD Biosciences).
Drug treatments
Double strand breaks were generated in HMEC-hTERT cells by the radiomimetic drug Bleocin (Calbiochem, Merck-Chemicals; Germany), a bleomycin compound, at a final concentration of 1.25 µg/ml. The drug was washed out after one hour, and cells were left recovering for 0, 6, 24, 48 and 72 hours. Cytochalasin B (Sigma-Aldrich) at a final concentration of 6 µg/ml was added to an asynchronously proliferating HMEC-hTERT culture. After 24 h, cells were collected and fixed in 60% ethanol and kept frozen until processed by FACS.
Transfection procedures and live-cell imaging
The day prior to transfection, HMECs were plated onto a 35-mm glass bottom dish (MatTek; Ashland, MA) at a density of 7300 cells/cm 2 .
Transfection procedures using a pEGFP-N1 plasmid encoding
H2B-GFP sequence (BD Biosciences) were performed using Fugene HD (Roche Diagnostics S.L.; Indianapolis, IN) according to manufacturer's instructions. Live-cell imaging was performed with a Leica TCS SP5 confocal microscope. Cells were visualized with a HCX PL APO CS 40.0×1.25 OIL UV objective using the 488 nm line from an argon laser. Mitotic cells were imaged in a 3× zoom using the software Leica LAS AF Lite (Leica Microsystems; Germany) for up to 5 hours, at 3-minute intervals. Acquisition settings were established to 10% laser power through a pinhole of 5 AU, a line average of 2, and a scan speed of 400 Hz to avoid excessive cellular damage. Throughout the whole process, cells were kept at 37°C and 5%CO 2 . To generate an immortal cell line expressing fluorescent H2B, HMEC-hTERT cells were transfected with the pEGFP-N1 plasmid encoding H2B-GFP, as described above and selected with the antibiotic Blasticidin (0.5 µg/ml; Sigma-Aldrich). Before imaging, H2B-GFP-HMEC-hTERT cells were treated with bleomycin in order to enrich the presence of anaphase bridges. Analysis was performed on an Olympus Fluoview 1000 confocal microscope, under the UPlansApo 60× objective. The Z-stacks were set with a step size of 1.5 µm. Images were acquired every 5 min. Cells were kept at 37°C and 5%CO 2 . Images were processed with ImageJ (WS Rasband, ImageJ, US National Institutes of Health, Bethesda, MD, http://imagej.nih.gov/ij/ , 1997–2011), Adobe Photoshop and Adobe After Effects software. Statistical analysis A Student t test was used to compare two groups of values; alternatively, a Mann-Whitney analysis was used when values did not follow a normal distribution. When 3 or more groups of data were contrasted, variance analysis for nonparametric measures (Kruscal-Wallis ANOVA) was performed. Specifically, a post-hoc Dunnett's test was applied to compare frequencies of anaphase bridges, binucleated cells and ploidy at the different timepoints analyzed. Correlation was calculated according to the Spearman rank correlation coefficient. A p value of less than 0.05 was considered significant.
Transfection procedures and live-cell imaging
The day prior to transfection, HMECs were plated onto a 35-mm glass bottom dish (MatTek; Ashland, MA) at a density of 7300 cells/cm 2 .
Transfection procedures using a pEGFP-N1 plasmid encoding
H2B-GFP sequence (BD Biosciences) were performed using Fugene HD (Roche Diagnostics S.L.; Indianapolis, IN) according to manufacturer's instructions. Live-cell imaging was performed with a Leica TCS SP5 confocal microscope. Cells were visualized with a HCX PL APO CS 40.0×1.25 OIL UV objective using the 488 nm line from an argon laser. Mitotic cells were imaged in a 3× zoom using the software Leica LAS AF Lite (Leica Microsystems; Germany) for up to 5 hours, at 3-minute intervals. Acquisition settings were established to 10% laser power through a pinhole of 5 AU, a line average of 2, and a scan speed of 400 Hz to avoid excessive cellular damage. Throughout the whole process, cells were kept at 37°C and 5%CO 2 . To generate an immortal cell line expressing fluorescent H2B, HMEC-hTERT cells were transfected with the pEGFP-N1 plasmid encoding H2B-GFP, as described above and selected with the antibiotic Blasticidin (0.5 µg/ml; Sigma-Aldrich). Before imaging, H2B-GFP-HMEC-hTERT cells were treated with bleomycin in order to enrich the presence of anaphase bridges. Analysis was performed on an Olympus Fluoview 1000 confocal microscope, under the UPlansApo 60× objective. The Z-stacks were set with a step size of 1.5 µm. Images were acquired every 5 min. Cells were kept at 37°C and 5%CO 2 . Images were processed with ImageJ (WS Rasband, ImageJ, US National Institutes of Health, Bethesda, MD, http://imagej.nih.gov/ij/ , 1997–2011), Adobe Photoshop and Adobe After Effects software.
Supporting Information Figure S1 DNA content exhibited by proliferating 830 HMECs. Flow cytometry analysis of DNA content of 830 HMECs stained with propidium iodide, at early and late PDs (upper panels). The percentage of cells with 4N and 8N DNA content is given. Bivariate analysis of DNA content and expression of cyclin D1 protein (lower panels), in which cyclin D1 positive cells are grouped depending on their ploidy level. (TIF) Click here for additional data file. Figure S2 Telomere and centromere detection in non-transduced and hTERT-transduced HMECs. (A) Metaphase spread of non-transduced HMECs at PD59 hybridized with FITC-pancentromeric (green) and Cy3-pantelomeric (red) PNA probes, DNA is counterstained with DAPI. The white arrowhead indicates signal-free telomere ends (SFT) while asterisks represent end-to-end fusion events. (B) Correlation between tetraploidization events (Y axis) and the corresponding levels of SFT ends (X axis) are shown. Dots represent values for both scored parameters at different PDs, from PD25 to PD59 in donor 219-7 (blue dots) and at PD25 and PD42 in donor 830 (red dots). (C) Chromosomes of an hTERT-transduced HMEC at PD45.9 where reduced telomere instability is observed. The white arrowhead indicates signal-free telomere ends (SFT), while asterisks represent end-to-end fusion events. (D) Metaphase-spread analysis of non-transduced HMECs revealed a high presence of tetraploid cells with conventional chromosomes, and (E) only a residual presence of metaphases with duplochromosomes was observed. (TIF) Click here for additional data file. Video S1 For the precise investigation of the process of tetraploidy development in HMECs with anaphase bridges, time-lapse imaging was performed. The video shows a HMEC-hTERT_BLEO cell expressing H2B-GFP with an over-strengthened chromatin bridge (highlighted circle) that persists unbroken and eventually leads to the formation of a binucleated cell. Total time between frames is 3 minutes; total recording time is 17.5 hours. (MPG) Click here for additional data file.
📊 Figures
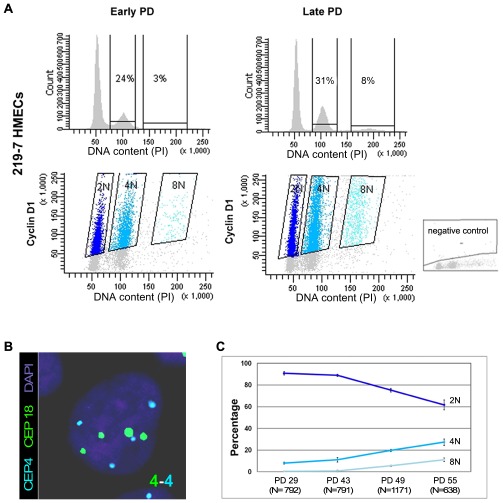
Figure 1
Replicative dependent polyploidization in HMECs.
(A) Flow cytometry analysis of DNA content of 219-7 HMECs stained with propidium iodide, at early and late culture PDs (upper panels). The percentage of cells with 4N and 8N DNA content is given. Biva...
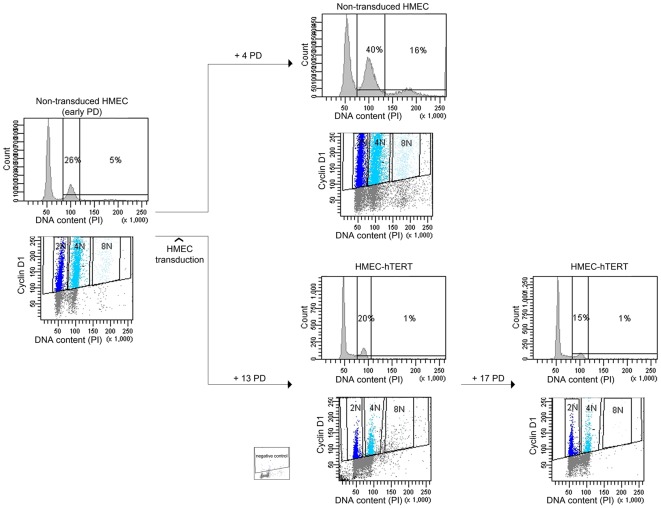
Figure 2
Polyploidization is reverted by hTERT immortalization.
DNA content evolution of non-transduced and hTERT-transduced HMECs at different PDs by univariate and bivariate flow cytometry. At an early PD, non-transduced 219-7 HMECs were analyzed for the presenc...
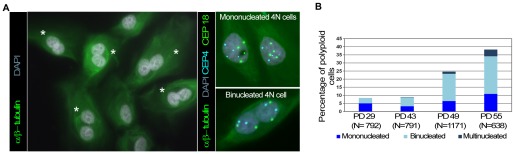
Figure 3
Polyploid HMECs arise through incomplete cytokinesis.
(A) Immunofluorescence of alpha and beta-tubulin and DAPI staining allows binucleated (white asterisks) to be distinguished from mononucleated HMECs (left image). ImmunoFISH combining alpha and beta t...
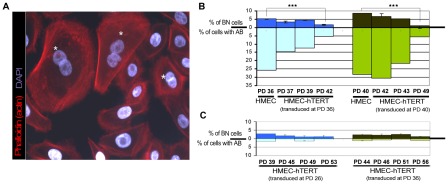
Figure 4
Quantification of anaphase bridges and binucleates in non-transduced and hTERT-transduced HMECs.
(A) Texas Red-X phalloidin labelling of actin filaments and DNA counterstaining with DAPI of non-transduced HMECs. White asterisks highlight those binucleated cells. (B) Analysis for the presence of b...
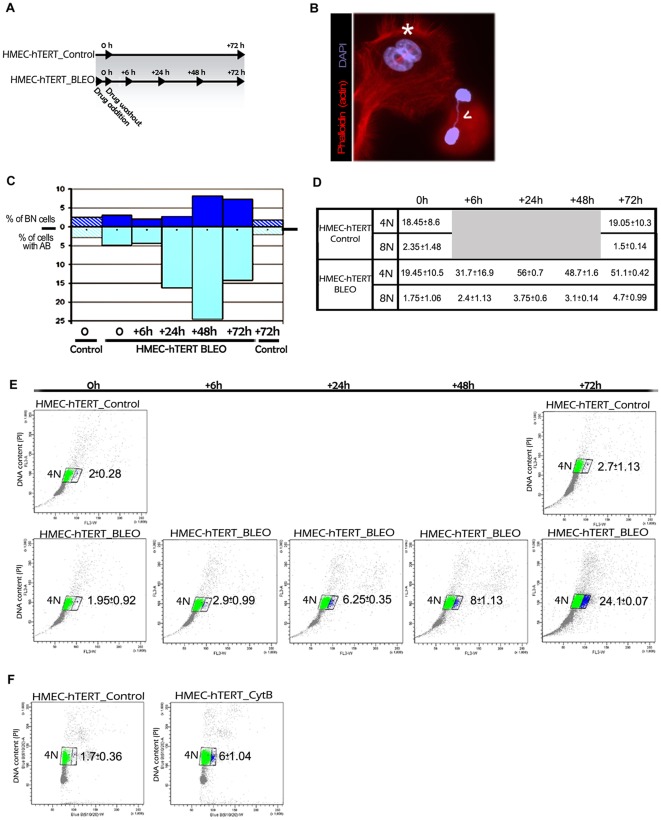
Figure 5
Artificially induced anaphase bridges engender binucleated polyploid HMEC-hTERT cells.
(A) Immortalized HMECs were treated for one hour with the DNA damage-inducing agent bleomycin (HMEC-hTERT_BLEO) to induce double strand breaks. After drug washout, cells were collected at different ti...
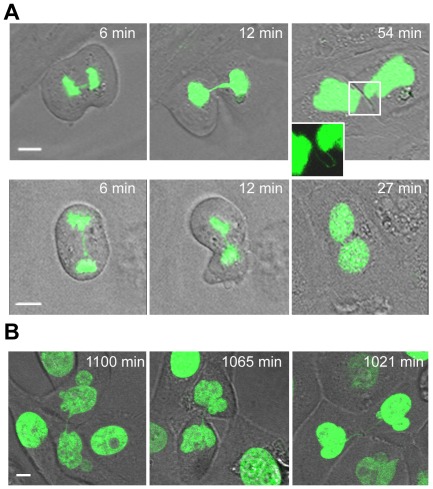
Figure 6
Unbroken anaphase bridges interfere with abscission in HMECs and HMEC-hTERT cells.
Non-transduced and hTERT-transduced HMECs were transfected with a H2B-GPF plasmid. (A) Time-lapse micrographies of non-transduced HMECs transiently expressing H2B-GFP. Time 0 was set as the last time ...
Figure images are served from the NIH/NLM PubMed Central Open Access Subset or Europe PMC; copyright remains with the publishers and authors.
💬 Discussion
0 commentsNo comments yet. Be the first to start a discussion!
Leave a Comment