Abstract
AbstractThe noninvasive, fast acquisition of quantitative phase maps using digital holographic microscopy (DHM) allows tracking of rapid cellular motility on transparent substrates. On two‐dimensional surfaces in vitro, MDA‐MB‐231 cancer cells assume several morphologies related to the mode of migration and substrate stiffness, relevant to mechanisms of cancer invasiveness in vivo. The quantitative phase information from DHM may accurately classify adhesive cancer cell subpopulations with clinical relevance. To test this, cells from the invasive breast cancer MDA‐MB‐231 cell line were cultured on glass, tissue‐culture treated polystyrene, and collagen hydrogels, and imaged with DHM followed by epifluorescence microscopy after staining F‐actin and nuclei. Trends in cell phase parameters were tracked on the different substrates, during cell division, and during matrix adhesion, relating them to F‐actin features. Support vector machine learning algorithms were trained and tested using parameters from holographic phase reconstructions and cell geometric features from conventional phase images, and used to distinguish between elongated and rounded cell morphologies. DHM was able to distinguish between elongated and rounded morphologies of MDA‐MB‐231 cells with 94% accuracy, compared to 83% accuracy using cell geometric features from conventional brightfield microscopy. This finding indicates the potential of DHM to detect and monitor cancer cell morphologies relevant to cell cycle phase status, substrate adhesion, and motility. © 2017 International Society for Advancement of Cytometry
🔬 Techniques
🧬 Organisms
✨ Fluorophores
🧪 Sample Preparation
🔬 Cell Lines
🏭 Microscope Brands
🧪 Reagent Suppliers
📷 Detectors
💻 Software Details
🏛️ Research Organizations (ROR)
Affiliated research institutions:
📊 Figures
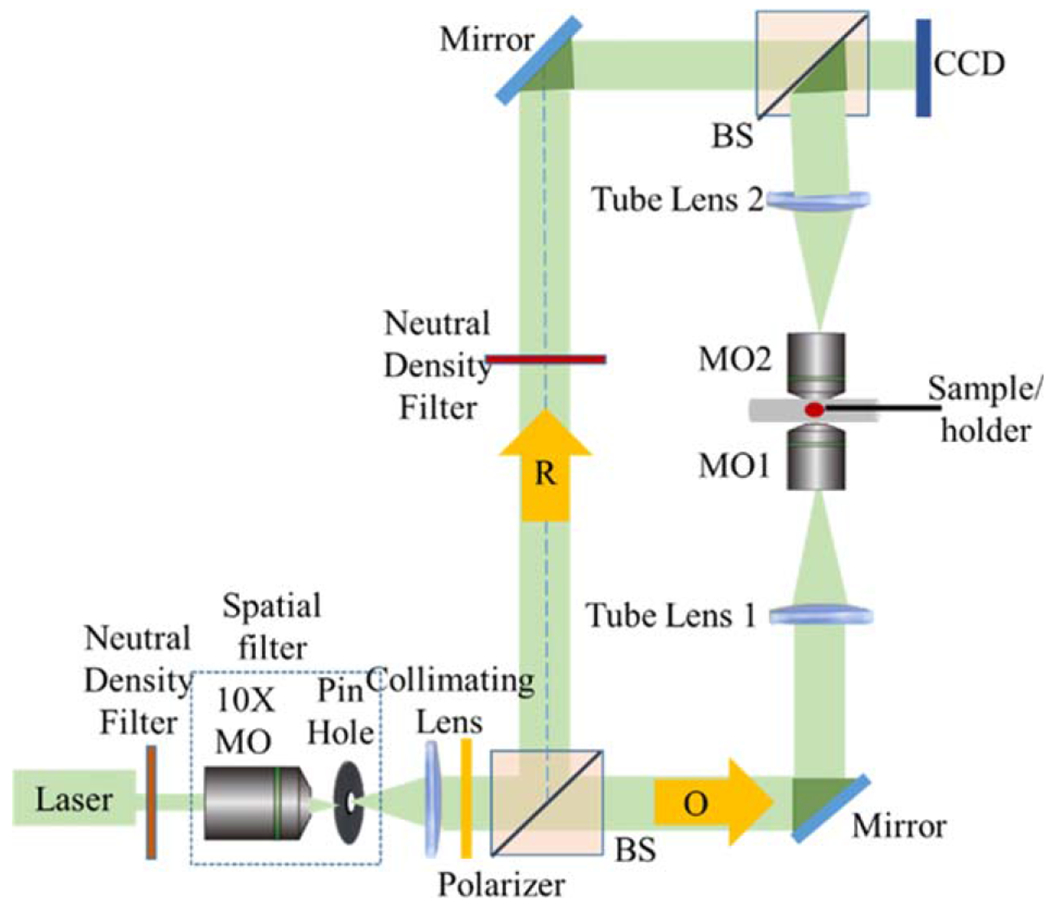
Figure 1.
The BT-DHM system in transmission configuration. MO, beamsplitters (BS), object beam (O), reference beam (R), and CCD camera are labeled. [Color figure can be viewed at wileyonlinelibrary.com ]
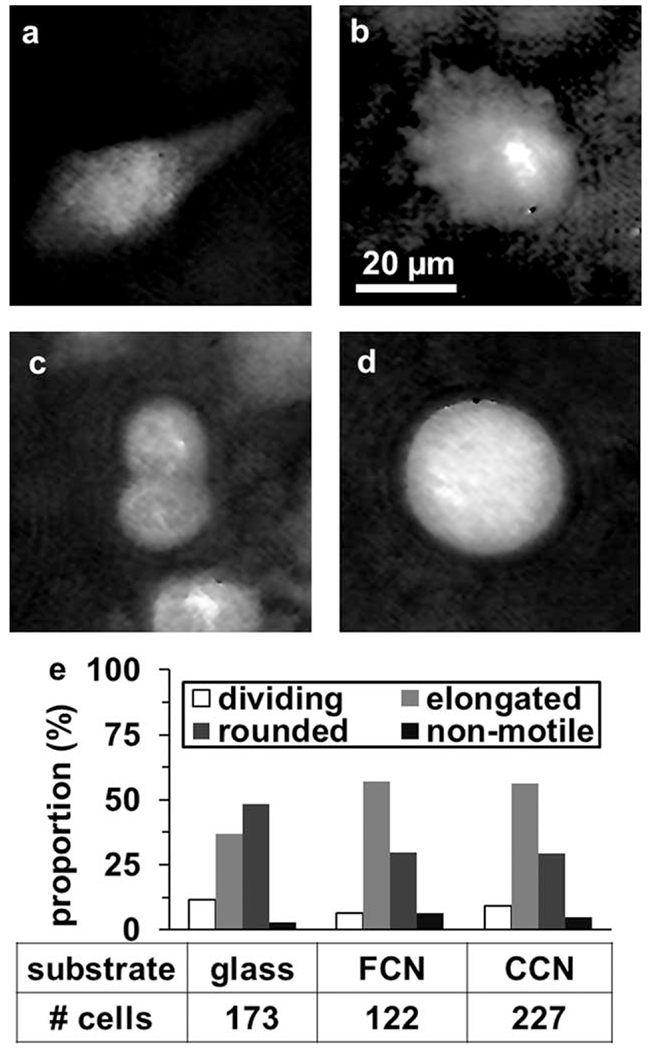
Figure 2.
Phenotype of MDA-MB-231 cells on 2D substrates by DHM and time-lapse microscopy. DHM phase maps of typical ( a ) elongated motile, ( b ) rounded motile, ( c ) dividing, and ( d ) rounded/nonmotile cel...
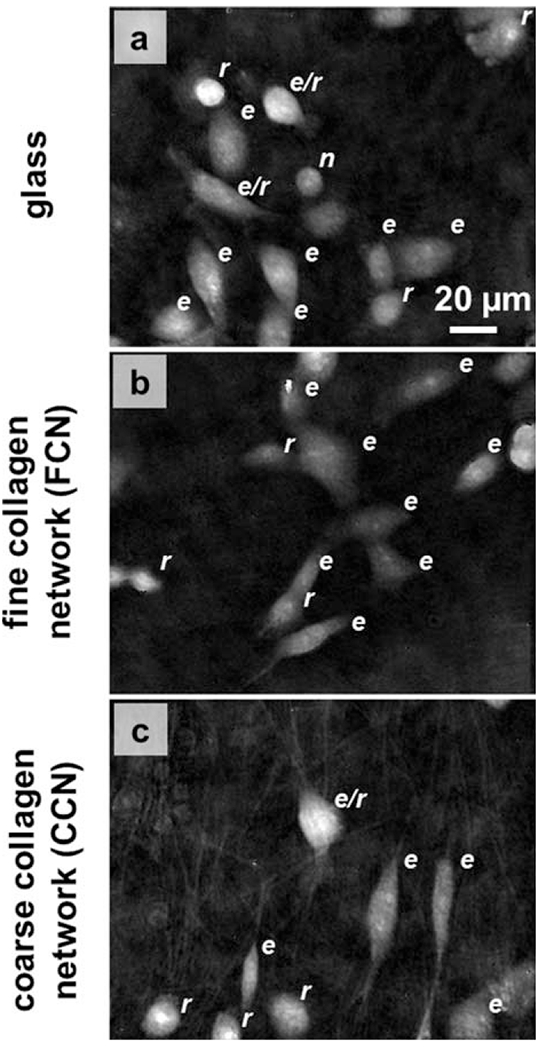
Figure 3.
Phase maps from time-lapse DHM experiments of MDA-MB-231 cells on ( a ) glass ( Video 1 , MPEG, 1.8 MB), ( b ) a 4 mg/ml collagen hydrogel polymerized at 37u00b0C ( Video 2 , MPEG, 1.6 MB), and ( c ) ...
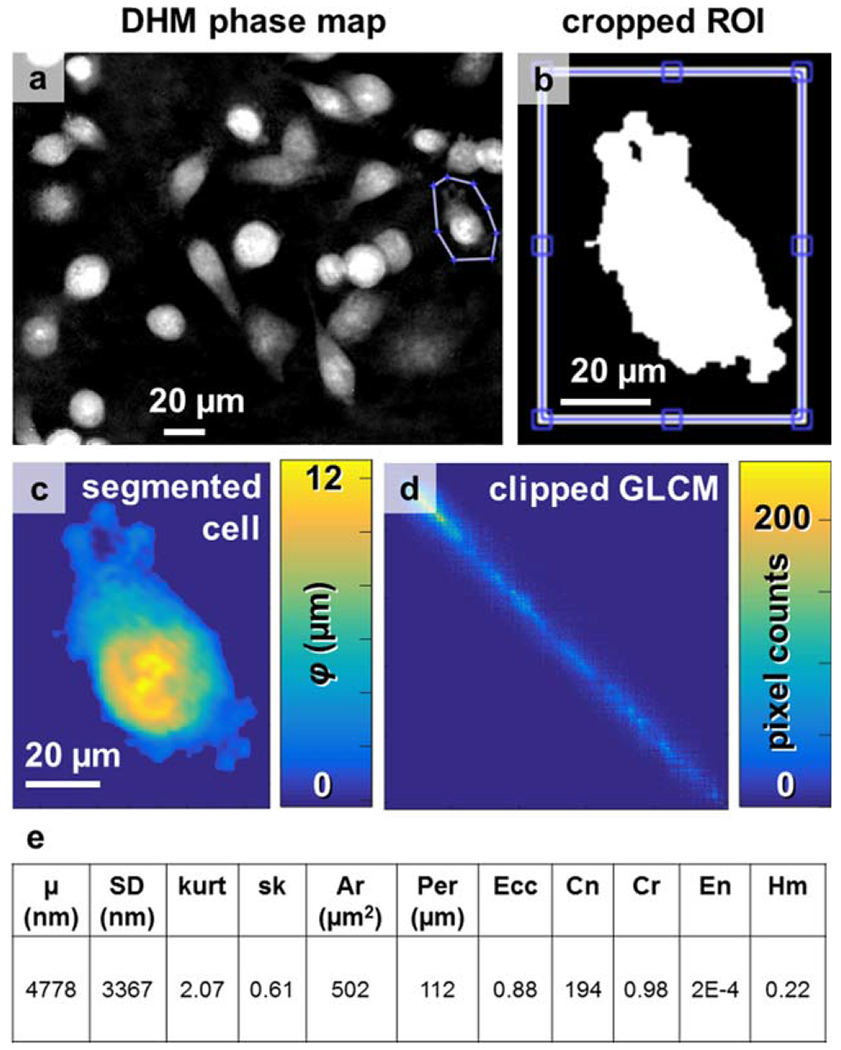
Figure 4.
Cell segmentation and texture analysis. ( a ) A typical phase reconstruction of cultured MDA-MB-231 cells, with one cell outlined by a region of interest. ( b ) The binary threshold of the cell, used ...
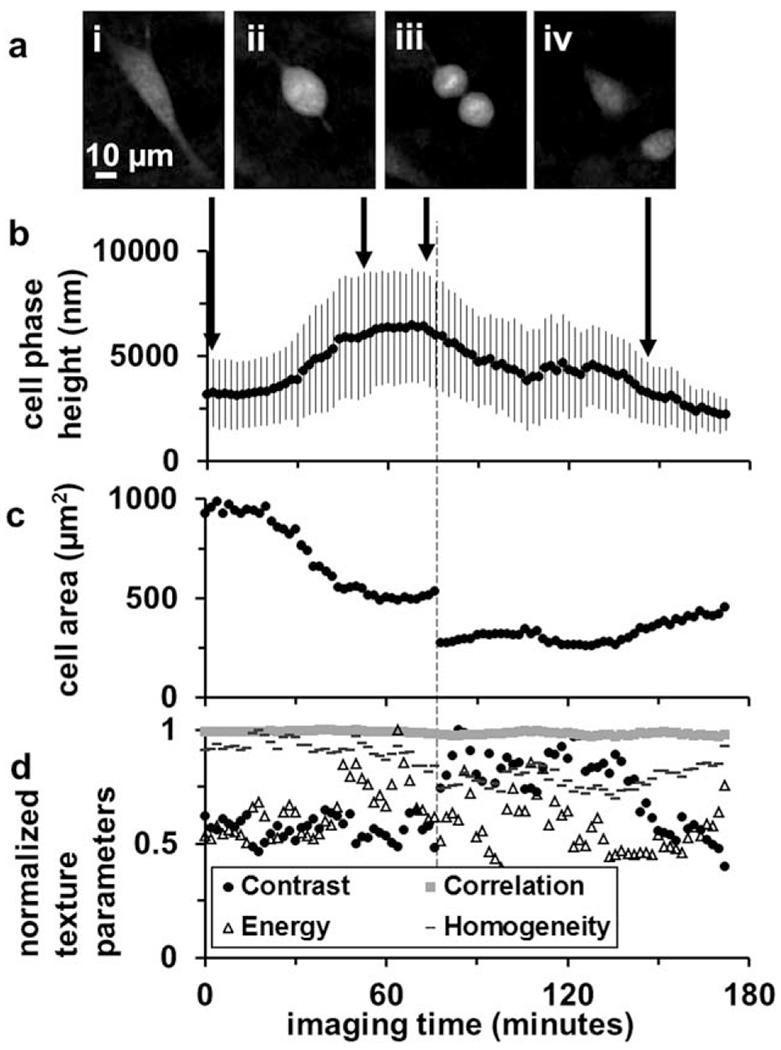
Figure 5.
Quantitative phase parameters from a dividing cancer cell. ( a ) DHM phase reconstructions (i) before mitosis, (ii) during prophase-metaphase, (iii) anaphase, and (iv) post-mitosis. ( b ) The cell mea...
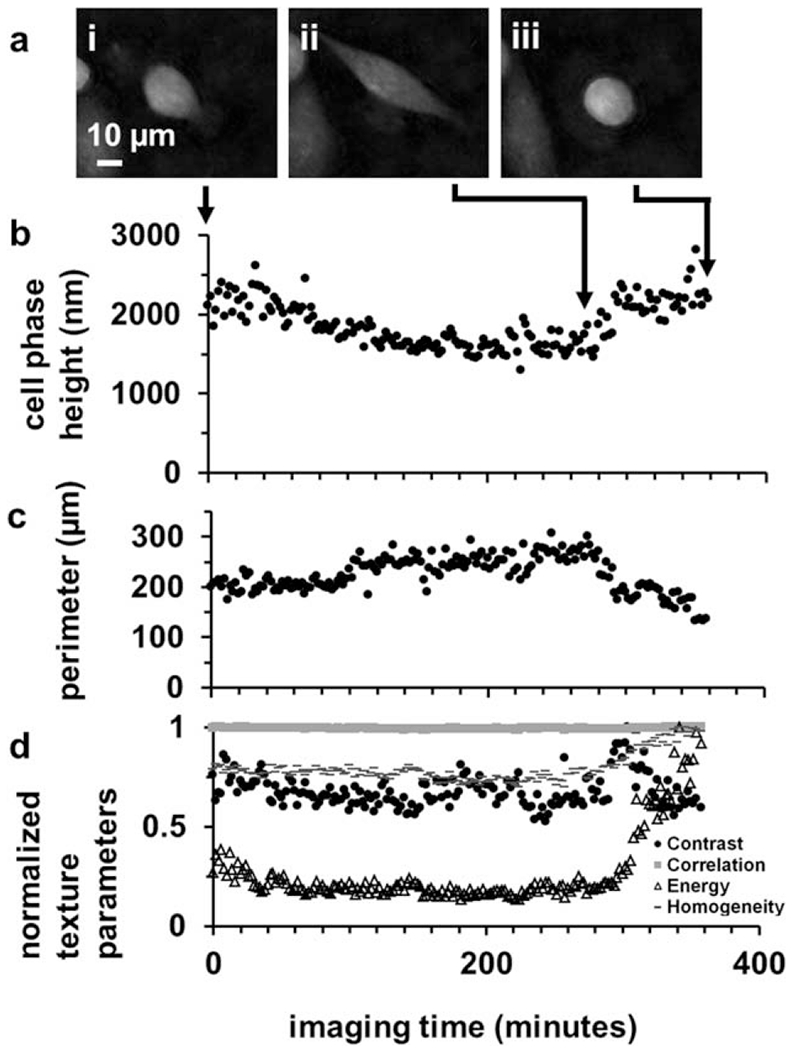
Figure 6.
Quantitative phase parameters from a motile adherent cancer cell. ( a ) DHM phase reconstructions (i) at the beginning, (ii) end of an extension phase, and (iii) after retraction of membrane protrusio...
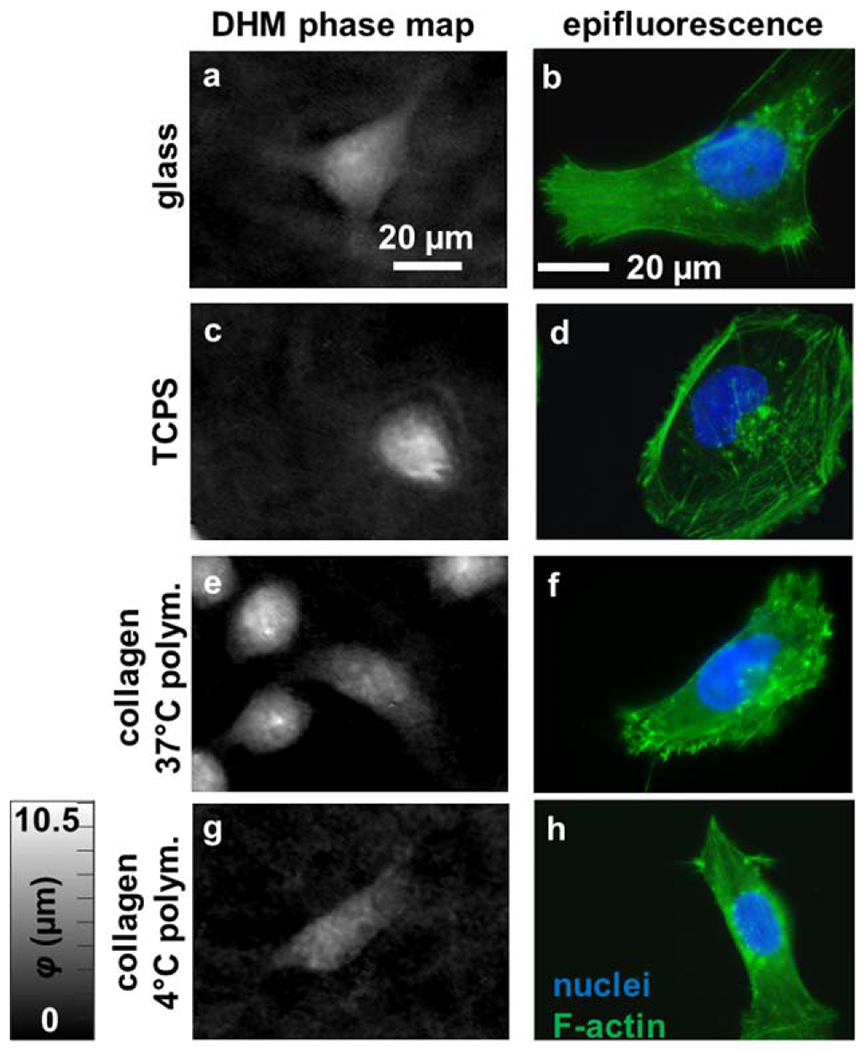
Figure 7.
Comparing phase reconstructions to subcellular features. Cells with similar shape were imaged on ( a,b ) glass, ( c,d ) TCPS, and collagen gels polymerized at ( e,f ) 37u00b0C and ( g,h ) 4u00b0C, cre...
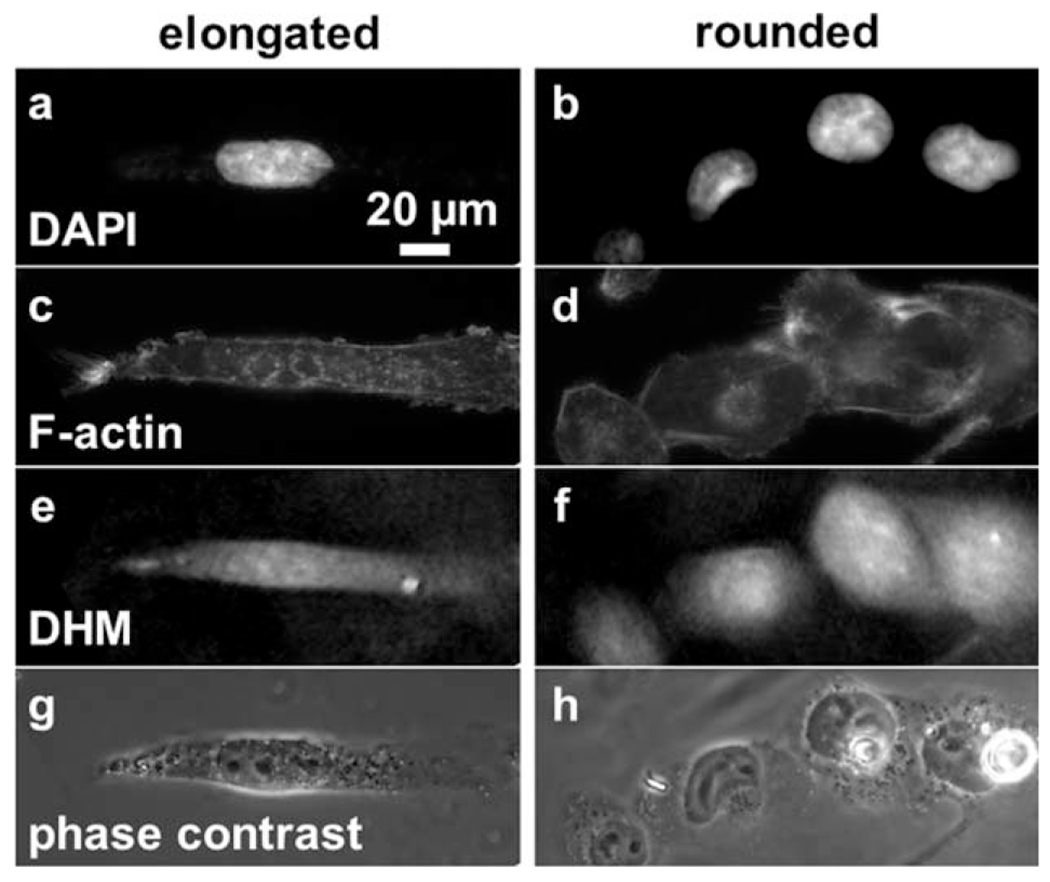
Figure 8.
Co-registered DHM, epifluorescence, and phase contrast images of MDA-MB-231 cells. Epifluorescence images of ( a,b ) DAPI, and ( c,d ) phalloidin stains, as well as ( e,f ) DHM phase maps, and ( g,h )...
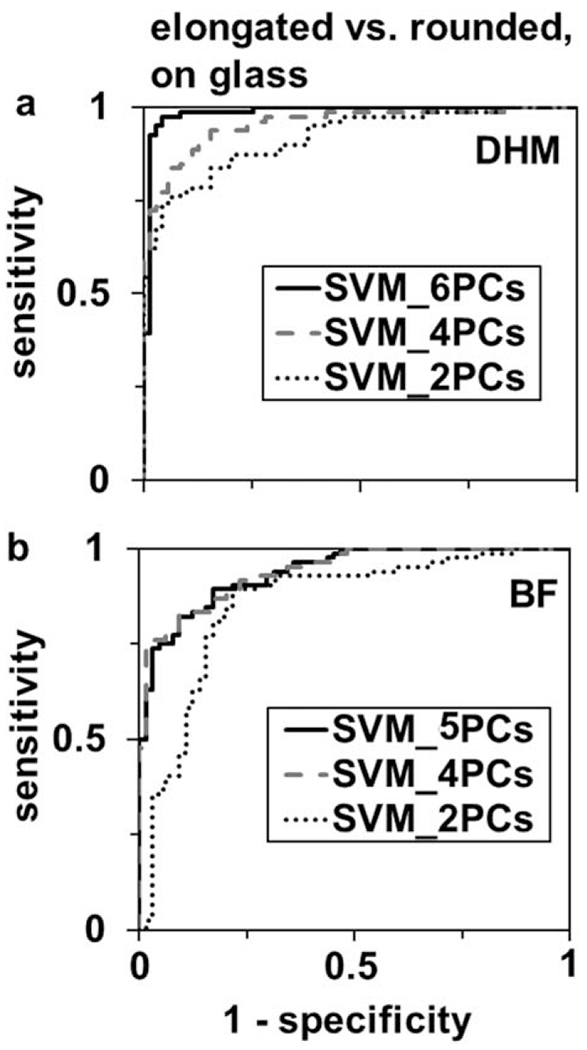
Figure 9.
ROC curves for linear support vector machine learning classification of elongated versus rounded motile cells using PCA feature extraction of ( a ) cell morphological features and phase parameters fro...
Figure images are served from the NIH/NLM PubMed Central Open Access Subset or Europe PMC; copyright remains with the publishers and authors.
💬 Discussion
0 commentsNo comments yet. Be the first to start a discussion!
Leave a Comment