Abstract
Dendritic cells (DCs) play a key role in initiating adaptive immune response by presenting antigen to T cells in lymphoid organs. Here, we investigate the potential of quantum dots (QDs) as fluorescent nanoparticles for in vitro and in vivo imaging of DCs, and as a particle-based antigen-delivery system to enhance DC-mediated immune responses. We used confocal, two-photon, and electron microscopies to visualize QD uptake into DCs and compared CD69 expression, T cell proliferation, and IFN-gamma production by DO11.10 and OT-II T cells in vivo in response to free antigen or antigen-conjugated to QDs. CD11c(+) DCs avidly and preferentially endocytosed QDs, initially into small vesicles near the plasma membrane by an actin-dependent mechanism. Within 10 min DCs contained vesicles of varying size, motion, and brightness distributed throughout the cytoplasm. At later times, endocytosed QDs were compartmentalized inside lysosomes. LPS-induced maturation of DCs reduced the rate of endocytosis and the proportion of cells taking up QDs. Following subcutaneous injection of QDs in an adjuvant depot, DCs that had endocytosed QDs were visualized up to 400 microm deep within draining lymph nodes. When antigen-conjugated QDs were used, T cells formed stable clusters in contact with DCs. Antigen-conjugated QDs induced CD69 expression, T cell proliferation, and IFN-gamma production in vivo with greater efficiency than equivalent amounts of free antigen. These results establish QDs as a versatile platform for immunoimaging of dendritic cells and as an efficient nanoparticle-based antigen delivery system for priming an immune response.
🔬 Techniques
🔭 Microscopes
💻 Software
✨ Fluorophores
🧪 Sample Preparation
🔬 Cell Lines
🏭 Microscope Brands
🧪 Reagent Suppliers
🔴 Lasers
🔎 Objectives
💻 Software Details
🏛️ Research Organizations (ROR)
Affiliated research institutions:
📋 Methods
Mice BALB/c (I-A d ), C57BL/6J (I-A b ), and congenic CD45.1-expressing BL6/SJL (C57BL/6) mice were purchased from Jackson Laboratory. Ova peptide 323–339 /I-A d -specific TCR-transgenic DO11.10 mice (KJ1.26 + ) were progeny of homozygotic DO11.10 parents purchased from Jackson Laboratory. Ova peptide 323–339 /I-A b -specific TCR-transgenic OT-II mice were progeny of homozygotic OT-II parents purchased from Jackson Laboratory.
Mice expressing enhanced yellow fluorescent protein
(EYFP) on CD11c promoter were a kind gift from M. Nussensweig [34] . These mice were back-crossed for 10 generations to a C57BL/6 background. Mice were housed in a pathogen-free animal facility and all procedures were performed in accordance with protocols approved by the institutional animal care and use committee of UCI. Conjugation of ovalbumin to quantum dots Ovalbumin was biotinylated using EZ-Link™ Sulfo-NHS-Biotin (Pierce™). Excess biotin and salts were separated by gel filtration using D-Salt™ dextran desalting columns (Pierce™). Biotinylation of ovalbumin was verified by Western blotting. Quantum dot (QD) 655-streptavidin conjugates (100 nmol; Quantum Dot Corp./Invitrogen™) were mixed with biotinylated ovalbumin at a molar ratio of 1∶10 in 2 ml PBS at 6°C for 2 hr. Excess ovalbumin was removed by at least 4 rounds of ultrafiltration using Amicon Ultra™ 4 100,000 MWCO ultrafiltration units (Millipore Corp.). Each QD-streptavidin conjugate contains an average of 10 molecules of surface-bound streptavidin (Quantum Dot Corp.). Thus, a 1 nM solution of QD-streptavidin conjugates bound to biotinylated ovalbumin, as used for priming DCs in vitro , contains 10 nM ovalbumin, which is equivalent to 0.5 µg/ml of ovalbumin. In vitro dendritic cell culture Dendritic cells were cultured from tibial and femoral bone marrow extracts of 8–12 week old mice as described [39] . Briefly, the bone marrow extracts were cultured in non TC-treated polystyrene culture dishes (Corning™) using IMDM (Lonza™) substituted with 10% fetal calf serum (FCS; Hyclone Inc.), ∼1,000 units/ml (20 ng/ml) recombinant mouse granulocyte/macrophage colony stimulating factor (GM-CSF; Pharmingen™), 100 units/ml penicillin, and 100 µg/ml streptomycin. DCs were harvested between six and ten days of culture and used in experiments. For flow cytometry of QD + cells, harvested DCs were incubated in QD-containing medium (2 nM QD in RPMI substituted with 10% FCS), for 30 min at 37°C, and subsequently labeled with FITC-conjugated anti-mouse CD11c (Pharmingen™), PE-conjugated anti-mouse CD11b (Ebioscience™)To induce maturation, DCs were incubated with 1 µg/ml lipopolysachharide (LPS) (Sigma-Aldrich Inc.) for 12–16 hr, and maturation was verified by upregulation of MHC class-II (PE-conjugated anti-mouse MHC-II; Pharmingen™) and CD86 (PE-conjugated anti-mouse CD86; Pharmingen™). In vitro imaging of DCs, quantification of QD uptake, and vesicular dynamics For in vitro imaging, bone marrow-derived DCs were plated on cover glass chambers, and incubated with 2 nM QD-containing medium. Unless otherwise mentioned, temperature was maintained at 37°C by perfusing temperature-controlled PBS below the cover slip. For assessment of QD-toxicity in DCs propidium iodide (Calbiochem™) staining was used. Fluorescence and DIC images were acquired with a Zeiss Axiovert 35 microscope using a 40× 1.30 n.a. oil-immersion objective, equipped with a temperature controller. Higher resolution images were acquired with a custom-built video-rate two-photon microscope based on a Olympus BX50 confocal laser-scanning system, equipped with a titanium-sapphire femtosecond laser (Tsunami, Spectra-Physics) tuned to 780 nm, photomultiplier tubes for detection, and a 60× 1.10 NA water-immersion objective as previously described [40] . Every image acquired was an average of 15 video-rate frames (acquired at a rate of 30 frames/s using Metamorph™ software (Universal Imaging / Molecular Devices) and Video Savant (IO Industries™). Metamorph™ was used to create time-lapse videos from sequential two-photon images, and to observe and analyze QD uptake and the trafficking of QD-containing endosomes inside DCs. Images were acquired at a spatial resolution of 4.5 pixels/µm using 110 mW mean laser power for quantification of QD uptake, and at a spatial resolution of 12 pixels/µm for measurement of kinetics of QD-containing vesicles. For evaluation of antigen uptake in immature and mature DCs, QD-fluorescence intensity was measured over time. After background subtraction, intensities were normalized to the intensity measured 400 s after incubation of DCs in QD-containing medium. The linear slopes of intensities were measured to quantify rate of uptake of QDs by DCs. Velocities and displacements of individual vesicles were measured from unprocessed sequential two-photon images taken at intervals of 700 ms. Normalized displacements of individual vesicles were plotted to depict trajectories. For experiments involving temperature-variation of vesicular dynamics, temperatures were varied between 23°C and 37°C. Q 10 was calculated as Q 10 = 10 ΔlogV , where ΔlogV is the change in the value of log 10 velocity for a 10°C rise in temperature. To observe the effects of cytoskeletal inhibitors on uptake of QDs, bone marrow-derived DCs were labeled with 10 µM CFSE (Invitrogen™) for 15 min at 37°C, and subsequently treated with calyculin A (Sigma-Aldrich™; 200 nM for 20 min), cytochalasin D (Sigma-Aldrich™; 1 µM for 1 hr), or nocodazole (Sigma-Aldrich™; 1 µM for 1 hr). These DCs were then incubated with 2 nM QD-containing medium at 37°C in the maintained presence of each of the reagents at the same concentration as used for pre-treatment. Using Metamorph™ QD-fluorescence and CFSE-fluorescence were measured within regions containing >5 cells after 10 min of incubation. Fluorescence intensity was normalized to intensity of CFSE and has been presented as a ratio of QD-fluorescence intensity of untreated control DCs. To observe the effects of cytoskeletal inhibitors on vesicular motion, bone marrow-derived DCs were first allowed to take up QD for 30 min at 37°C, and subsequently treated with calyculin A (200 nM), cytochalasin D (1 µM), or nocodazole (1 µM) during imaging. For lysosomal co-localization, harvested DCs were cultured overnight in glass-bottom culture dishes (Mattek™), incubated with 2 nM QD-containing medium for varying times at 37°C. Subsequently, DCs were fixed with 2% paraformaldehyde in PBS for 30 min at 4°C, and then stained with 20 µg/ml FITC-conjugated anti-mouse LAMP-2 (Pharmingen) for 2 hr at 4°C to stain lysosomes. DCs were washed with PBS, dehydrated in 100% ethanol, mounted using Vectashield™ hardest mounting medium (Vector Labs), and left overnight at 4°C before imaging. To observe the effects of cytoskeletal inhibitors on F-actin organization and QD-uptake, bone marrow-derived DCs were treated with cytochalasin D, nocodazole, or calyculin A, and then incubated with 2 nM QD-containing medium for 15 min at 37°C in the maintained presence of these reagents, as described earlier. Subsequently these DCs were plated on glass-bottom culture dishes, fixed with 4% paraformaldehyde and stained with 50 µg/ml FITC-phalloidin for 1 hr at room temperature. These samples were washed with PBS, dehydrated in 100% ethanol, mounted using Vectashield™ hardest mounting medium (Vector Labs), and left overnight at 4°C before imaging. Fixed DCs were imaged using a Zeiss LSM-510 confocal microscope equipped with a Zeiss™ PlanApochromat™ 63× 1.40 N.A. oil-immersion objective. In vivo imaging of DC and determination of DC phenotype BALB/c mice were s.c. injected in lower flank with 100 nmol CFSE (green) and 20 pmol QD (red) included in 50 µl of complete Freund's adjuvant (CFA, Sigma™). Draining inguinal and brachial nodes from injected mice were harvested 24 hr later and observed using two-photon microscopy as described [10] . Briefly, the nodes were placed on plastic cover slips (Fisher™) using Vetbond™ (3M™), perfused with oxygenated RPMI (Hyclone Inc.) maintained at 37°C, and observed using two-photon microscopy. Images of several z sections (each an average of 15 frames acquired at 30 frames/s) at varying distances of separation were combined to create individual 3D time-points using Metamorph™. For locating DCs with respect to B cell follicles, mice were adoptively transferred with MACS™ magnetic separation chromatography-enriched (Miltenyi Biotec.) B cells from BALB/c mice labeled with 25 µM 7-amino-4-chloromethylcoumarin (CMAC, blue; Molecular Probes™ / Invitrogen™) for 45 min at 37°C; 24 hr later these mice were s.c. injected with 100 nmol CFSE (green) and 20 pmol QD (red) included in 50 µl CFA. 24 hr after injection, draining lymph nodes were harvested for two-photon imaging. DCs were recovered from lymph nodes for flow cytometry, as described [41] . Briefly, lymph nodes from injected mice were harvested 24 hr after s.c. injection of dye-CFA mixture, digested with 1 mg/ml Collagenase, Type IV (Worthington Biochemical) for 30 min at 37°C in DMEM substituted with 2% FBS. Cells were subsequently labeled with PE-conjugated anti-mouse CD11c (Ebioscience™), PE-conjugated anti-mouse GR-1 (Ebioscience™), or PE-conjugated anti-mouse CD8α (Ebioscience™), fixed with 2% paraformaldehyde in PBS, and analyzed by flow cytometry using Facscalibur™ flow cytometer (BD Biosciences).
Show full methods section
Mice BALB/c (I-A d ), C57BL/6J (I-A b ), and congenic CD45.1-expressing BL6/SJL (C57BL/6) mice were purchased from Jackson Laboratory. Ova peptide 323–339 /I-A d -specific TCR-transgenic DO11.10 mice (KJ1.26 + ) were progeny of homozygotic DO11.10 parents purchased from Jackson Laboratory. Ova peptide 323–339 /I-A b -specific TCR-transgenic OT-II mice were progeny of homozygotic OT-II parents purchased from Jackson Laboratory.
Mice expressing enhanced yellow fluorescent protein
(EYFP) on CD11c promoter were a kind gift from M. Nussensweig [34] . These mice were back-crossed for 10 generations to a C57BL/6 background. Mice were housed in a pathogen-free animal facility and all procedures were performed in accordance with protocols approved by the institutional animal care and use committee of UCI. Conjugation of ovalbumin to quantum dots Ovalbumin was biotinylated using EZ-Link™ Sulfo-NHS-Biotin (Pierce™). Excess biotin and salts were separated by gel filtration using D-Salt™ dextran desalting columns (Pierce™). Biotinylation of ovalbumin was verified by Western blotting. Quantum dot (QD) 655-streptavidin conjugates (100 nmol; Quantum Dot Corp./Invitrogen™) were mixed with biotinylated ovalbumin at a molar ratio of 1∶10 in 2 ml PBS at 6°C for 2 hr. Excess ovalbumin was removed by at least 4 rounds of ultrafiltration using Amicon Ultra™ 4 100,000 MWCO ultrafiltration units (Millipore Corp.). Each QD-streptavidin conjugate contains an average of 10 molecules of surface-bound streptavidin (Quantum Dot Corp.). Thus, a 1 nM solution of QD-streptavidin conjugates bound to biotinylated ovalbumin, as used for priming DCs in vitro , contains 10 nM ovalbumin, which is equivalent to 0.5 µg/ml of ovalbumin. In vitro dendritic cell culture Dendritic cells were cultured from tibial and femoral bone marrow extracts of 8–12 week old mice as described [39] . Briefly, the bone marrow extracts were cultured in non TC-treated polystyrene culture dishes (Corning™) using IMDM (Lonza™) substituted with 10% fetal calf serum (FCS; Hyclone Inc.), ∼1,000 units/ml (20 ng/ml) recombinant mouse granulocyte/macrophage colony stimulating factor (GM-CSF; Pharmingen™), 100 units/ml penicillin, and 100 µg/ml streptomycin. DCs were harvested between six and ten days of culture and used in experiments. For flow cytometry of QD + cells, harvested DCs were incubated in QD-containing medium (2 nM QD in RPMI substituted with 10% FCS), for 30 min at 37°C, and subsequently labeled with FITC-conjugated anti-mouse CD11c (Pharmingen™), PE-conjugated anti-mouse CD11b (Ebioscience™)To induce maturation, DCs were incubated with 1 µg/ml lipopolysachharide (LPS) (Sigma-Aldrich Inc.) for 12–16 hr, and maturation was verified by upregulation of MHC class-II (PE-conjugated anti-mouse MHC-II; Pharmingen™) and CD86 (PE-conjugated anti-mouse CD86; Pharmingen™). In vitro imaging of DCs, quantification of QD uptake, and vesicular dynamics For in vitro imaging, bone marrow-derived DCs were plated on cover glass chambers, and incubated with 2 nM QD-containing medium. Unless otherwise mentioned, temperature was maintained at 37°C by perfusing temperature-controlled PBS below the cover slip. For assessment of QD-toxicity in DCs propidium iodide (Calbiochem™) staining was used. Fluorescence and DIC images were acquired with a Zeiss Axiovert 35 microscope using a 40× 1.30 n.a. oil-immersion objective, equipped with a temperature controller. Higher resolution images were acquired with a custom-built video-rate two-photon microscope based on a Olympus BX50 confocal laser-scanning system, equipped with a titanium-sapphire femtosecond laser (Tsunami, Spectra-Physics) tuned to 780 nm, photomultiplier tubes for detection, and a 60× 1.10 NA water-immersion objective as previously described [40] . Every image acquired was an average of 15 video-rate frames (acquired at a rate of 30 frames/s using Metamorph™ software (Universal Imaging / Molecular Devices) and Video Savant (IO Industries™). Metamorph™ was used to create time-lapse videos from sequential two-photon images, and to observe and analyze QD uptake and the trafficking of QD-containing endosomes inside DCs. Images were acquired at a spatial resolution of 4.5 pixels/µm using 110 mW mean laser power for quantification of QD uptake, and at a spatial resolution of 12 pixels/µm for measurement of kinetics of QD-containing vesicles. For evaluation of antigen uptake in immature and mature DCs, QD-fluorescence intensity was measured over time. After background subtraction, intensities were normalized to the intensity measured 400 s after incubation of DCs in QD-containing medium. The linear slopes of intensities were measured to quantify rate of uptake of QDs by DCs. Velocities and displacements of individual vesicles were measured from unprocessed sequential two-photon images taken at intervals of 700 ms. Normalized displacements of individual vesicles were plotted to depict trajectories. For experiments involving temperature-variation of vesicular dynamics, temperatures were varied between 23°C and 37°C. Q 10 was calculated as Q 10 = 10 ΔlogV , where ΔlogV is the change in the value of log 10 velocity for a 10°C rise in temperature. To observe the effects of cytoskeletal inhibitors on uptake of QDs, bone marrow-derived DCs were labeled with 10 µM CFSE (Invitrogen™) for 15 min at 37°C, and subsequently treated with calyculin A (Sigma-Aldrich™; 200 nM for 20 min), cytochalasin D (Sigma-Aldrich™; 1 µM for 1 hr), or nocodazole (Sigma-Aldrich™; 1 µM for 1 hr). These DCs were then incubated with 2 nM QD-containing medium at 37°C in the maintained presence of each of the reagents at the same concentration as used for pre-treatment. Using Metamorph™ QD-fluorescence and CFSE-fluorescence were measured within regions containing >5 cells after 10 min of incubation. Fluorescence intensity was normalized to intensity of CFSE and has been presented as a ratio of QD-fluorescence intensity of untreated control DCs. To observe the effects of cytoskeletal inhibitors on vesicular motion, bone marrow-derived DCs were first allowed to take up QD for 30 min at 37°C, and subsequently treated with calyculin A (200 nM), cytochalasin D (1 µM), or nocodazole (1 µM) during imaging. For lysosomal co-localization, harvested DCs were cultured overnight in glass-bottom culture dishes (Mattek™), incubated with 2 nM QD-containing medium for varying times at 37°C. Subsequently, DCs were fixed with 2% paraformaldehyde in PBS for 30 min at 4°C, and then stained with 20 µg/ml FITC-conjugated anti-mouse LAMP-2 (Pharmingen) for 2 hr at 4°C to stain lysosomes. DCs were washed with PBS, dehydrated in 100% ethanol, mounted using Vectashield™ hardest mounting medium (Vector Labs), and left overnight at 4°C before imaging. To observe the effects of cytoskeletal inhibitors on F-actin organization and QD-uptake, bone marrow-derived DCs were treated with cytochalasin D, nocodazole, or calyculin A, and then incubated with 2 nM QD-containing medium for 15 min at 37°C in the maintained presence of these reagents, as described earlier. Subsequently these DCs were plated on glass-bottom culture dishes, fixed with 4% paraformaldehyde and stained with 50 µg/ml FITC-phalloidin for 1 hr at room temperature. These samples were washed with PBS, dehydrated in 100% ethanol, mounted using Vectashield™ hardest mounting medium (Vector Labs), and left overnight at 4°C before imaging. Fixed DCs were imaged using a Zeiss LSM-510 confocal microscope equipped with a Zeiss™ PlanApochromat™ 63× 1.40 N.A. oil-immersion objective. In vivo imaging of DC and determination of DC phenotype BALB/c mice were s.c. injected in lower flank with 100 nmol CFSE (green) and 20 pmol QD (red) included in 50 µl of complete Freund's adjuvant (CFA, Sigma™). Draining inguinal and brachial nodes from injected mice were harvested 24 hr later and observed using two-photon microscopy as described [10] . Briefly, the nodes were placed on plastic cover slips (Fisher™) using Vetbond™ (3M™), perfused with oxygenated RPMI (Hyclone Inc.) maintained at 37°C, and observed using two-photon microscopy. Images of several z sections (each an average of 15 frames acquired at 30 frames/s) at varying distances of separation were combined to create individual 3D time-points using Metamorph™. For locating DCs with respect to B cell follicles, mice were adoptively transferred with MACS™ magnetic separation chromatography-enriched (Miltenyi Biotec.) B cells from BALB/c mice labeled with 25 µM 7-amino-4-chloromethylcoumarin (CMAC, blue; Molecular Probes™ / Invitrogen™) for 45 min at 37°C; 24 hr later these mice were s.c. injected with 100 nmol CFSE (green) and 20 pmol QD (red) included in 50 µl CFA. 24 hr after injection, draining lymph nodes were harvested for two-photon imaging. DCs were recovered from lymph nodes for flow cytometry, as described [41] . Briefly, lymph nodes from injected mice were harvested 24 hr after s.c. injection of dye-CFA mixture, digested with 1 mg/ml Collagenase, Type IV (Worthington Biochemical) for 30 min at 37°C in DMEM substituted with 2% FBS. Cells were subsequently labeled with PE-conjugated anti-mouse CD11c (Ebioscience™), PE-conjugated anti-mouse GR-1 (Ebioscience™), or PE-conjugated anti-mouse CD8α (Ebioscience™), fixed with 2% paraformaldehyde in PBS, and analyzed by flow cytometry using Facscalibur™ flow cytometer (BD Biosciences).
Electron microscopy Harvested
DCs were cultured overnight in glass-bottom culture dishes (Mattek™), incubated with 2 nM QD-containing medium for varying times at 37°C, and processed as described [23] . Briefly, DCs were fixed with 2% glutaraldehyde (Electron Microscopy Sciences) in 0.1 M sodium cacodylate (Ted Pella™) buffer (pH 7.3) for 20 min, washed with 0.1% cacodylate buffer, and postfixed with 1% osmium tetroxide (Electron Microscopy Sciences) solution for 30 min. Subsequently, the DCs were counterstained with 4% uranyl acetate (Electron Microscopy Sciences) for 30 min, washed with distilled water, dehydrated in 100% ethanol, and embedded in Durcupan™ ACM resin (Fluka™). In vitro T cell proliferation assay DCs (∼4×10 5 cells) were incubated with varying concentrations of ovalbumin or QD ova in U-bottom polystyrene tubes (Fisher Scientific™). Antigen-pulsed DCs were incubated 6 hr later with 1 µg/ml LPS for 12–16 hr. CD4 + T cells were purified from spleen and lymph nodes of DO11.10 mice by depleting CD8 + T cells, B cells, NK cells, DCs, macrophages, granulocytes, and RBCs using MACS™ magnetic cell separation kit (Miltenyi Biotec.). Subsequently, the T cells were labeled with 4 µM carboxyfluorescein diacetate succinimidyl ester (CFSE) (Molecular Probes™/Invitrogen™) at 37°C for 10 min and ∼2×10 6 cells (5 T cells per DC) were put into each U-bottom tube containing antigen-pulsed or control DCs in T cell medium (RPMI, 10% FCS, 1 mM sodium pyruvate, 1% non-essential amino acids, 1% l-glutamine, 50 µM β-mercaptoethanol, 100 units/ml penicillin, and 100 µg/ml streptomycin). After 72–96 hr at 37°C T cells were harvested and stained using PE-conjugated anti-mouse DO11.10 clonotypic T cell receptor (KJ1-26) antibody (Pharmingen™). CFSE counts were gated on KJ1-26 + cells and CFSE dilution was analyzed using flow cytometry to measure proliferation due to T cell activation. T cell activation was measured in terms of an activation index ( AI ) using Equation 1, derived as described in Methods S1 . M 1 through M 7 are the cumulative counts of T cells within the gates M 1 through M 7 , shown in Figure 6A–6C . For comparison and evaluation of varying antigen doses, the activation indices were normalized to the activation index of 50 µg/ml ovalbumin. (1) In vivo T cell proliferation assay T cells from DO11.10 (ova peptide 323–339 /I-A d ) or OT-II mice (ova peptide 323–339 /I-A b ) were enriched using MACS™ as described above and labeled with 4 µM CFSE at 37°C for 15 min. ∼4×10 6 CFSE-labeled cells were adoptively transferred into BALB/c (for DO11.10 T cells) or C57BL/6 (for OT-II T cells) recipients, and allowed to equilibrate for 24 hr. Subsequently the recipient mice were s.c. injected with varying dose of ovalbumin or QD ova , or QDs included in 50 µl CFA, or CFA alone in the lower flank. Lymphocytes were recovered from lymph nodes and spleens harvested 2–4 days later. Harvested lymphocytes from BALB/c recipients were stained with PE-conjugated anti-mouse KJ1-26 antibody (Pharmingen) and analyzed for proliferation using flow cytometry by gating on KJ1-26. Harvested lymphocytes from C57BL/6 recipients were stained with PE-conjugated Vβ5.1/5.2 and APC-conjugated Vα2, and analyzed for proliferation using flow cytometry by gating on Vβ5.1/5.2 and Vα2. T cell activation was measured in terms of activation index ( AI ) using Equation 1 with five terms.
Imaging ova-specific T cell-DC interactions
T cells from DO11.10 mice were labeled with blue CMAC (20 µM at 37°C for 45 min) or green CFSE (10 µM at 37°C for 15 min) and ∼4×10 6 cells were adoptively transferred into BALB/c recipients. 24 hr later mice were s.c. injected on one flank with QD ova (containing 50 µg ovalbumin), and on the opposite flank with QD included in 50 µl complete Freund's adjuvant. Lymph nodes were harvested 18 hr later and imaged using two-photon microscopy, as described earlier. In separate experiments, mice were immunized with QD ova or QD, and 12 hr later adoptive transferred with blue CMAC-labeled T cells. Lymph nodes were harvested 8 hr after adoptive transfer of T cells and imaged using two-photon microscopy.
Assessment of IFN-γ production in T cells in immunized mice
T cells from OT-II mice (expressing CD45.2) were enriched as described above, and labeled with 4 µM CFSE at 37°C for 15 min. ∼2×10 6 CFSE-labeled cells were adoptively transferred into congenic CD45.1-expressing BL6 recipients, and allowed to equilibrate for 24 hr. Subsequently, the recipient mice were s.c. injected with 50 µg ovalbumin or QD ova , in both cases in 50 µl CFA. Lymphocytes were harvested from draining inguinal lymph nodes or control mesenteric lymph nodes 4 days after immunization. Harvested lymphocytes were re-stimulated with PMA and ionomycin in vitro for 6 hr. For the last 2 hr BD™ Golgistop™ was added to the medium. Subsequently, lymphocytes were stained with PE-conjugated anti-mouse CD45.2 (Ebioscience), fixed using BD™ cytofix-cytoperm™ cytokine staining kit, and labeled with APC-conjugated anti-mouse IFN-γ (Ebioscience) or isotype control. Labeled cells were assessed for IFN-γ production by gating on CD45.2 + cells.
Supporting Information Methods S1 Equipment and Settings, Calculation of T cell activation index (AI) (0.07 MB DOC) Click here for additional data file. Figure S1 Quantum dots are not toxic to DCs. DCs were incubated with 10 nM QD 525-Streptavidin conjugate for 48 hours, stained with 20 µg/ml of propidium iodide, and assessed for toxicity using flow cytometry. Histograms showing propidium iodide staining in untreated cells (green), QD-treated cells (red), and cells fixed with 2% glutaraldehyde (black). Isotype control has been shown in gray. While fixed DCs were ∼100% PI+, ∼15–20% of QD-treated DCs were PI+, comparable to untreated DCs. Thus QDs did not show toxicity at a concentration of 10 nM, higher than any of the concentrations used in our experiments (0.37 MB TIF) Click here for additional data file. Figure S2 Flow cytometry profile of cells that endocytosed QDs. Bone marrow-derived cells were incubated for 30 min with 2 nM QD at 37 µC, then washed and stained with (A) FITC-conjugated anti-CD11c or (B) FITC-conjugated anti-CD11b, and analyzed by flow cytometry by gating on the corresponding markers as shown in figure. ∼70% QD+ cells were CD11c+, and ∼75% QD+ cells were CD11b+. (0.39 MB TIF) Click here for additional data file. Figure S3 Confocal images showing effects of cytoskeletal inhibitors on F-actin organization and QD-uptake by DCs. DCs were either (A–C) untreated, or treated with (D–F) cytochalasin D (1 µM for 1 hr at 37°C), (G–I) nocodazole (1 µM for 1 hr at 37°C), or (J–L) calyculin A (200 nM for 20 min at 37°C), and incubated with media containing 2 nM QD (red) for 20 min in the maintained presence of these reagents. Subsequently, these DCs were fixed and stained with FITC-phalloidin to label F-actin (green). Confocal images are consistent with results obtained using real-time two-photon imaging. Scale bar = 10 µm. (3.51 MB TIF) Click here for additional data file. Figure S4 QDs in subcapsular sinus of draining lymph nodes. DCs were labeled in situ by subcutaneously injecting EYFP-CD11c mice with QDs included in 50 µl CFA. Draining lymph nodes were harvested 4 hrs later for imaging. Subcapsular fibers appear blue due to second harmonics. (A) QDs (red) are trapped inside vessels in the capsule and are presumably taken up by subcapsular DCs (green) and macrophages. (B, C) Z sectional views of the capsule show that QDs are not yet present inside the node below the capsule. Scale bar = 20 µm. (5.15 MB TIF) Click here for additional data file. Figure S5 Phenotypic profile of DCs observed by flow cytometry. Phenotypic markers are indicated on the Y-axis of each plot. Distribution of QD+ and CFSE+ cells (percent) for each phenotypic marker is shown on the graph.Note the similarity in distribution of QD+ and CFSE+ cells for each phenotypic marker. (0.86 MB TIF) Click here for additional data file. Figure S6 In vivo T cell response at different times following immunization. BALB/c mice were adoptively transferred with ∼4×10 6 CFSE-labeled DO11.10 T cells, and subsequently immunized with 50 µg of ovalbumin included in 50 µl CFA. Control and draining lymph nodes, and spleens were harvested (A–C) 2 days, (D–F) 3 days, or (G–I) 4 days after injection, and analyzed for T cell activation using flow cytometry. Day 2 (just prior to egress of activated T cells) was chosen as the time point for analysis of T cell activation. (0.32 MB TIF) Click here for additional data file. Video S1 QD-labeled DCs in vitro (5.34 MB AVI) Click here for additional data file. Video S2 QD-uptake by DCs in vitro (7.53 MB AVI) Click here for additional data file. Video S3 Fusion of QD-containing vesicles inside DCs (2.56 MB AVI) Click here for additional data file. Video S4 Vesicles jiggling inside a single DC (8.19 MB AVI) Click here for additional data file. Video S5 Effect of cytochalasin D on vesicular motion (7.58 MB AVI) Click here for additional data file. Video S6 Effect of nocodazole on vesicular motion (6.22 MB AVI) Click here for additional data file. Video S7 Effect of calyculin A on vesicular motion (10.30 MB AVI) Click here for additional data file. Video S8 In situ QD and CFSE-labeled DCs inside draining lymph nodes (4.61 MB AVI) Click here for additional data file. Video S9 Localization of in situ-labeled DCs inside draining lymph nodes relative to B cell follicles (4.15 MB AVI) Click here for additional data file. Video S10 Ova-specific T cells alongside QD-labeled DCs inside lymph nodes (7.69 MB AVI) Click here for additional data file. Video S11 Ova-specific T cells cluster around QD ova -labeled DCs inside lymph nodes (4.94 MB AVI) Click here for additional data file.
📊 Figures
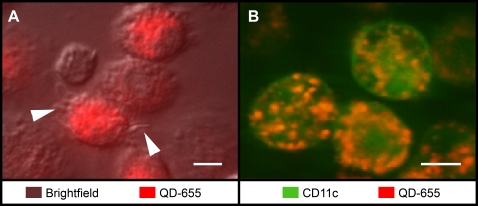
Figure 1
DCs avidly endocytose QDs.
(A) Overlay of brightfield and fluorescent images showing endocytosed QD-655 (red) within DCs with dendritic processes (indicated by arrows), after 30 min of incubation of DCs in QD-containing medium....
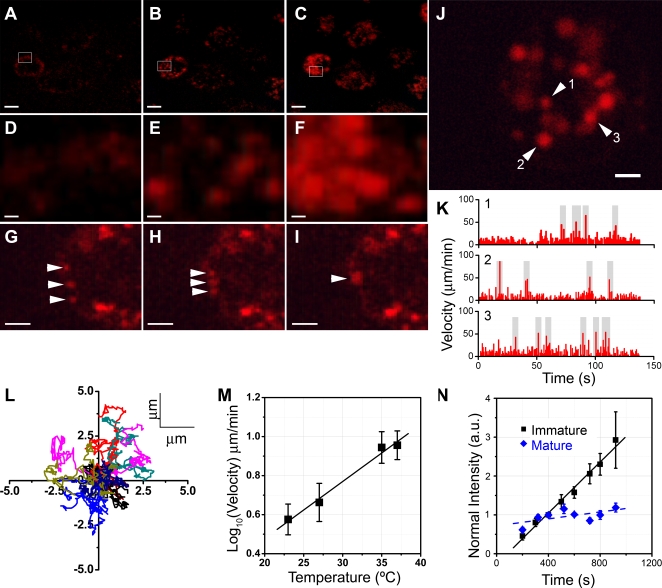
Figure 2
Dynamics of QD-uptake and QD-containing vesicles.
(Au2013F) Two-photon images of QD uptake by DCs at u223c2 min, 9 min, and 18 min after beginning incubation with 2 nM QD-containing medium at 37u00b0C. These frames have been taken from from Video S2 ...
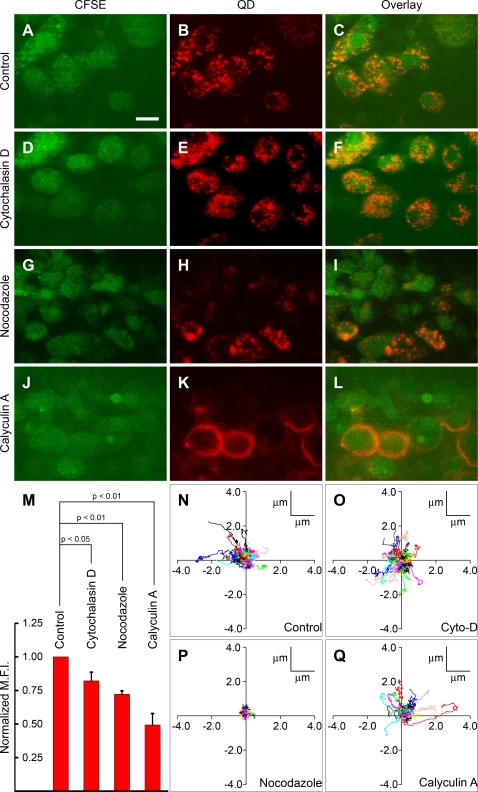
Figure 3
Effects of cytoskeletal inhibitors on QD-endocytosis by DCs.
QD (red) uptake in untreated control DCs (Au2013C), or DCs treated with cytochalasin D (Du2013F), nocodazole (Gu2013I), or calyculin A (Ju2013L). Scale baru200a=u200a10 u00b5m. (M) Histogram showing m...
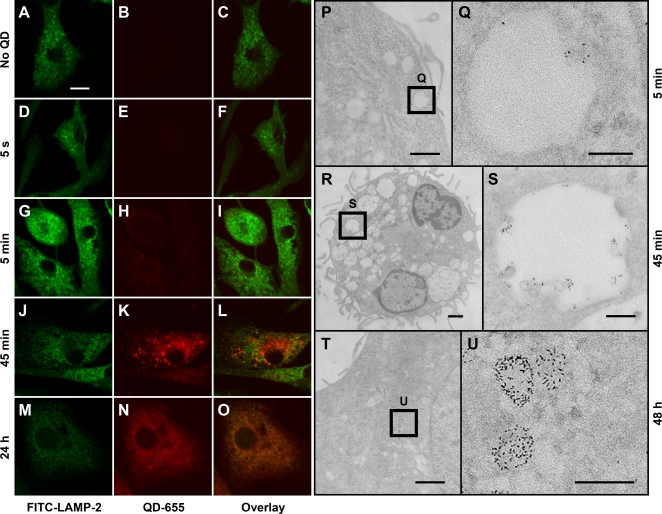
Figure 4
Compartmentation of single QDs inside endocytic vesicles and lysosomes.
(Au2013O) Confocal images showing colocalization of QD-containing vesicles with the lysosomal protein LAMP-2 inside bone marrow-derived DCs after different times of incubation in QD-containing medium ...
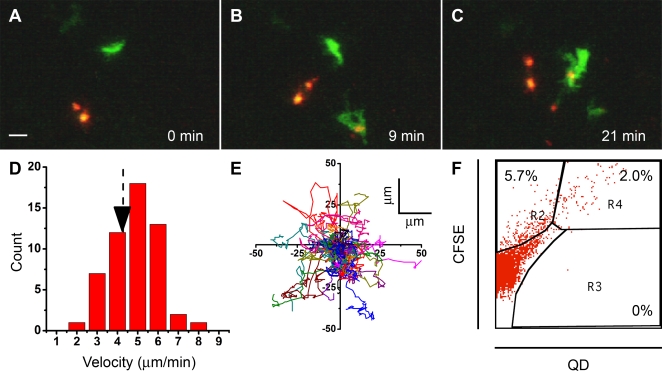
Figure 5
QD-labeled DCs visualized in situ in murine lymph nodes.
(Au2013C) Sequential two-photon images of in situ -labeled DCs inside draining lymph nodes 24 hr after subcutaneous injection of CFSE (green) and QD (red) included in CFA. The time elapsed (min) after...
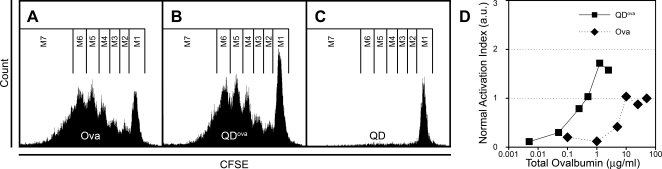
Figure 6
Activation of DO11.10 T cells in vitro by DCs pulsed with ovalbumin or QD ova .
(A, B, and C) CFSE peaks representing consecutive cycles of division of CFSE-labeled T cells that were activated by DCs pulsed with 25 u00b5g/ml ovalbumin (A), 5 nM QD ova (2.5 u00b5g/ml ovalbumin) (B...
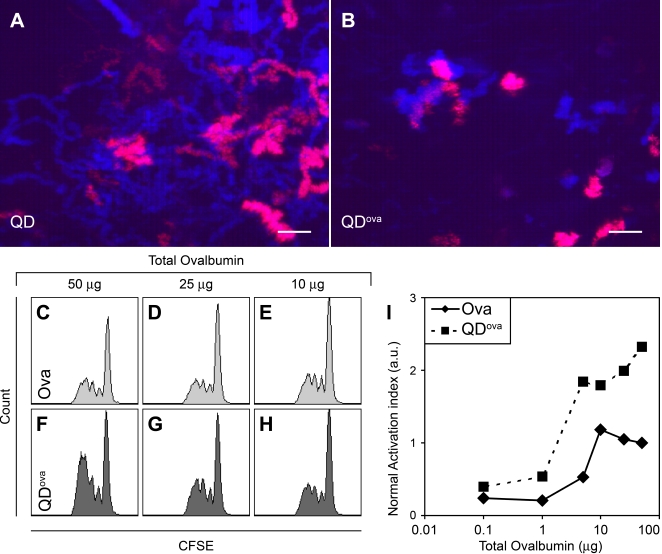
Figure 7
Activation of DO11.10 T cells in vivo by DCs pulsed with QD ova .
Overlays of successive two-photon images of draining lymph nodes 8 hr after adoptive transfer of CMAC-labeled ova-specific T cells into mice immunized with QD (A) or QD ova (B) included in 50 u00b5l C...
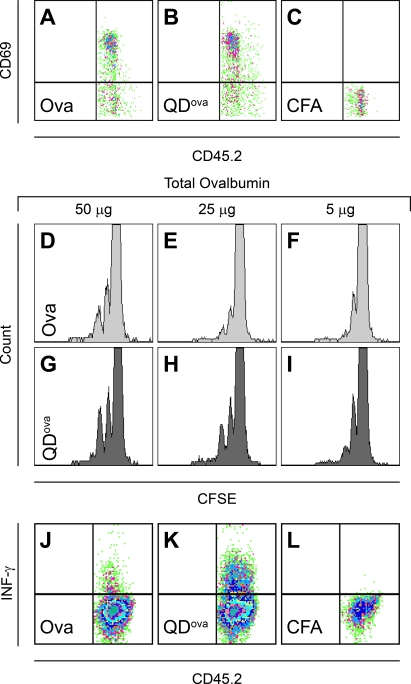
Figure 8
Activation of OT-II T cells in vivo by DCs pulsed with QD ova .
(A, B, and C) CD69 upregulation in OT-II T cells following immunization with CFA containing either 50 u00b5g free ovalbumin (A), QD ova (B), or CFA alone (C). CD69 expression, evaluated 18 hr after im...
Figure images are served from the NIH/NLM PubMed Central Open Access Subset or Europe PMC; copyright remains with the publishers and authors.
💬 Discussion
0 commentsNo comments yet. Be the first to start a discussion!
Leave a Comment