Abstract
Most mammalian neurons have a narrow axon, which constrains the passage of large cargoes such as autophagosomes that can be larger than the axon diameter. Radial axonal expansion must therefore occur to ensure efficient axonal trafficking. In this study, we reveal that the speed of various large cargoes undergoing axonal transport is significantly slower than that of small ones and that the transit of diverse-sized cargoes causes an acute, albeit transient, axonal radial expansion, which is immediately restored by constitutive axonal contractility. Using live super-resolution microscopy, we demonstrate that actomyosin-II controls axonal radial contractility and local expansion, and that NM-II filaments associate with periodic F-actin rings via their head domains. Pharmacological inhibition of NM-II activity significantly increases axon diameter by detaching the NM-II from F-actin and impacts the trafficking speed, directionality, and overall efficiency of long-range retrograde trafficking. Consequently, prolonged NM-II inactivation leads to disruption of periodic actin rings and formation of focal axonal swellings, a hallmark of axonal degeneration.
🔬 Techniques
🔭 Microscopes
🧬 Organisms
💻 Software
✨ Fluorophores
🧪 Sample Preparation
🔬 Cell Lines
🏭 Microscope Brands
🧪 Reagent Suppliers
📷 Detectors
🔎 Objectives
💻 Software Details
💾 Data Repositories
🏛️ Research Organizations (ROR)
Affiliated research institutions:
📋 Methods
Antibodies, molecular reagents, and DNA constructs SiR-actin (CY-SC001; Cytoskeleton), CellMask Deep Red ( H32721 ; Thermo Fisher Scientific), and predesigned siRNAs were purchased from Invitrogen (catalog number 4390771). siNMII-1# (s135202; 5′-GGAUCGCUACUAUUCAGGAtt-3′), siNMII-2# (s135204, 5′-CAACUAUGCAUCAACUACAtt-3′), Scramble-1# (5′-GGGCUGAAUCCGAUAAUCUtt-3′), and Scramble-2# (5′-GCACAUUACUCAAAUACCAtt-3′) were synthesized from Genomeditech Shanghai. p-MRLC (3674; Cell Signaling), MRLC (8505; Cell Signaling), Cell viability Kit ( L34973 ; Thermo Fisher Scientific), Alexa Fluor 555–, and Alexa Fluor 647–conjugated recombinant CTB were obtained from Thermo Fisher Scientific (#c-34776 and #c-34777). Mouse anti-synaptobrevin-2 (VAMP2) antibody was obtained from Synaptic Systems (104211), the rabbit anti-NM-IIB(ct) polyclonal antibodies were from Sigma-Aldrich (M7939), and mouse anti-NM-IIB(nt) monoclonal was from Santa Cruz (sc-376954). Microspheres with fluorescence in all four channels were purchased from Thermo Fisher Scientific (TetraSpeck; 7279). Alexa Fluor 647-phalloidin was purchased from Invitrogen (A22287), while the mouse anti-β-tubulin III was from Covance (MMS-435P). IRDye fluorescent secondary antibodies were from LI-COR (925-32211 and 926-32210); Alexa Fluor secondary antibodies were purchased from Life Technologies. The DNA construct encoding Lifeact-GFP was provided by Roland Wedlich Soldner (MPI Biochemistry, Martinsried, Germany), pTagRFP-mito was purchased from Evrogen (FP147), and pmRFP-LC3 was a gift from Tamotsu Yoshimori (Department of Genetics, Osaka University, Osaka, Japan; plasmid 21075; Addgene). Lysotracker Red DND 99 (7528; Thermo Fisher Scientific). The remaining reagents were obtained from Electron Microscopy Sciences or Sigma-Aldrich unless otherwise specified.
Show full methods section
Antibodies, molecular reagents, and DNA constructs SiR-actin (CY-SC001; Cytoskeleton), CellMask Deep Red ( H32721 ; Thermo Fisher Scientific), and predesigned siRNAs were purchased from Invitrogen (catalog number 4390771). siNMII-1# (s135202; 5′-GGAUCGCUACUAUUCAGGAtt-3′), siNMII-2# (s135204, 5′-CAACUAUGCAUCAACUACAtt-3′), Scramble-1# (5′-GGGCUGAAUCCGAUAAUCUtt-3′), and Scramble-2# (5′-GCACAUUACUCAAAUACCAtt-3′) were synthesized from Genomeditech Shanghai. p-MRLC (3674; Cell Signaling), MRLC (8505; Cell Signaling), Cell viability Kit ( L34973 ; Thermo Fisher Scientific), Alexa Fluor 555–, and Alexa Fluor 647–conjugated recombinant CTB were obtained from Thermo Fisher Scientific (#c-34776 and #c-34777). Mouse anti-synaptobrevin-2 (VAMP2) antibody was obtained from Synaptic Systems (104211), the rabbit anti-NM-IIB(ct) polyclonal antibodies were from Sigma-Aldrich (M7939), and mouse anti-NM-IIB(nt) monoclonal was from Santa Cruz (sc-376954). Microspheres with fluorescence in all four channels were purchased from Thermo Fisher Scientific (TetraSpeck; 7279). Alexa Fluor 647-phalloidin was purchased from Invitrogen (A22287), while the mouse anti-β-tubulin III was from Covance (MMS-435P). IRDye fluorescent secondary antibodies were from LI-COR (925-32211 and 926-32210); Alexa Fluor secondary antibodies were purchased from Life Technologies. The DNA construct encoding Lifeact-GFP was provided by Roland Wedlich Soldner (MPI Biochemistry, Martinsried, Germany), pTagRFP-mito was purchased from Evrogen (FP147), and pmRFP-LC3 was a gift from Tamotsu Yoshimori (Department of Genetics, Osaka University, Osaka, Japan; plasmid 21075; Addgene). Lysotracker Red DND 99 (7528; Thermo Fisher Scientific). The remaining reagents were obtained from Electron Microscopy Sciences or Sigma-Aldrich unless otherwise specified.
Neuronal cultures
Hippocampal neurons were cultured from embryonic day 18 embryos from Sprague Dawley rats. All experiments were approved by The University of Queensland Animal Ethics Committee. Hippocampal neurons were prepared as described previously ( Wang et al., 2015 ) and plated on glass coverslips (for confocal microscopy), plastic dishes (for EM), or in microfluidic chambers (RD450; Xona) according to the manufacturer’s protocol ( Taylor et al., 2005 ). Hippocampal neurons were transfected between DIV7 and DIV14 with Lipofectamine 2000 (11668019; Thermo Fisher Scientific); briefly, Lipofectamine and DNA/RNA were used in 1:1 ratio and then added into cultured neurons and incubated in serum-free neurobasal medium for >4 h before return to conditioned culture medium. For the pretreated groups, live imaging of approximately five (30 × 12 µm) regions of interest (ROIs) was performed 2 h after the CTB labeling. For blebbistatin treatment, conditioned culture medium containing blebbistatin (10 µM) was only added to the middle and/or terminal chambers of the six-well or four-well microfluidic chambers (TCND500 or RD450; Xona) to exclude its effect on the soma. For the short-term blebbistatin treatment, microfluidic devices were immediately returned to the 37°C imaging chamber for live imaging, and approximately five ROIs were imaged within a total duration of 60 min. For long-term blebbistatin treatment, microfluidic devices were returned to a 37°C CO 2 incubator for an additional 2 h before continuing the live imaging.
Confocal microscopy
Stimulation and labeling were performed in DIV14 rat hippocampal neurons cultured in microfluidic chambers. Briefly, the culture medium was removed from all chambers and the neurons were incubated for 5 min at 37°C in labeling buffer (15 mM Hepes, 145 mM NaCl, 5.6 mM KCl, 2.2 mM CaCl 2 , 0.5 mM MgCl 2 , 5.6 mM D-glucose, 0.5 mM ascorbic acid, and 0.1% BSA, pH 7.4), with 50 ng/ml CTB-Af555 or CTB-Af647 added to the nerve terminal chambers only. For Lysotracker labeling, the incubation time was 30 min. Neurons were then washed three times with warm neurobasal medium and returned to the original conditioned growth medium for 2 h before imaging. Images were acquired with a Zeiss LSM710 inverted microscope maintained at 37°C and 5% CO 2 , and videos were analyzed for carrier kinetics using the spot function of Imaris software (Imaris7.7-9.2; Bitplane). Kymographs were generated using ImageJ software (National Institutes of Health) using the plugin Multi-Kymograph for ImageJ. For immunofluorescence microscopy of fixed cells, the microfluidic devices were removed and neurons were subsequently fixed for 2–4 h at 4°C with PBS containing 4% PFA and 4% sucrose, followed by immunostaining with indicated antibodies. Permeabilization was performed using 0.1% saponin, 0.2% gelatin, and 1% BSA in PBS for 10 min at 25°C. Imaging was performed on a Zeiss LSM710 Inverted point-scanning laser confocal microscope with spectral detection and high-sensitivity BiG (GaAsP) detectors, using 63× 1.4 NA/190 µm WD/0.132 µm/pixel (1,024 × 1,024) objective in 37°C (live) or 25°C (fixed). Imaging medium was Neurobasal minus phenol red (12348017; Thermo Fisher Scientific). Time-lapse images were analyzed with ZEN 2.1 (Black) version 11.0 and ImageJ software. All images were compiled using Illustrator CS 5.1 (Adobe). Imaris tracing of axonal cargoes Time-lapse videos of CTB-positive or Lysotracker-positive carriers were analyzed for carrier kinetics using the spot function of Imaris software (Imaris7.7-9.2; Bitplane). In brief, region growth was enabled (threshold 50, diameter from border mode), estimated diameter 0.75 µm, tracing with autogressive motion (max distance 2 µm, max gap size 0). Resulted trajectories were filtered with duration >10 s and instant speed >0.07 µm/s. Average speed are calculated as track length divided by track duration. For Lysotracker-positive carriers that bleach rapidly, only the diameter of the first time point in each trajectory was used as the diameter for size grouping.
Colabeling of F-actin and NM-II for SIM imaging
Cultured rat hippocampal neurons were fixed at DIV14. For dual-color imaging using Phalloidin and NM-II, the fixation protocol was modified from that previously established for maintaining actin ultrastructure ( Xu et al., 2013 ). Briefly, the samples were initially fixed in 4% PFA dissolved in cytoskeleton buffer (CB; 10 mM MES, 150 mM NaCl, 5 mM EGTA, 5 mM glucose, and 5 mM MgCl 2 , pH 6.1) for 30 min at room temperature and then blocked with antibody dilution buffer (2% BSA with 0.1% Triton X-100 in PBS) for 1 h at room temperature, after which the primary antibody (NM-IIB, diluted 1 in 500) and phalloidin-Af647 (0.14 µM) in 2% BSA in PBS were applied to the dish and incubated at 4°C overnight. Donkey anti-rabbit secondary antibody (A-21206; Thermo Fisher Scientific) was diluted at 1/500 and incubated for 1 h at room temperature. Samples were immediately mounted in Vectashield medium (H-1000; Vector Laboratories) for SIM imaging. For the Triton X-100 extraction experiment, neurons were first treated with the extraction buffer (4% PFA, 0.1% [vol/vol] Triton X-100, and 1 µg/ml phalloidin in CB) for 45 s before the fixation and staining steps. For labeling of live neurons using SiR-actin, newly dissolved SiR-actin was added to culture medium at dilution rate of 1/1,000, followed by incubation for 2 h at 37°C. These neurons in glass-bottom dishes were then washed once with warm phenol-red free Neurobasal medium before imaging using a Zeiss ELYRA PS.1 SR-SIM system at 30°C.
SIM
Imaging of live and fixed specimens was performed using an Alpha Plan-Apochromat 100×/1.46 NA oil-immersion objective on a Zeiss ELYRA PS.1 SIM/PALM/STORM (SIM/photo-activated localization microscopy/stochastic optical reconstruction microscopy) super-resolution microscope (Carl Zeiss) built around an inverted Axio Observer.Z1 body and equipped with an sCMOS camera (PCO AG) for SIM acquisition and an iXon Ultra 897 electron multiplying charge-coupled device camera (Andor Technology) for PALM/STORM and controlled using ZEN 2.1 (Black) version 11.0. For live imaging of the SiR-actin labeled neurons, images were obtained with the Fastframe mode (100-ms exposure time, a time series of 200 frames at 20-s intervals, a SIM grating size of 51 µm at 640-nm excitation and using five rotations). For fixed and stained samples, images were obtained by acquiring z stacks of 10–16 slices with a spacing of 0.101 µm, an exposure time of 100 ms, a SIM grating size of 42–51 µm at 488-nm and 561-nm excitation and using five rotations. 3D structured illumination images were then reconstructed from the raw SIM data and channel alignment performed using Zen software. To ensure proper alignment of all channels, four-channel SIM data were acquired and processed using 100-nm multi-spectral beads mounted on a calibration slide (1783–455; Carl Zeiss) and channel alignment performed within Zen using the method Affine to provide a stretch and rotation dimension to the alignment, and the resulting data table was saved in a BIN file to be applied on multichannel specimen data. For cross-correlation analysis, line profiles were selected based on the standard of the existence of at least four consecutive NM-II peaks in a single axon shaft. The intensity profiles of each of the channels were then obtained using the Multichannel plot profile function of BAR collection ( Ferreria et al., 2015 ) in ImageJ software (National Institutes of Health). The autocorrelation or cross-correlation rate between the different channels was then examined using the xcorr function of MATLAB. The correlation values for each axon segment were averaged and plotted. Mander’s colocalization coefficient ( Manders et al., 1993 ), M A c t i n / N M − I I , is described by Eq. 2 , using the ImageJ plugin JACoP ( Bolte and Cordelières, 2006 ): M A c t i n / N M I I = ∑ i ( G i , c o l o c ) ∑ i ( G i ) , (2) where G i refers to the intensity values of the actin channels of pixel i and G i , c o l o c is the pixel colocalized with NM-II channel, and where i refers to the i th analyzed pixel of the total image.
Western blotting Transfected
PC12 cells were lysed with 2× SDS loading buffer and homogenized with syringe and needle. The homogenate was boiled in 95°C for 5 min, fractionated by SDS-PAGE, and then transferred to a polyvinylidene difluoride membrane. After blocking with Odyssey TBS blocking buffer for 30 min, membranes were washed once with TBST (1× TBS and 0.1% Tween 20 detergent) and incubate with antibodies against MRLC (1:1,000), p-MRLC (1:1,000), MHC (1:1,000), GAPDH (1:5,000), or β-actin (1:5,000) at 4°C overnight. Membranes were then washed three times with TBST and incubated with 1:20,000 dilution of fluorescently tagged anti-mouse or anti-rabbit antibodies covered with foil for 1 h. Blots were washed three times with TBST and imaged with Odyssey imaging system according to the manufacturer’s protocols.
Assessment of actin MPS and NM-II abundance
MPSs were defined as the axonal regions with at least four consecutive actin or NM-II peaks along the longitudinal direction. 5–7 of 5 µm × 5 µm ROIs were selected along the axons in each 3D SIM image (50 µm × 50 µm). In each ROI, the length of axon with F-actin MPS was measured with ImageJ by a trained observer blind to the treatment conditions. In the same ROI, the particle number of NM-II staining was also automatically quantified with the Analyze Particle plugin of FIJI. MPS or NM-II abundance was then calculated as the percentage of segment length with an MPS or particle number over the total length of axons in the ROI, respectively. EM Rat hippocampal neurons cultured in microfluidic devices (DIV14–DIV17) were treated as described for confocal microscopy ( Wang et al., 2016 ), except that 10 µg/ml CTB-HRP was added to the nerve terminal chambers for the period of stimulation. Cells were returned to growth medium for 4 h before fixation. All cells were fixed in 2.5% glutaraldehyde for 24 h. Following fixation, they were processed for 3,3′-DAB cytochemistry using the standard protocol. Fixed cells were contrasted with 1% osmium tetroxide and 4% uranyl acetate before dehydration and embedding in LX-112 resin ( Harper et al., 2011 ). Sections (∼50 nm) were cut using an ultramicrotome (UC64; Leica). To quantify CTB-HRP endocytosis, presynaptic regions were visualized at 60,000× using a transmission electron microscope (model 1011; JEOL) equipped with a Morada cooled charge-coupled device camera and the iTEM AnalySIS software. Membrane-bound compartments within the cell soma proximal region of the microfluidic channel were analyzed, and the axon diameter measured using ImageJ software.
HMM-Bayes analysis
HMM was used to predict the particle hidden states and state transition probabilities from experimental trajectories. Using Bayesian model selection in the inference process, the simplest mobility model can be selected to describe these trajectories in an objective manner ( Persson et al., 2013 ). We analyzed the trajectories from each cell of interest using HMM-Bayes software ( Monnier et al., 2015 ). A maximum of two hidden states was set to describe the trajectory movements, diffusion motion (D) and active transport state (DV), which were used to describe the undirected state and the directed state, respectively. In our cases, ≥10 channel ROIs were quantified for the control group and the blebbistatin-treated group, with corresponding trajectory numbers being 126 and 190, respectively. The D state with a low apparent diffusion coefficient state represents the immobile unattached movement. The DV state, which could be described by averaged velocity, represents the active transport attached movement. All of the analyses were performed using MATLAB (R2016a; Math Works). The average step sizes of different transport states were calculated from all D-DV models.
Statistics
We used GraphPad Prism 7 (GraphPad) for statistical analyses. Results are reported as mean ± SEM. For group comparisons, two-tailed nonparametric t tests or paired t tests were executed. P values < 0.05 indicated statistical significance. No statistical methods were used to predetermine sample sizes. Data distribution was assumed to be normal, but this was not formally tested. There was no formal randomization. Data collection and analysis were performed by different operators, who were blind to the conditions of the experiments. Online supplemental material Fig. S1 shows that the speed of Lysotracker-positive cargoes is inversely correlated with their size and supports Fig. 1 . Fig. S2 shows the axonal deformation caused by the unlabeled axonal cargoes in Lifeact-GFP–expressing neurons and supports Fig. 3 . Fig. S3 shows the effects of NM-II short-term inactivation in actin MPS and supports Fig. 4 . Fig. S4 is an extended analysis on the contractility of actin MPS, supplementing Fig. 4 . Fig. S5 shows the colocalization between p-MRLC immunostaining and the actin MPS, supporting Fig. 5 . Fig. S6 shows the immunostaining of NM-II filaments and that of periodic actin rings, supplementing Fig. 6 . Fig. S7 shows the inactivation of NM-II caused axon diameter expansion without affecting the microtubule structure or docking mitochondria, supplementing Fig. 7 . The time-lapse images of axonal trafficking of CTB and Lysotracker in microfluidic devices are shown in Videos 1 and 2 . Time-lapse SIM showing the organelle-induced axonal expansions is shown in Video 3 . Videos 4 and 5 show the cargo-induced plasma membrane deformation along the axon. Videos 6 and 7 show the cargo-induced periodic actin ring expansion along the axon. Video 8 shows the contractility of the periodic actin rings along the axon. Time-lapse images of axonal trafficking of CTB and Lysotracker in microfluidic devices perfused with Blebbistatin are shown in Videos 9 and 10 .
Online supplemental material Fig. S1 shows that the speed of Lysotracker-positive cargoes is inversely correlated with their size and supports Fig. 1 . Fig. S2 shows the axonal deformation caused by the unlabeled axonal cargoes in Lifeact-GFP–expressing neurons and supports Fig. 3 . Fig. S3 shows the effects of NM-II short-term inactivation in actin MPS and supports Fig. 4 . Fig. S4 is an extended analysis on the contractility of actin MPS, supplementing Fig. 4 . Fig. S5 shows the colocalization between p-MRLC immunostaining and the actin MPS, supporting Fig. 5 . Fig. S6 shows the immunostaining of NM-II filaments and that of periodic actin rings, supplementing Fig. 6 . Fig. S7 shows the inactivation of NM-II caused axon diameter expansion without affecting the microtubule structure or docking mitochondria, supplementing Fig. 7 . The time-lapse images of axonal trafficking of CTB and Lysotracker in microfluidic devices are shown in Videos 1 and 2 . Time-lapse SIM showing the organelle-induced axonal expansions is shown in Video 3 . Videos 4 and 5 show the cargo-induced plasma membrane deformation along the axon. Videos 6 and 7 show the cargo-induced periodic actin ring expansion along the axon. Video 8 shows the contractility of the periodic actin rings along the axon. Time-lapse images of axonal trafficking of CTB and Lysotracker in microfluidic devices perfused with Blebbistatin are shown in Videos 9 and 10 .
📊 Figures
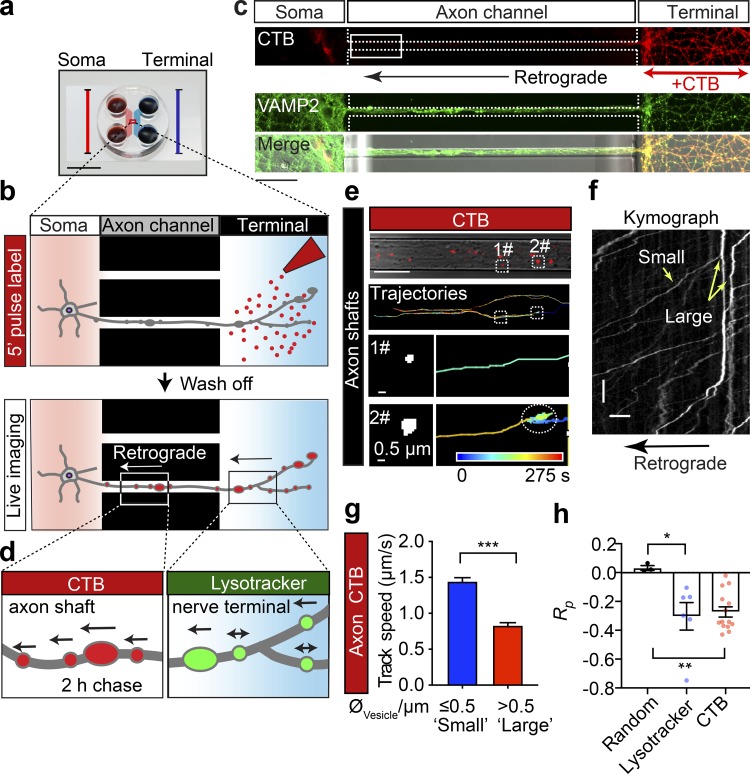
Figure 1.
The speed of retrograde axonal transport cargoes is inversely correlated with their size. (a) Microfluidic chambers isolate unidirectional axon bundles (scale bar = 1 cm; adapted from Xonamicrofluidic...
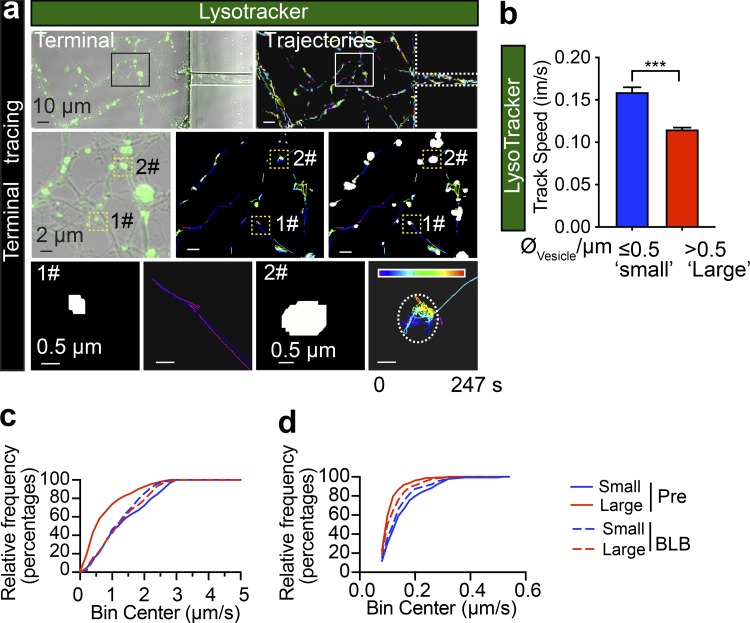
Figure S1.
The speed of Lysotracker-positive cargoes is inversely correlated with their size in axons of cultured hippocampal neurons. (a) Representative time-lapse images of Lysotracker carriers at the nerve te...
Video 1.
Retrograde trafficking of Lysotracker-labeled cargoes in the axon terminals. The retrograde trafficking of axonal cargoes labeled with Lysotracker deep red in the terminal chamber of the microfluidic ...
Video 2.
Retrograde trafficking of CTB-labeled endosomes. The retrograde trafficking flux of axonal cargoes labeled with CTB in an axon channel of a microfluidic device. From top to bottom: The CTB-labeled car...
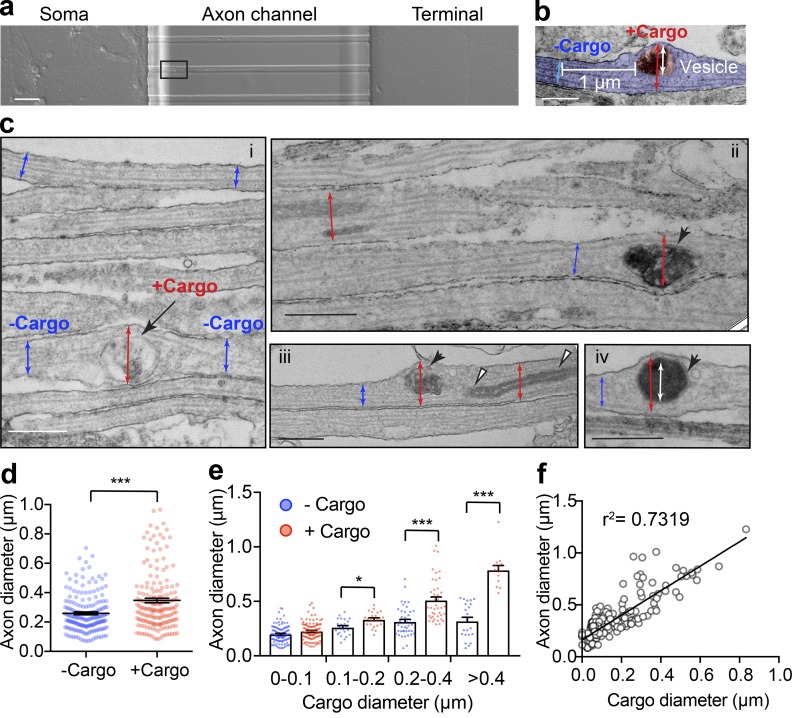
Figure 2.
The size of axonal cargoes correlates with the diameter of the axon. (a) Bright-field image of DIV14 rat hippocampal neurons cultured in a microfluidic device with the region selected for EM outlined....
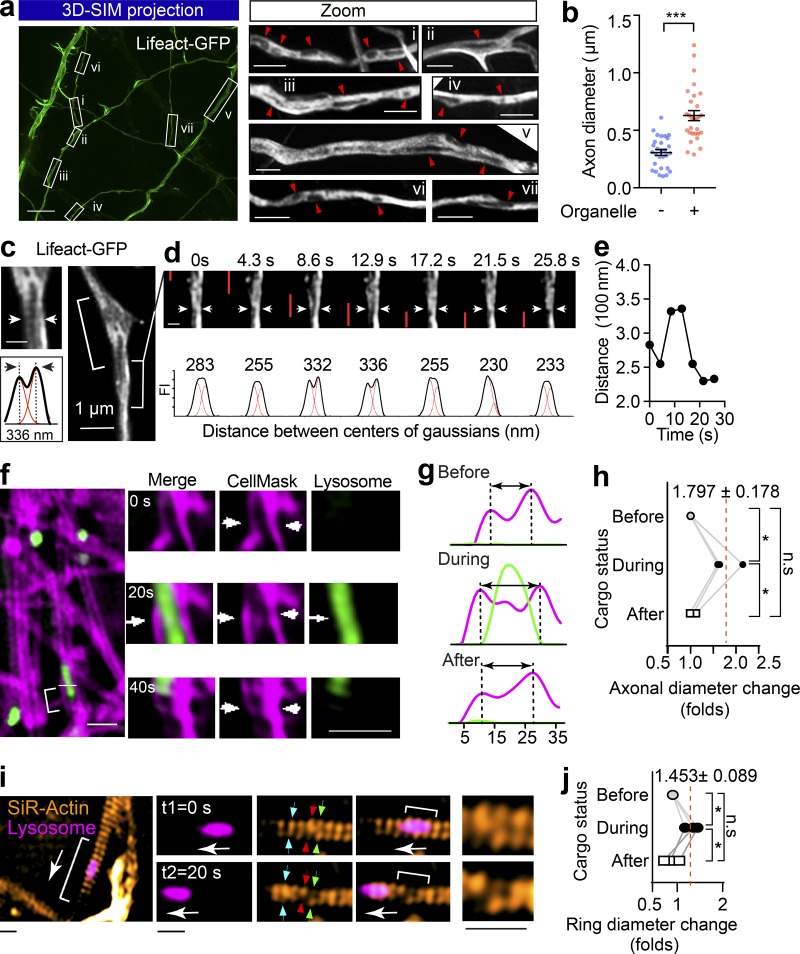
Figure 3.
The passage of large axonal cargoes causes a transient radial expansion of the axon. (a) Rat hippocampal neurons were transfected with Lifeact-GFP and imaged with 3D SIM. Left: Representative maximum ...
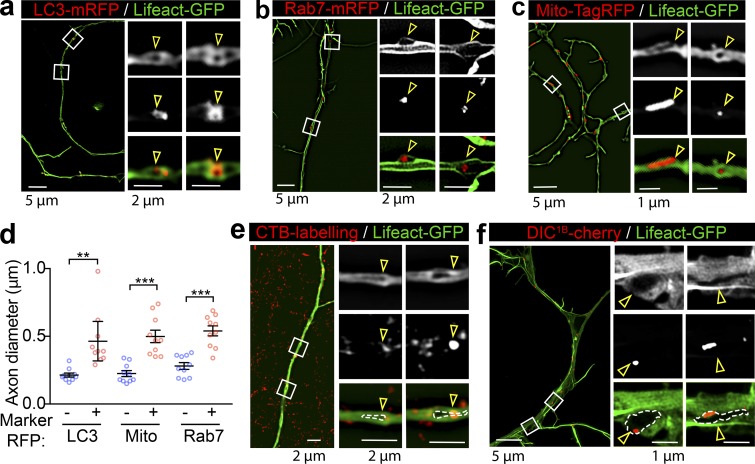
Figure S2.
Large retrograde cargoes produce fluorescence voids within the axons of Lifeact-GFP-expressing neurons. (au2013c) Cultured hippocampal neurons grown in a microfluidic device were transfected on DIV12 ...
Video 3.
The transit of cargo causes a transient radial expansion of the axon. The passage of cargo-associated black holes through the axon shafts caused an obvious mechanical stretching of the shafts, which a...
Video 4.
Radial expansion of axonal actin rings caused by passages of lysosomal cargoes. Time-lapse dual-color SIM images at 20-s intervals showing that diameter changes of periodic actin rings (SiR-actin) cor...
Video 5.
Radial expansion of axonal actin rings caused by passages of lysosomal cargoes. Time-lapse dual-color SIM images at 20-s intervals showing that diameter changes of periodic actin rings (SiR-actin) cor...
Video 6.
Radial expansion of axonal plasma membrane caused by passages of axonal cargoes. Time-lapse dual-color SIM images at 20-s intervals showing that diameter changes of axonal plasma membrane (CellMask De...
Video 7.
Radial expansion of axonal plasma membrane caused by passages of axonal cargoes. Time-lapse dual-color SIM images at 20-s intervals showing that diameter changes of axonal plasma membrane (CellMask De...
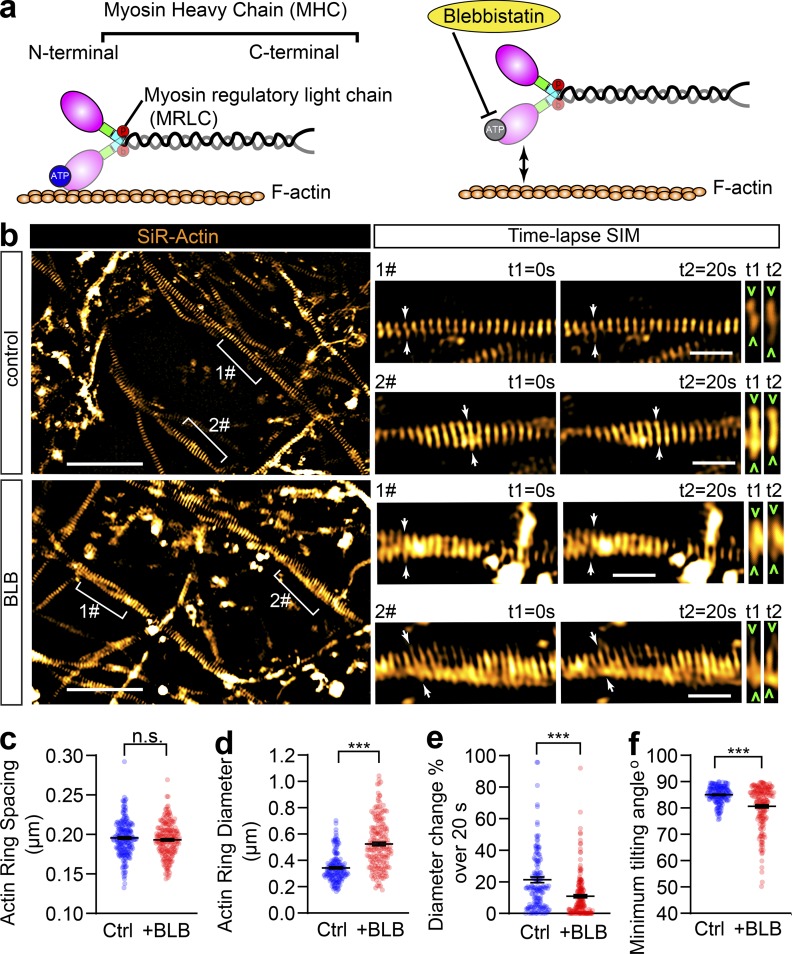
Figure 4.
Short-term inactivation of NM-II affects the diameter and angle of axonal actin rings, but not their periodic spacing. (a) Cartoon showing the organization of actomyosin structure in nonmuscle cells, ...
Video 8.
Dynamic radial contractility of periodic actin rings along axons. Time-lapse 2D SIM images at 20-s intervals showing the diameter changes of periodic axonal actin rings periodic actin rings labeled wi...
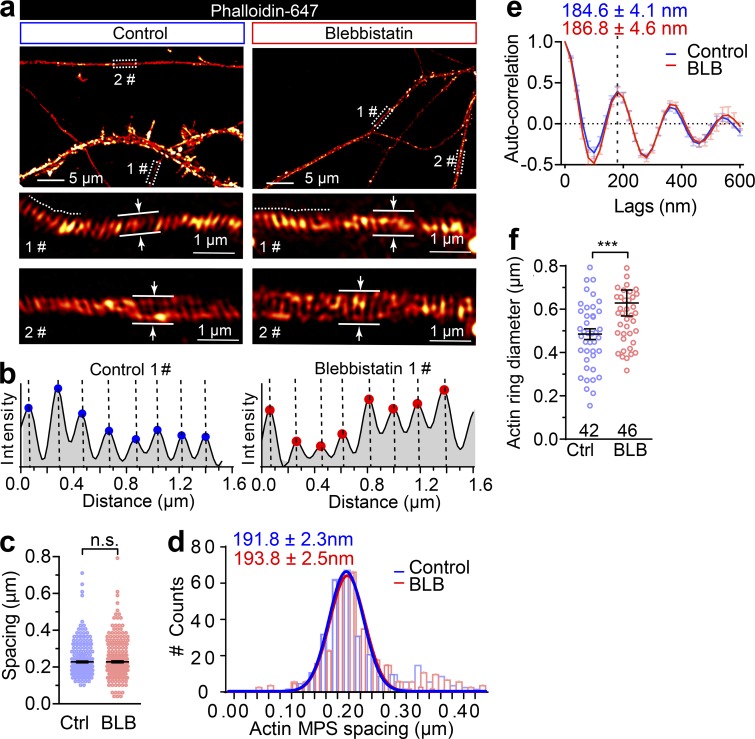
Figure S3.
Short-term inactivation of NM-II increases the axon diameter without affecting the actin ring periodicity. (a) DIV14 rat axons were stained for endogenous F-actin (phalloidin) and imaged with 3D SIM; ...
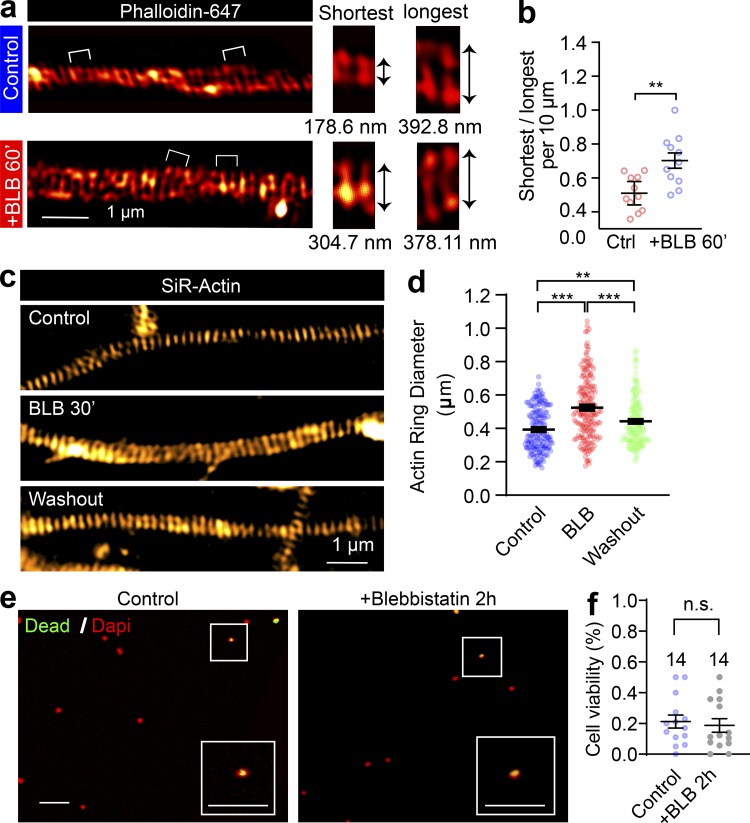
Figure S4.
The effect of blebbistatin on periodic axon actin rings is reversible. (a) SIM images of endogenous F-actin (phalloidin) along the axon of a DIV14 rat hippocampal neuron before and after short-term bl...
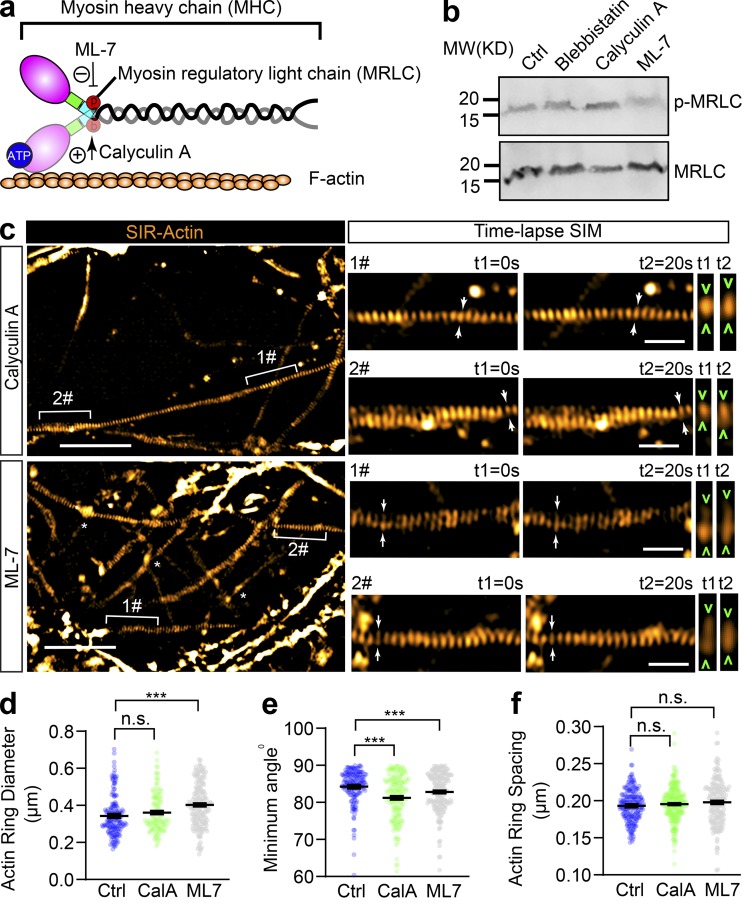
Figure 5.
Inhibition of MRLC phosphorylation slightly affects the diameter and tilting angle of axonal actin rings, but not their periodic spacing. (a) Cartoon showing the organization of actomyosin structure i...
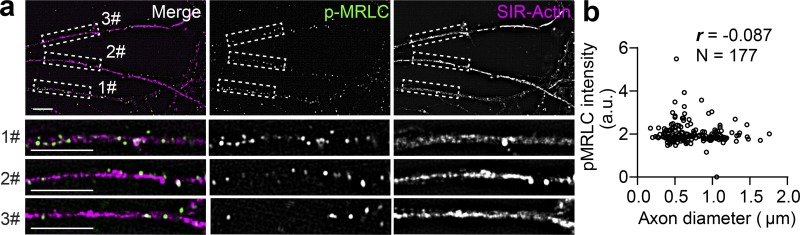
Figure S5.
The phosphorylation of MRLC is not associated with the axonal diameter. (a) In DIV14 rat hippocampal neurons, endogenous periodic axonal actin rings were labeled using SiR-actin, followed by staining ...
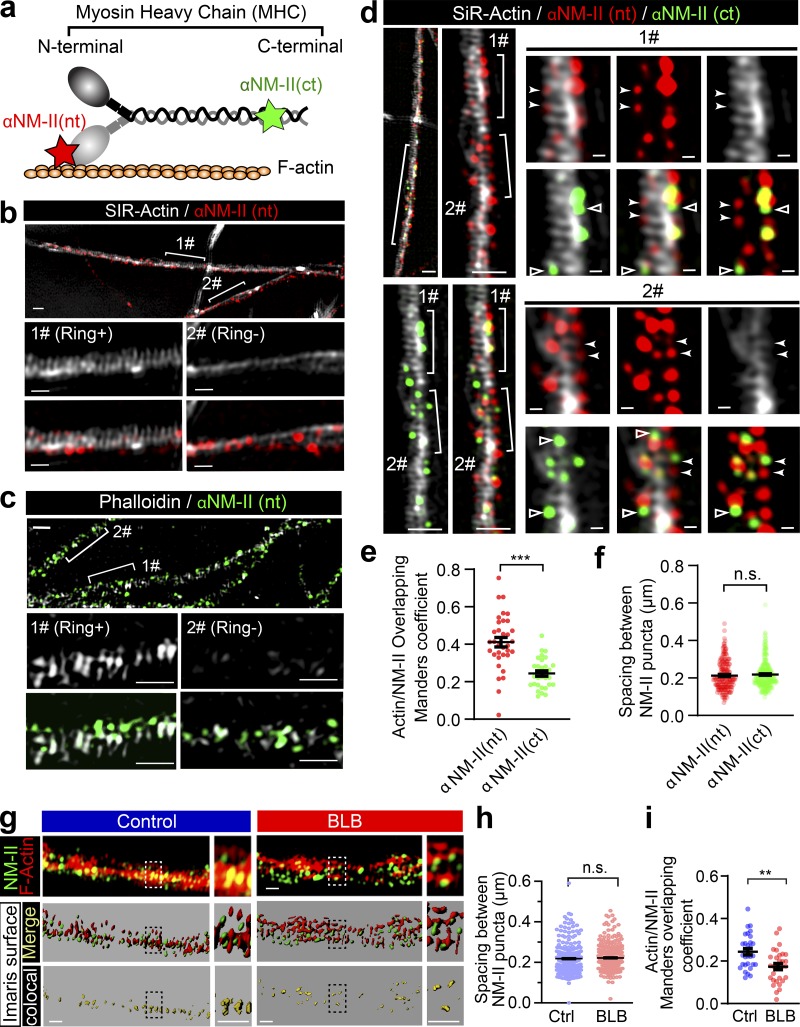
Figure 6.
Periodic actin rings correlate more extensively with the head domain than the rod domain of the NM-II filaments along axons. (a) Cartoon showing the binding site of antibodies against the NM-II head d...
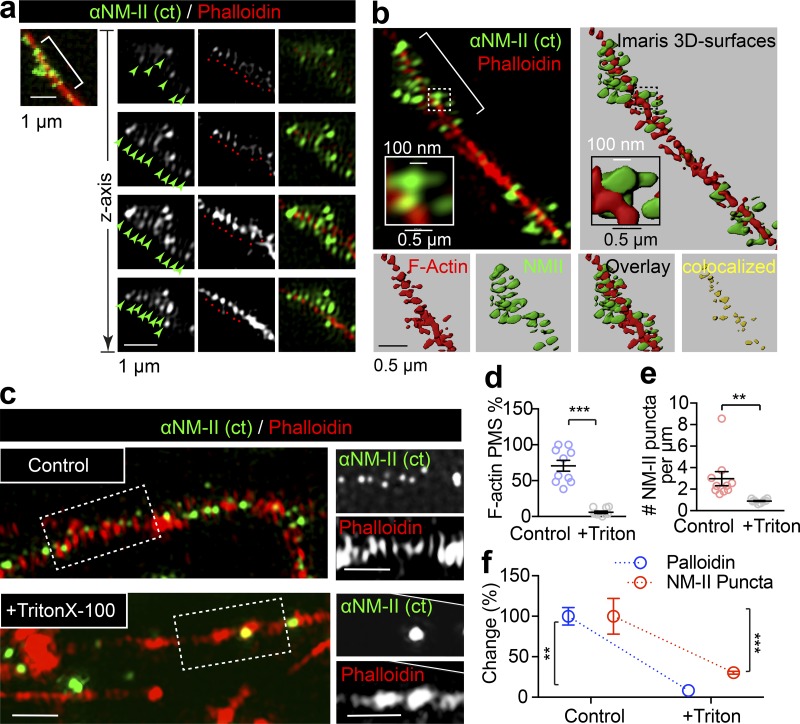
Figure S6.
NM-II immunostaining closely correlates with the periodic actin rings along the axon. (a) DIV14 rat hippocampal neurons were stained for endogenous F-actin (Phalloidin) and NM-IIB and imaged with dual...
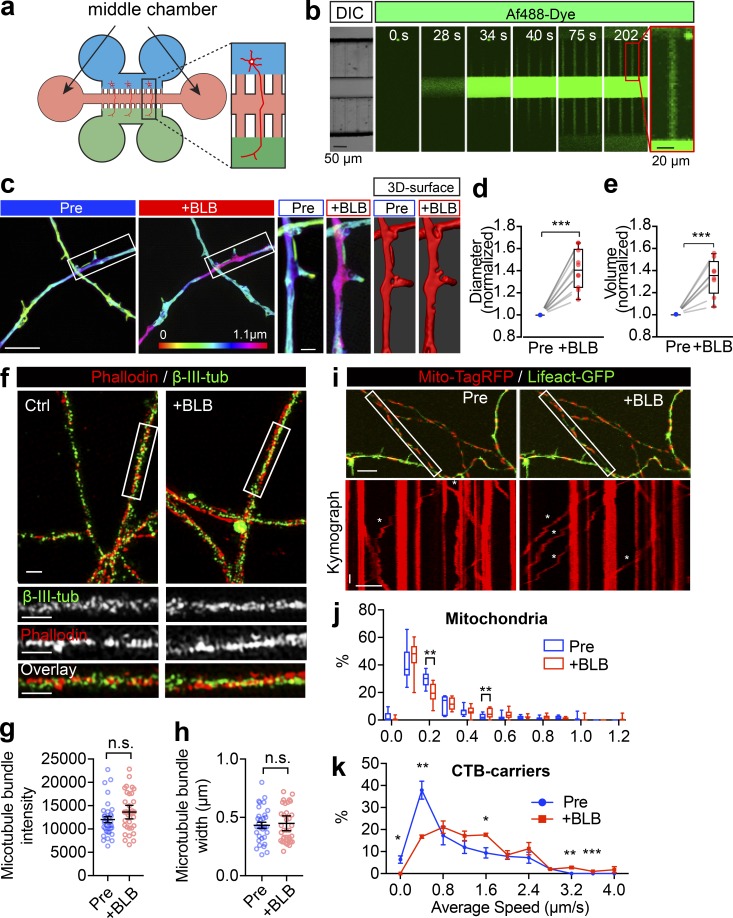
Figure S7.
Short-term inactivation of NM-II causes the axon diameter expansion without affecting the microtubule structure or docking mitochondria. (a) Schematic cartoon showing the structure of a 6-well microfl...
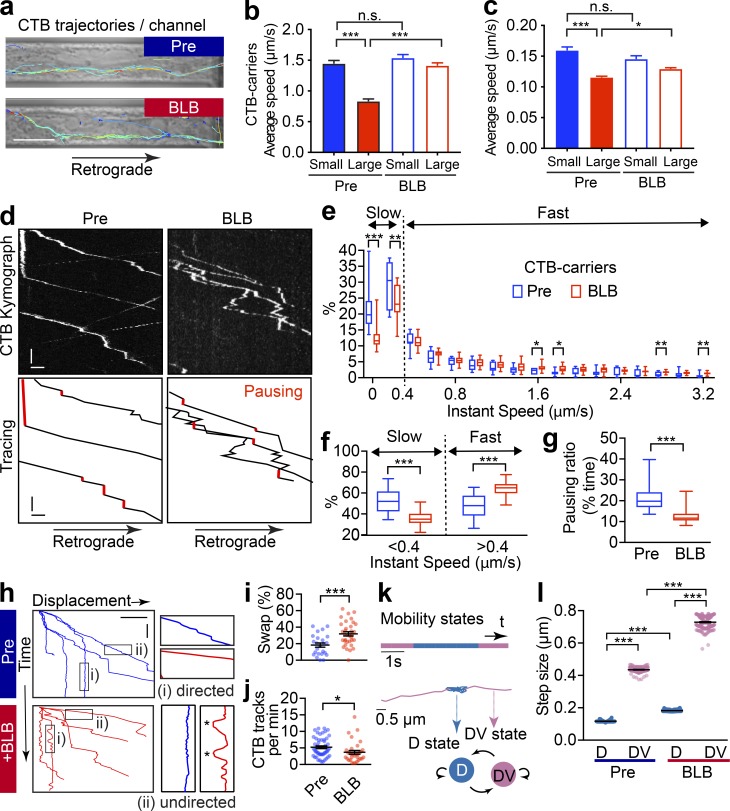
Figure 7.
Short-term inactivation of actomyosin-II reduces the efficiency of retrograde axonal trafficking. (a) DIV14 rat hippocampal neurons were cultured in microfluidic devices, and the axon segments were su...
Video 9.
Retrograde trafficking of CTB-labeled endosomes with short-term blebbistatin treatment. The retrograde trafficking flux of axonal cargoes labeled with CTB in an axon channel of a microfluidic device a...
Video 10.
Retrograde trafficking of Lysotracker-labeled endosomes after blebbistatin treatment. The retrograde trafficking of axonal cargoes labeled with Lysotracker in the terminal chamber of a microfluidic de...

Figure 8.
Long-term down-regulation of actomyosin-II activity disrupts the periodic actin rings and causes the formation of FAS. (a) Knockdown efficiency of predesigned siRNA constructs. PC12 cells transfected ...
Figure images are served from the NIH/NLM PubMed Central Open Access Subset or Europe PMC; copyright remains with the publishers and authors.
💬 Discussion
0 commentsNo comments yet. Be the first to start a discussion!
Leave a Comment