Abstract
Abstract Background Reactive oxidative stress is a critical player in the amyloid beta (Aβ) toxicity that contributes to neurodegeneration in Alzheimer’s disease (AD). Damaged mitochondria are one of the main sources of reactive oxygen species and accumulate in Aβ plaque-associated dystrophic neurites in the AD brain. Although Aβ causes neuronal mitochondria reactive oxidative stress in vitro, this has never been directly observed in vivo in the living mouse brain. Here, we tested for the first time whether Aβ plaques and soluble Aβ oligomers induce mitochondrial oxidative stress in surrounding neurons in vivo, and whether this neurotoxic effect can be abrogated using mitochondrial-targeted antioxidants. Methods We expressed a genetically encoded fluorescent ratiometric mitochondria-targeted reporter of oxidative stress in mouse models of the disease and performed intravital multiphoton microscopy of neuronal mitochondria and Aβ plaques. Results For the first time, we demonstrated by direct observation in the living mouse brain exacerbated mitochondrial oxidative stress in neurons after both Aβ plaque deposition and direct application of soluble oligomeric Aβ onto the brain, and determined the most likely pathological sequence of events leading to oxidative stress in vivo. Oxidative stress could be inhibited by both blocking calcium influx into mitochondria and treating with the mitochondria-targeted antioxidant SS31. Remarkably, the latter ameliorated plaque-associated dystrophic neurites without impacting Aβ plaque burden. Conclusions Considering these results, combination of mitochondria-targeted compounds with other anti-amyloid beta or anti-tau therapies hold promise as neuroprotective drugs for the prevention and/or treatment of AD.
🔬 Techniques
🔭 Microscopes
🧬 Organisms
💻 Software
✨ Fluorophores
🧪 Sample Preparation
🔬 Cell Lines
🏭 Microscope Brands
🧪 Reagent Suppliers
🔴 Lasers
💻 Software Details
🏷️ Research Resource Identifiers (RRIDs)
Verified research resources used in this paper:
🏛️ Research Organizations (ROR)
Affiliated research institutions:
📋 Methods
We expressed a genetically encoded fluorescent ratiometric mitochondria-targeted reporter of oxidative stress in mouse models of the disease and performed intravital multiphoton microscopy of neuronal mitochondria and Aβ plaques.
Materials and methods Animals
Animal experiments were performed under the guidelines of the Institutional Animal Care and Use Committee (IACUC, protocol #2018N000131). All experimental procedures were approved by the Institutional Animal Care and Use Committee at Massachusetts General Hospital. The following transgenic lines were used: APPswe/PSEN1∆E9 double Tg mice (heretofore APP/PS1) (The Jackson laboratory, B6.Cg-Tg(APPswe,PSEN1dE9)85Dbo/Mmjax, MMRRC Cat# 034832-JAX, RRID:MMRRC_034832-JAX) (APP/PS1, 2- to 3-months of age (young) and 8- to 10-months of age (adult)) of either sex, expressing both human APP gene carrying the Swedish mutation and exon 9 deletion mutation in the PS1 gene, and age-matched non-transgenic littermates (Wt) were used as controls; and C57BL/6 J males (4- to 5-months of age, Charles River) for the application of DTT and DTDP, conditioned media and Ru360. For conditioned media preparation, Tg2576 males (Taconic Farms, B6;SJL-Tg(APPswe)2576Kha, IMSR Cat# TAC:1349, RRID:IMSR_TAC:1349), which heterozygously overexpress human APPswe under the PrP promoter, were mated with Wt females for preparation of primary cortical neurons. Mice were socially housed with up to four animals per cage, with ad libitum access to food and water, in a 12-h light/dark cycle and controlled temperature and humidity conditions. A sample size of at least 3 mice (of either sex) was randomly allocated to experimental groups.
Show full methods section
We expressed a genetically encoded fluorescent ratiometric mitochondria-targeted reporter of oxidative stress in mouse models of the disease and performed intravital multiphoton microscopy of neuronal mitochondria and Aβ plaques.
Materials and methods Animals
Animal experiments were performed under the guidelines of the Institutional Animal Care and Use Committee (IACUC, protocol #2018N000131). All experimental procedures were approved by the Institutional Animal Care and Use Committee at Massachusetts General Hospital. The following transgenic lines were used: APPswe/PSEN1∆E9 double Tg mice (heretofore APP/PS1) (The Jackson laboratory, B6.Cg-Tg(APPswe,PSEN1dE9)85Dbo/Mmjax, MMRRC Cat# 034832-JAX, RRID:MMRRC_034832-JAX) (APP/PS1, 2- to 3-months of age (young) and 8- to 10-months of age (adult)) of either sex, expressing both human APP gene carrying the Swedish mutation and exon 9 deletion mutation in the PS1 gene, and age-matched non-transgenic littermates (Wt) were used as controls; and C57BL/6 J males (4- to 5-months of age, Charles River) for the application of DTT and DTDP, conditioned media and Ru360. For conditioned media preparation, Tg2576 males (Taconic Farms, B6;SJL-Tg(APPswe)2576Kha, IMSR Cat# TAC:1349, RRID:IMSR_TAC:1349), which heterozygously overexpress human APPswe under the PrP promoter, were mated with Wt females for preparation of primary cortical neurons. Mice were socially housed with up to four animals per cage, with ad libitum access to food and water, in a 12-h light/dark cycle and controlled temperature and humidity conditions. A sample size of at least 3 mice (of either sex) was randomly allocated to experimental groups.
Cell culture Mouse neuroblastoma cells
(N2a) were grown at 37C in a humidified incubator chamber under 5% CO 2 in OptiMEM (Gibco), supplemented with 5% fetal bovine serum (FBS) (Atlanta Biologicals), 1% penicillin, and 1% streptomycin (Gibco). Cells were plated into 8-well chamber slides (Sarstedt) at a density of 30,000 cells/well and transiently transfected using Lipofectamine 2000 (Life Technologies) according to the manufacturer’s instructions and imaged 24 h later. Primary cortical neurons were prepared as previously described [ 8 ]. Briefly, neurons were obtained from embryonic day 14 (E14) CD1 (Charles Rives Laboratories) mouse embryos. Neurons were dissociated using Papain dissociation system (Worthington Biochemical Corporation, Lakewood, NJ, USA). Cells were plated in 8-well chamber slides previously coated with poly-D-lysine at a density of 30,000 cells/well and were maintained for 10–14 days in vitro (DIV) in Neurobasal medium supplemented with 2% B27 (Gibco), 1% penicillin/streptomycin (Gibco) and 1% glutamax (Gibco) in a humidified 37 C incubator with 5% CO 2 without further media exchange. Neurons were either transfected using Lipofectamine 2000 (Life Technologies) or infected with AAV.hSyn.mt-roGFP after 12–14 DIV, and imaged 1 or 3 days later respectively. Experiments were performed after a culturing period of 12–14 DIV. Plasmids mRuby-Mito-7 was a gift from Michael Davidson (Addgene plasmid #55,874; http://n2t.net/addgene:55874 ; RRID:Addgene_55874). mRuby-ER-5 was a gift from Michael Davidson (Addgene plasmid #55,860; http://n2t.net/addgene:55860 ; RRID:Addgene_55860). Matrix-roGFP (mt-roGFP) was a gift from Paul Schumacker (Addgene plasmid #49,437; http://n2t.net/addgene:49437 ; RRID:Addgene_49437).
AAV.hsyn.mt-roGFP construction and production
DNA sequence of mt-roGFP [ 9 ] was ligated between the inverted terminal repeat sites (ITRs) of an adenovirus (AAV, serotype 2/8) packaging plasmid with human synapsin (hSyn) promoter, and the WPRE/SV40 sequence. Thus, the expression cassette included the following components: (1) a 1.7-kb sequence containing human synapsin 1 gene promoter, (2) mt-roGFP, (3) WPRE, and (4) Simian virus 40 (SV40). Human embryonic kidney (HEK) 293 T cells were co-transfected with the construct and a helper plasmid and harvested. Virus was purified and titrated by infecting HEK293T cells. Virus titer was 1.0 × 10 12 viral genome copies per mL. SS31 preparation and drug delivery SS31 (D-Arg-Dmt-Lys-Phe-NH 2 ; Dmt = 2’,6’-dimethylthyrosine) and SS20 (Phe-D-Arg-Phe-Lys- NH 2 ) were obtained from Biomatik ( https://www.biomatik.com ). SS31 and SS20 were administered intraperitoneally to APP/PS1 Tg and non-transgenic littermate mice (5 mg/kg body weight) twice a week for 8 weeks. The treatment began when the mice were 8 months of age, and the imaging sessions were carried out at 10 months of age. All mice were daily observed by a veterinarian. SS31 dose was determined based on previous studies [ 10 , 11 ], suggesting that this concentration had the maximum protective effects without any adverse side-effects or toxicity. Preparation of Wt and Tg neuronal conditioned media and Aβ-immunodepleted media, and measurement of soluble Aβ levels Primary cortical neuron cultures from Tg2576 mice, heterozygous for the hAPPswe mutation, were prepared as explained above. Tissue from each individual embryo was collected for genotyping. Primary neurons were maintained in Neurobasal media containing 2% B27 supplement, 1% penicillin/streptomycin and 1% Glutamax.
Conditioned media from either Tg cultures
(TgCM) or Wt littermates (WtCM) was collected at 14 DIV.
Measurement of soluble
Aβ levels were conducted using sandwich ELISA as previously described [ 8 ]. Briefly, CM was collected from the primary cultures, and Aβ 1-40 was measured with commercial colorimetric ELISA kit (WAKO, Wako #294–64,701 Human/Rat Aβ 1-40 ), specific for human. A 96-well plate reader was used, following the manufacturer’s instructions. Each sample was run in duplicates. Protein concentrations of the CM were determined and Aβ was expressed in nM. Additionally, human Aβ was immunodepleted from TgCM with the mouse monoclonal antibody 6E10 (Purified anti-β-Amyloid, 1–16 antibody BioLegend Cat# 803,004, RRID: AB_2715854) and Protein G Sepharose beads (Sigma-Aldrich). Protein G beads were conditioned with cold Neurobasal media. 1 mL of TgCM and 40 μL of the pre-conditioned G beads were incubated with 6 μg of 6E10 antibody overnight at 4C under rotation. Supernatant was collected and Aβ concentration quantified by colorimetric ELISA human/rat Aβ 1-40 . Aβ 1-40 concentration in the media were 0.3 nM for WtCM, 5 nM for TgCM and 0.7 nM for Aβ-immunodepleted TgCM, demonstrating an efficient immunodepletion of Aβ from the TgCM. The concentration of Aβo in the TgCM has been shown to represent around 10% of the total amount of Aβ 1-40 [ 12 ]. Stereotactic intracortical injection of AAV.hsyn.mt-roGFP For acute experiments, AAV.hSyn.mt-roGFP was injected into 4–5-month old C57BL/J6 Wt mice somatosensory cortex, as previously described [ 13 ]. Mice were anesthetized using 5% isoflurane (vol/vol) for induction and maintained at 1.5% throughout the surgery. Under a stereotactic frame (Kopf Instruments), a burr hole was drilled in the skull at 1 mm anteroposterior, 1 mm mediolateral from bregma, and AAV was injected at -0.8 mm dorsoventral. A programmable syringe pump with a 33-gauge sharp needle attached to a 10 μL Hamilton micro-syringe was used for infusion. 3 μL of viral suspension were injected at 0.15 μL/min. Body temperature was maintained throughout surgery with a heating pad. After injection, the needle was removed, and the mouse scalp sutured. Mice were put on a heating pad for recovery. For stable fluorescent expression, mice were imaged 3 weeks after injection. For chronic experiments, AAV.hSyn.mt-roGFP was injected to 9 mo-old or 3 mo-old Tg mice in the somatosensory cortex at the moment of the cranial window implantation. Mice were given buprenorphine (0.1 mg/kg) for 3 days following surgery.
Cranial window implantation
Mice were anesthetized with isoflurane, the scalp shaved and sterilized, and an incision was made to expose the underlying skull. A custom-made stereotax fixed the skull. For chronic windows, an area of skull no larger than 5-mm was removed and replaced with a glass coverslip for imaging. After craniotomy, mice were placed on a heating pad for recovery and two-photon imaging was performed 3 weeks later. For acute windows (in vivo validation and CM experiments), dura matter was removed, and 8-mm windows were implanted. Two-photon imaging was performed immediately after cranial window implantation. Mice were given buprenorphine (0.1 mg/kg) for 3 days following surgery. In vivo multiphoton microscopy imaging HS169 (10 mg/kg) was retro-orbitally injected 24 h before the imaging session to label Aβ plaques [ 14 ]. Texas Red Dextran (70,000 MW; 12.5 mg/mL in PBS; Molecular Probes) was retro-orbitally injected immediately prior to the imaging session to provide a fluorescent angiogram. Mice were anesthetized by isoflurane and head-restrained using a custom made stereotax. Images of AAV.hSyn.mt-roGFP were acquired on an Olympus FluoView FV 1000MPE multiphoton laser-scanning system mounted on an Olympus BX61WI microscope and equipped with a 25 × Olympus water immersion objective (1.05 numerical aperture (NA)). A Deep-See Mai Tai Ti:Sapphire mode-locked laser (Spectra-Physics) was used for multiphoton excitation at the following wavelengths: 800 and 900 nm for AAV.hSyn.mt-roGFP, 800 nm for HS169 and 900 nm for Texas Red Dextran. Emitted fluorescence was collected in three channels in the range of 460–500, 520–560 and 575–630 nm. All images were obtained at depths up to 200 μm from the pial surface, and were captured at a 5 × digital zoom. Five to eight cortical volumes (Z-series, 127 µm × 127 µm) were acquired per mouse, at a step size of 2 µm and a resolution of 512 × 512 pixels. Photomultiplier settings remained unchanged throughout the different imaging sessions. Laser power was adjusted as needed to avoid image saturation and kept always below 30 mW to avoid phototoxicity. For acute CM experiments and in vivo validation of AAV.hSyn.mt-roGFP, an imaging session was first performed to determine the basal resting ratio 800/900. Then, the window was opened and sealed again after application of DTT, DTDP, WtCM, TgCM, Aβ-immunodepleted TgCM, Ru360 (Calbiochem, Merck Millipore) or Ru360 + TgCM (40 μL final volume applied). Ru360 was preincubated for 15 min before application of TgCM. After either 20 min (for validation) or 1 h (for CM experiments), the same fields of view were reimaged to determine the relative changes in ratio 800/900 (ΔR/R 0 ). The fluorescent angiogram created by Texas Red Dextran helped with re-locating the same fields of view.
Image processing and quantification
RoGFP displays two excitation peaks that are sensitive to redox changes. The redox status is assessed by monitoring the ratio of GFP fluorescence emission at 800 and 900 nm excitation [ 15 , 16 ]. For the analysis of mitochondrial redox state in primary neurons, ROIs were drawn around somas and primary processes as well as in background regions outside cells. Pixel intensity was measured on images taken at two wavelengths (800 and 900 nm), and background subtracted. To calculate the fluorescent intensity ratios, the 800 nm image was divided by the 900 nm image in a pixel-by-pixel manner. All multi-photon images were analyzed using customized MATLAB scripts (MathWorks). To perform automatic segmentation of mitochondria, an adaptive thresholding procedure was applied to the in vivo images (acquired at 5 × digital zoom) to generate binary images and individual mitochondria were identified in neuronal somas and processes using a constraint on object size. Aβ plaques were manually extracted from the z-stacks. Background was subtracted from the 800 and 900 nm channel images. The ratio value of each segmented mitochondria was determined by taking of the sum of the pixels within the segmented region in the 800 nm channel and dividing it by the sum in the 900 nm channel. Pseudocolored images were generated using MATLAB by first creating the ratio image by dividing the 800 nm image by the 900 nm image on a pixel-by-pixel basis. Next, the ratio image was assigned to the RGB (Red, Green, Blue) colorspace with the color range determined by the maximal achievable redox changes that can be accomplished with DTT and DTDP treatment in vivo. The RGB image was then converted to the HSV (Hue, Saturation, Value) colorspace with the Value field being set to the overall intensity image (800 nm + 900 nm channels). Distance to Aβ plaque was measured based on the centroid of the mitochondrion to the edge of the nearest plaque. Images presented in the figures are a single slice from the z-stacks.
Immunohistochemistry
Mice were euthanized by CO 2 asphyxiation and transcardially perfused with 20 mL of PBS followed by 20 mL of 4% PFA. Brains were extracted and kept in a fixing solution (4% PFA and 30% glycerol in PBS) for 24 h, and then embedded in OCT. The OCT block was then sectioned into 20 µm coronal sections on a cryostat (Leica). Sections were first subjected to antigen retrieval, by heating with citrate buffer with Tween20 at pH 6.0, and then permeabilized with 0.5% Triton X-100, blocked with 5% normal goat serum, and incubated with target antibodies at 4C o/n (GFP (1:500, Antibodies Incorporated Cat# GFP-1020, RRID:AB_10000240), HSP60 (1:200, Abcam Cat# ab46798, RRID:AB_881444), GS (1:500, Abcam Cat# ab73593, RRID:AB_2247588), NEUN (1:500, R&D Systems Cat# MAB377, RRID:AB_2298767), Aβ (1:500, Immuno-Biological Laboratories Cat# 18,584, RRID:AB_10705431), Neurofilament SMI312F (1:1000, BioLegend Cat# 837,904, RRID:AB_2566782). Corresponding secondary antibodies (Alexa Fluor 488 1:1000 (Molecular Probes Cat# A-11039, RRID:AB_142924), Alexa Fluor 647 1:1000 (Molecular Probes Cat# A-21245, RRID:AB_141775 and Molecular Probes Cat# A-21235, RRID:AB_2535804), Alexa Fluor 594 1:1000 (Molecular Probes Cat# A-11012, RRID:AB_141359), Cy3 1:1000 (Molecular Probes Cat# A-11039, RRID:AB_142924 and Abcam Cat# ab6939, RRID:AB_955021), Cy5 1:1000 (Abcam Cat# ab97035, RRID:AB_10680176 and Jackson ImmunoResearch Labs Cat# 111–175-144, RRID:AB_2338013) were applied and incubated for 1 h at room temperature. Appropriate sections were treated with 1% ThioS, and/or cover slipped with antifade mounting medium with DAPI (Vector Laboratories, (H1500)).
Confocal microscopy
Imaging of immunostained sections ((GFP, HSP60, NeuN, GS), and (Aβ, NF)) was conducted on an Olympus Fluoview 3000 confocal microscope with a 40 × immersion objective. Applicable laser excitation wavelengths were used for optimal fluorophore excitation and emission separation and detection. Parameters were maintained for all slides within each antibody condition.
Fluorescence imaging For Aβ plaque burden analysis
(Aβ immunohistochemistry and ThioS staining), slides were scanned using an Olympus VS120-S6-W virtual slide microscope. Images were taken with a 20 × objective and analyzed using CellSens software (Olympus). A manual threshold was set to include both diffuse and dense-core plaques. These parameters were maintained constant throughout all image analyses and analyzed for total burden.
Analysis of publicly available human brain single RNA-seq datasets
The expression of 31 mitochondrial genes involved in mitochondrial antioxidant defense was compared in advanced AD Braak stages (V-VI) versus control subjects (Braak 0-I-II). Data were obtained from a public single-nucleus RNA-Seq (snRNA-seq) performed on dorsolateral prefrontal cortex samples from 48 individuals with varying levels of AD pathology [ 17 ]. The samples were grouped by Braak stage, which assesses the distribution of tau neurofibrillary tangles in the subject’s brain [ 18 ]. Multiple comparisons corrections were performed using the Benjamini–Hochberg method [ 19 ]. For the purpose of selection for visual display, a false discovery rate (FDR) threshold of 0.25 was used.
Statistics Graph Pad
Prism (version 6.0) was used for statistical analyses and data presentation. Data are reported as mean ± SEM. Either Mann–Whitney test or paired t-test were used to compare two different conditions. Kruskal–Wallis ANOVA followed by Dunn’s multiple comparisons test were used to compare three or more different conditions (e.g., CM). Statistical correlations were determined using Pearson’s correlation test. In each experiment, the number of animals, volumes, and statistical parameters can be found in the figure legend, together with the mean and standard error estimates and the p-values. p < 0.05 was considered statistically significant.
Supplementary Information Additional file 1: Fig. S1. Validation of AAV.hSyn.mt-roGFP in vitro. a. Mitochondrial co-transfection verified proper targeting of mt-roGFP to mitochondria. N2a cells (top) and primary cortical neurons (bottom) were co-transfected with mt-roGFP (green) and mRuby-Mito-7 (red) and subjected to confocal microscopy imaging. Scale bar represents 10 μm. b. Double immunolabelling of mt-roGFP (green) and mRuby-ER5 (red, targeting endoplasmic reticulum, ER) in N2a cells shows lack of colocalization and supports the mitochondrial localization of mt-roGFP. Scale bar represents 10 μm. c. In vitro imaging of cellular oxidative stress with mt-roGFP. Primary cortical neurons were exposed to either the oxidant DTDP or the reducing agent DTT. Images at 800 nm (red), 900 nm (green) and merged are shown. d. The relative changes in ratio 800/900 were represented by histograms of ratio 800/900 frequency distribution in control conditions (grey) and 20 min after exposure to DTT 1 mM (blue) and DTDP 100 μM (red) (Control, n = 143 cells; DTT 1 mM, n = 125; DTDP 100 μM, n = 109 cells). Fig. S2. Validation of pAAV.hSyn.mt-roGFP ex vivo. AAV.hSyn.mt-roGFP targets neuronal mitochondria in vivo. a. Colocalization of AAV.hSyn.mt-roGFP (green), NeuN (red) and GS (glutamine synthetase, magenta) in the mouse cortex shown by immunohistochemistry. Note that AAV.hSyn.mt-roGFP only colocalizes with the neuronal marker NeuN. Scale bar represents 10 μm. b. Colocalization of AAV.hSyn.mt-roGFP (green), HSP60 (mitochondrial marker, red) and NeuN (magenta) in the cortex shown by immunohistochemistry. Scale bar represents 10 μm. c. Inset. Colocalization of AAV.hSyn.mt-roGFP (green) and HSP60 (red) in cortex shown by immunohistochemistry (top). Scale bar 5 μm. Graph shows intensity profile of the ROI across the cell. Green line represents the fluorescence intensity of AAV.hSyn.mt-roGFP and red line represents the fluorescence intensity of HSP60. Fig. S3. Original images excited at 800nm and 900nm of Fig. 1 b. Fig. S4. Original images excited at 800nm and 900nm of Fig. 2 b. Fig. S5. Mitochondrial oxidative stress in male and female mice. Mitochondrial oxidative stress (Ratio 800/900) in neurons was compared between non-Tg and APP/PS1 Tg mice at 10 months of age within males (a) or females (b). Note that only for males the difference is significantly different (a. Males: average per field of view: non-Tg: 0.95 ± 0.026, n = 31 z-stacks; APP/PS1: 1.17 ± 0.046, n = 41 z-stacks from 5 and 9 mice respectively, ***p = 0.0001; Average per mouse: non-Tg: 0.95 ± 0.037, n = 5 mice; APP/PS1: 1.19 ± 0.073, n = 9 mice, *p=0.0190. b. Females: average per field of view: non-Tg: 1.038 ± 0.038, n = 38 z-stacks; APP/PS1: 1.17 ± 0.043, n = 19 z-stacks from 6 and 3 mice respectively; Average per mouse: non-Tg: 1.02 ± 0.08, n = 6 mice; APP/PS1: 1.19 ± 0.067, n = 3 mice). Error bars represent mean ± SEM. Fig. S6. The overall mitochondrial redox levels are not elevated in AD transgenic mouse neurons before Aβ plaque deposition. a. In vivo images of neurites and cell bodies expressing pAAV.hSyn.mt-roGFP in mitochondria in non-Tg (top) and APP/PS1 Tg mice (bottom) in young mice. Scale bar represents 10 μm. b, c. Scatter dot plot represents overall mitochondrial oxidative stress (Ratio 800/900) in non-Tg and APP/PS1 Tg mice at 3 months of age, before plaque deposition, in mitochondria in neurons (b, average per field of view, non-Tg: 0.83 ± 0.024, n = 18 z-stacks from 3 mice (3 male); APP/PS1: 0.87 ± 0.024, n = 42 z-stacks from 6 mice (3 male, 3 female); c. average per mouse, non-Tg: 0.82 ± 0.039, n = 3 mice (3 male); APP/PS1: 0.87 ± 0.034, n = 6 mice (3 male, 3 female)). Error bars represent mean ± SEM. Blue dots denote male and pink dots denote female. d. Histogram of mitochondrial oxidative stress frequency distribution (indicated by Ratio 800/900) in the young non-Tg and APP/PS1 Tg mice. e. Representative high resolution pseudocolor images of somas (top) and neurites (bottom) expressing AAV.hSyn.mt-roGFP in mitochondria in vivo in young non-Tg (left) and APP/PS1 Tg mice (right). Scale bar represents 15 or 10 μm. f. Comparison of mitochondrial oxidative stress (Ratio 800/900) within somas or neurites in 3-month-old non-Tg and APP/PS1 Tg mice. APP/PS1 Tg mice showed higher oxidative stress levels in mitochondria in neurites. Error bars represent mean ± SEM. (somas: 0.79 ± 0.023, n = 9 z-stacks from 3 non-Tg mice (3 male), and 0.75 ± 0.026, n = 10 z-stacks from 3 APP/PS1 Tg mice (1 male, 2 females); neurites: 0.82 ± 0.040, n = 9 z-stacks from 3 non-Tg mice (3 male), and 0.92 ± 0.030, n = 10 z-stacks from 3 APP/PS1 Tg mice (1 males, 4 females); *p = 0.0467). g. Comparison of mitochondrial oxidative stress (Ratio 800/900) in the different cell compartments (somas and neurites) in 3-month-old (old) non-Tg and APP/PS1 Tg mice. Neurites showed significantly higher oxidative stress levels in mitochondria in the APP/PS1 Tg mouse when compared to the somas. Error bars represent mean ± SEM. (Young non-Tg: 0.79 ± 0.023 for somas and 0.82 ± 0.040 for neurites, n = 9 z-stacks from 3 mice (3 male); Young APP/PS1: 0.75 ± 0.026 for somas and 0.92 ± 0.030 for neurites, n = 10 z-stacks from 3 mice (1 male, 2 female), ***p = 0.0003). Blue dots denote male and pink dots denote female. Fig. S7. Original images excited at 800nm and 900nm of Fig. 3 b. Fig. S8. Original images excited at 800nm and 900nm of Fig. 4 a. Fig. S9. Original images excited at 800nm and 900nm of Fig. 5 a. Fig. S10. SS31 reduces Aβ-associated dystrophic neurite number but not amyloid burden in the AD transgenic mouse. a. Representative images of the global amount of amyloid in the cortex of SS31 and SS20 treated APP/PS1 mice at 10 mo of age after Aβ immunostaining. Scale bar represents 100 μm. b. Scatter dot plots represent the quantification of amyloid load in the cortex after anti-Aβ immunostaining or ThioS labeling. The number of dense-core plaques detected by ThioS (top) and the overall load of Aβ (bottom) was comparable among SS31 and SS20 APP/PS1 treated mice. n = 7 mice per condition. Histograms represent the dense core plaque (top) and diffuse amyloid deposit (bottom) size in both conditions. c. Representative images of neuritic dystrophies (arrow heads, neurofilaments in green) around amyloid plaques (blue) in APP/PS1 mouse after either SS31 or SS20 treatment. Scale bar 20 μm. d. Scatter dot plot represents the quantification of the number of dystrophic neurites observed per plaque, n = 362 plaques from 4 SS31 APP/PS1 treated mice and n = 295 plaques from 4 SS31 APP/PS1 treated mice, **p < 0.05. e. Scatter dot plot represents the percentage of plaques showing dystrophic neurites, n = 4 – 5 areas per 4 mouse per condition, *p = 0.022. Additional file 2: Supplemental Table 1. Analysis of neuronal mitochondrial antioxidant capacity in AD vs. normal aging brain. The expression levels for genes encoding antioxidant enzymes (CAT, GLRX, GPX, GSR, GST, IDH, PRDX, ME, NNT, SOD2, TXN2, and TXNRD) were compared between control (B1, Braak NFT stages 0/I/II) and AD (B3, Braak NFT stages V/VI) individuals of a publicly available human single-nuclei RNA-seq [44]. The average expression level for each gene and group are shown, together with the log fold change and the adjusted p-value of the individual gene models, and the z-scores and the p-values of the mixed models.
📊 Figures
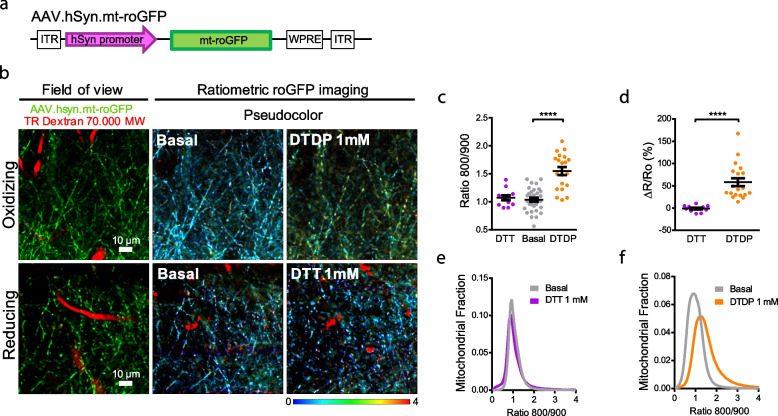
Fig. 1
AAV.hSyn.mt-roGFP expresses in neuronal mitochondria and is functional in vivo . a Diagram of construct of AAV.hSyn.mt-roGFP.WPRE. b Validation of pAAV.hSyn.mt-roGFP in vivo . 4-mo-old C57Bl/6 mice we...
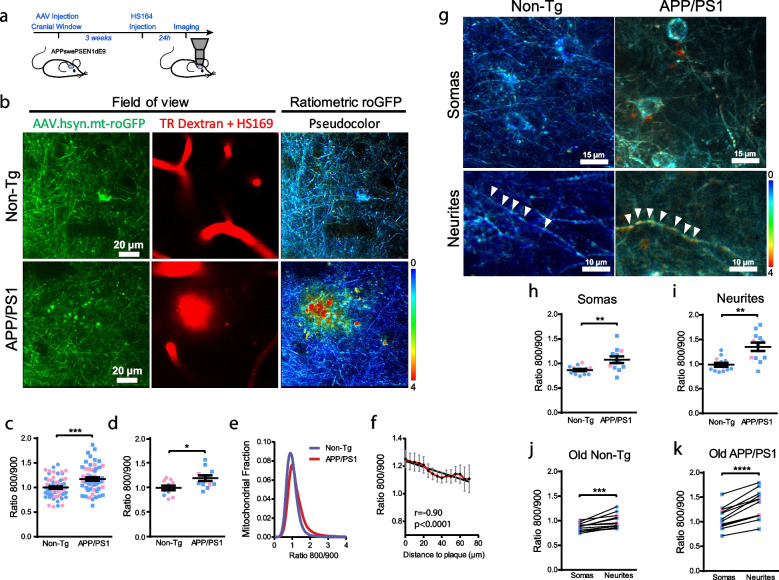
Fig. 2
Mitochondrial oxidative stress in AD transgenic mouse neurons after Au03b2 plaque deposition. a Experimental procedure to determine oxidative stress in neuronal mitochondria in mice. APP/PS1 Tg and no...
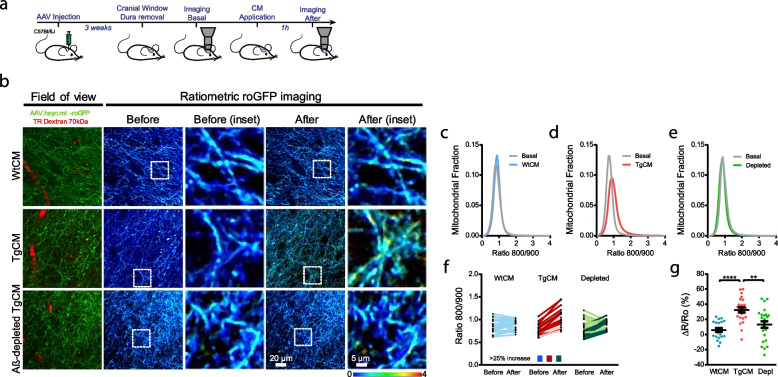
Fig. 3
Soluble Au03b2 oligomers increase oxidative stress in mitochondria in neurons in vivo . a Experimental procedure to determine the effects of Au03b2o on mitochondrial oxidative stress in the healthy mo...
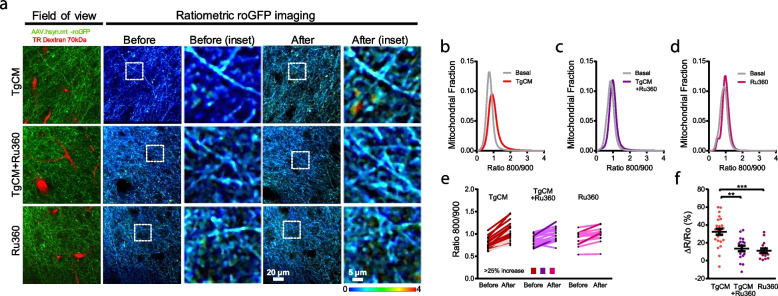
Fig. 4
Inhibition of the MCU prevents neurons from mitochondrial oxidative stress. a Representative pictures of the effects of the inhibition of the MCU on the mitochondrial oxidative stress induced by TgCM ...
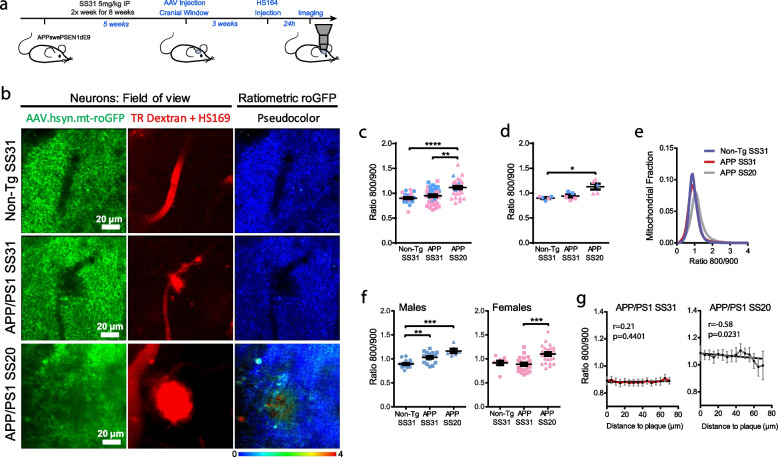
Fig. 5
The antioxidant targeted to mitochondria SS31 reduces mitochondrial oxidative stress in AD transgenic mouse neurons. a. Experimental procedure to determine oxidative stress in neuronal mitochondria in...
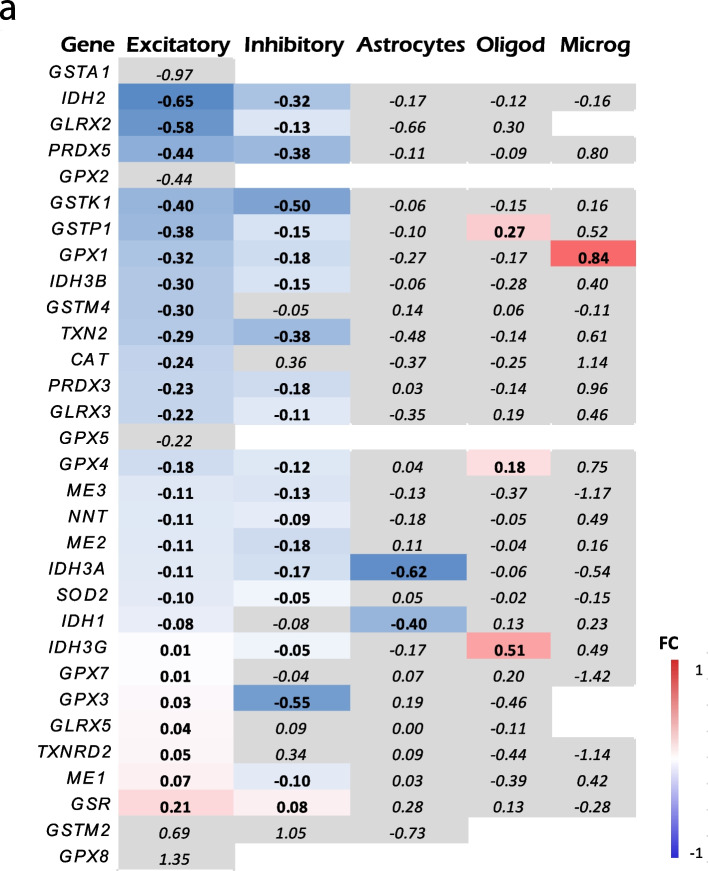
Fig. 6
Single cell RNA-seq shows a decrease in the mitochondrial antioxidant defense in neurons. a . Heat map representing fold change (FC) of the expression of genes encoding proteins involved in mitochondr...
Figure images are served from the NIH/NLM PubMed Central Open Access Subset or Europe PMC; copyright remains with the publishers and authors.
💬 Discussion
0 commentsNo comments yet. Be the first to start a discussion!
Leave a Comment