Abstract
BACKGROUND: The human glomerulus is the primary filtration unit of the kidney, and contains the Glomerular Filtration Barrier (GFB). The GFB had been thought to comprise 3 layers - the endothelium, the basement membrane and the podocyte foot processes. However, recent studies have suggested that at least two additional layers contribute to the function of the GFB, the endothelial glycocalyx on the vascular side, and the sub-podocyte space on the urinary side. To investigate the structure of these additional layers is difficult as it requires three-dimensional reconstruction of delicate sub-microscopic (<1 μm) cellular and extracellular elements. METHODS: Here we have combined three different advanced electron microscopic techniques that cover multiple orders of magnitude of volume sampled, with a novel staining methodology (Lanthanum Dysprosium Glycosaminoglycan adhesion, or LaDy GAGa), to determine the structural basis of these two additional layers. Serial Block Face Scanning Electron Microscopy (SBF-SEM) was used to generate a 3-D image stack with a volume of a 5.3 x 105 μm3 volume of a whole kidney glomerulus (13% of glomerular volume). Secondly, Focused Ion Beam milling Scanning Electron Microscopy (FIB-SEM) was used to image a filtration region (48 μm3 volume). Lastly Transmission Electron Tomography (Tom-TEM) was performed on a 0.3 μm3 volume to identify the fine structure of the glycocalyx. RESULTS: Tom-TEM clearly showed 20 nm fibre spacing in the glycocalyx, within a limited field of view. FIB-SEM demonstrated, in a far greater field of view, how the glycocalyx structure related to fenestrations and the filtration slits, though without the resolution of TomTEM. SBF-SEM was able to determine the extent of the sub-podocyte space and glycocalyx coverage, without additional heavy metal staining. Neither SBF- nor FIB-SEM suffered the anisotropic shrinkage under the electron beam that is seen with Tom-TEM. CONCLUSIONS: These images demonstrate that the three dimensional structure of the GFB can be imaged, and investigated from the whole glomerulus to the fine structure of the glycocalyx using three dimensional electron microscopy techniques. This should allow the identification of structural features regulating physiology, and their disruption in pathological states, aiding the understanding of kidney disease.
🔬 Techniques
🧪 Sample Preparation
🔬 Cell Lines
🏭 Microscope Brands
📷 Detectors
💻 Software Details
🏛️ Research Organizations (ROR)
Affiliated research institutions:
📋 Methods
Here we have combined three different advanced electron microscopic techniques that cover multiple orders of magnitude of volume sampled, with a novel staining methodology (Lanthanum Dysprosium Glycosaminoglycan adhesion, or LaDy GAGa), to determine the structural basis of these two additional layers.
Serial Block Face Scanning Electron Microscopy
(SBF-SEM) was used to generate a 3-D image stack with a volume of a 5.3 x 10 5 μm 3 volume of a whole kidney glomerulus (13% of glomerular volume). Secondly, Focused Ion Beam milling Scanning Electron Microscopy (FIB-SEM) was used to image a filtration region (48 μm 3 volume). Lastly Transmission Electron Tomography (Tom-TEM) was performed on a 0.3 μm 3 volume to identify the fine structure of the glycocalyx.
Methods Tissue fixation and processing
All rat experiments were conducted in accordance with UK Home Office regulations. Rat Kidney: Intracardiac perfusion of a glutaraldehyde fixative containing lanthanum and dysprosium to stain the glycosaminoglycans (Lanthanum Dysprosium GlycosAminoGlycan adhesion method (LaDy GAGa)) was carried out as previously described [ 17 ]. A male Sprague Dawley rat was injected with a lethal dose of 0.7 ml/kg sodium pentobarbitone (Lethobarb, Ayrton Saunders Ltd UK), the thorax promptly opened and the left side of the heart perfused at 100 mmHg pressure with a flush solution of HEPES buffered mammalian Ringer containing 0.5% LaNO 3 .6H 2 O, 0.5% DyCl 3 .6H 2 O, (room temperature, pH 7.3). Heparin anticoagulant was not used because of potential cross-reaction with the lanthanides in solution. Flushing with a 3 ml bolus was followed by 100 ml of 2.5% glutaraldehyde, 2% sucrose in the same solution as above (room temperature, pH 7.3). Tissues started to stiffen within 30 seconds. Samples 1 mm in diameter were cut from each kidney and stored at 4ºC for 2 days to several weeks in buffered glutaraldehyde. Tissues were washed with HEPES buffer and transferred to 0.1 M sodium cacodylate buffer (pH 7.3), postfixed in 1% OsO 4 in 0.1 M cacodylate buffer (pH 7.3) for 1 h and rinsed in 0.1 M sodium cacodylate buffer (pH 7.3). After Osmication, tissues were washed in distilled water, Fixed/stained with 2-3% aqueous uranyl acetate [~12 hrs, 4ºC], dehydrated in a graded series of ethanol, infiltrated with Araldite resin mixtures with propylene oxide and Araldite resin alone and then embedded in Araldite resin (Agar Scientific, UK). A Human tissue block was prepared from an unused transplant kidney by perfusion fixation. However, additional aqueous heavy metal steps were applied using an adapted West et al [ 18 ] protocol (See Additional file 1 ). Dehydration and resin infiltration used the rat protocol. Research involving human subjects was performed with appropriate consent, and after review by UK research ethics committee (study approval 07/H0102/45) in accordance with UK legislation and the Helsinki Declaration.
Show full methods section
Here we have combined three different advanced electron microscopic techniques that cover multiple orders of magnitude of volume sampled, with a novel staining methodology (Lanthanum Dysprosium Glycosaminoglycan adhesion, or LaDy GAGa), to determine the structural basis of these two additional layers.
Serial Block Face Scanning Electron Microscopy
(SBF-SEM) was used to generate a 3-D image stack with a volume of a 5.3 x 10 5 μm 3 volume of a whole kidney glomerulus (13% of glomerular volume). Secondly, Focused Ion Beam milling Scanning Electron Microscopy (FIB-SEM) was used to image a filtration region (48 μm 3 volume). Lastly Transmission Electron Tomography (Tom-TEM) was performed on a 0.3 μm 3 volume to identify the fine structure of the glycocalyx.
Methods Tissue fixation and processing
All rat experiments were conducted in accordance with UK Home Office regulations. Rat Kidney: Intracardiac perfusion of a glutaraldehyde fixative containing lanthanum and dysprosium to stain the glycosaminoglycans (Lanthanum Dysprosium GlycosAminoGlycan adhesion method (LaDy GAGa)) was carried out as previously described [ 17 ]. A male Sprague Dawley rat was injected with a lethal dose of 0.7 ml/kg sodium pentobarbitone (Lethobarb, Ayrton Saunders Ltd UK), the thorax promptly opened and the left side of the heart perfused at 100 mmHg pressure with a flush solution of HEPES buffered mammalian Ringer containing 0.5% LaNO 3 .6H 2 O, 0.5% DyCl 3 .6H 2 O, (room temperature, pH 7.3). Heparin anticoagulant was not used because of potential cross-reaction with the lanthanides in solution. Flushing with a 3 ml bolus was followed by 100 ml of 2.5% glutaraldehyde, 2% sucrose in the same solution as above (room temperature, pH 7.3). Tissues started to stiffen within 30 seconds. Samples 1 mm in diameter were cut from each kidney and stored at 4ºC for 2 days to several weeks in buffered glutaraldehyde. Tissues were washed with HEPES buffer and transferred to 0.1 M sodium cacodylate buffer (pH 7.3), postfixed in 1% OsO 4 in 0.1 M cacodylate buffer (pH 7.3) for 1 h and rinsed in 0.1 M sodium cacodylate buffer (pH 7.3). After Osmication, tissues were washed in distilled water, Fixed/stained with 2-3% aqueous uranyl acetate [~12 hrs, 4ºC], dehydrated in a graded series of ethanol, infiltrated with Araldite resin mixtures with propylene oxide and Araldite resin alone and then embedded in Araldite resin (Agar Scientific, UK). A Human tissue block was prepared from an unused transplant kidney by perfusion fixation. However, additional aqueous heavy metal steps were applied using an adapted West et al [ 18 ] protocol (See Additional file 1 ). Dehydration and resin infiltration used the rat protocol. Research involving human subjects was performed with appropriate consent, and after review by UK research ethics committee (study approval 07/H0102/45) in accordance with UK legislation and the Helsinki Declaration.
Tissue block preparation SBF-SEM
Tissues blocks with glomeruli of interest were demarcated and each trimmed to approximately a 500 μm × 500 μm block face with less than 2 mm depth using a razor blade. The blocks were mounted using cyanoacrylate adhesive (Permabond) onto a 3 mm head diameter aluminium mounting pin. The pin head and block were sputter-coated with gold ready for SEM. The trimmed mounted block was attached to the chuck and the resin embedded glomeruli were sectioned using a Gatan 3view ultramicrotome within an FEI Quanta 250 scanning electron microscope (SBF-SEM). This technique, based on the work of Denk and Horstman [ 19 ] allows a backscattered electron image of the block face to be collected after each diamond knife cut (Figure 2 A). Figure 2 Illustration of methods for SBF-SEM, FIB-SEM and Tom-TEM. A : Illustration of the imaging procedure for SBF-SEM and FIB-SEM. The scanning electron beam (centre) raster scans a specific area of the surface and backscattered (or secondary electron) micrographs are collected. For SFB-SEM (left) the sample is raised and then cut with a diamond knife, for FIB-SEM (right) a focused ion beam mills a layer from the surface before returning to the scanning mode. B: Secondary Electron and C: Backscattered Electron Micrographs from SFB-SEM. P = Podocyte, GBM = Glomerular basement membrane and C = Capillary Lumen. * Knife mark is less visible in C than B . Scale Bars = 1 μm D : Electron tomography (Tom-TEM) The electron beam passes through the sample. The sample is tilted so that images are taken at different angles without moving the detector (camera). The images at known viewing angles can then be reconstructed, for example using weighted back-projection, to produce a 3D image of the sample. Once set up inside the microscope an automatic routine imaged the surface, advanced the specimen and sectioned the block face removing a 150 nm thick resin section (50 to 200 nm thickness is possible for resin embedded material). The knife was moved away from the block and the surface re-imaged. The sequence of advance, cut, clear (the block), image was repeated until all the images were acquired. Multiple images were stacked together to build up a three-dimensional reconstruction of the original sample. The data stack was imaged using backscattered electron detection at 2.5 kV, on a 2048 × 2048 array with 25 μs dwell time at a chamber pressure of 0.56 mbar in a water vapour atmosphere to earth and reduce sample charging. Each cut was a 150 nm slice. The detected depth is expected to be under 10 nm where there is stain. Five hundred images were taken giving an overall volume of 84 μm × 84 μm × 75 μm. This relates to a 41 nm × 41 nm × 150 nm voxel size. FIB-SEM Firstly, an 80 nm thick survey section was imaged with a Philips 100CM TEM to map the surface of the block. The block was then trimmed with an ultramicrotome to place the region of interest (ROI) at the edge of the block. The ROI with surrounding resin was removed from the resin block, stuck to a metal pin with conductive carbon cement and then sputter-coated with gold to increase conductivity. Once the ROI was identified by SEM, the block was tilted to 52º and trenches milled with a focused gallium ion beam (Ga + ) either side of the image area. A 1 μm layer of platinum was applied along the expected ROI cutting area by gas injection negating the requirement for a water vapour atmosphere to reduce charging. The area was imaged at 52° and then 10 nm resin depth was milled away by the Ga + ion beam. The image–mill sequence was repeated for the required depth (Figure 2 A). Backscattered electron contrast imaging was used at 4096 × 3536 pixels for 10 μs dwell time, resulting in voxel dimension of 1.04 nm × 1.32 nm × 10 nm. The pressure and accelerating voltage were 2.54 × 10 -10 mbar and 2 kV respectively. Tom-TEM Tom-TEM was carried out as previously described [ 17 ]. In brief, 80 nm thick survey sections used to locate vessels of interest and serial 300 nm thick sections for tomography were cut with a Reichert-Jung Ultracut E microtome and mounted on Pioloform support films on slot grids. Gold beads of 10 nm diameter (fiducial markers: Aurion, Wageningen, Netherlands) were carefully added to both sides without dilution. The gold bead suspension was sonicated to reduce coagulation and grids were placed in a drop of suspension for 20 minutes, turning the grid over after 10 minutes, and then excess liquid was removed with blotting paper. Tom-TEM was performed with an FEI T20 200 kV electron microscope with a Fishione 2040 dual tilt holder. Once in the microscope the section was pre-shrunk using methods described in Mantell et al [ 20 ] adapted from [ 21 ]. Briefly, the section was aligned under low dose protocols, tilted to 45° and 60 one second exposure micrographs were taken at the intended beam intensity. By observation of movement of the fiducial markers the original thickness could be calculated. GFB tomogram micrographs were imaged with the section tilted in increments of 1º in a minimum range between -60° and +60° using an Eagle 4096 × 4096 CCD camera (FEI) at 29,000× magnification (0.37 nm/pixel). The exposure time was 2.0 s for the 0° view and was increased for each degree up to 3.2 s for ±60° views to account for the increase of section thickness at higher viewing angles (Figure 2 D). FEI automated tomography acquisition software (with a small degree of manual intervention) was used to acquire the images into a 16-bit MRC file stack. The process was repeated for the same section location with a second tilt axis at 90° (in the x-y plane) to the first. The two tilted image series were reconstructed into a single 3D density image stack using IMOD tomogram reconstruction software [ 22 , 23 ]. It was noted that a careful auto-focus set-up and a steady beam intensity, though not imperative, significantly improved the ease of reconstruction.
Analysis
Image analysis was performed with ImageJ (NIH) [ 24 ] but additionally a combination of IMOD [ 23 ], Amira (Visage Imaging) and Fiji [ 25 ] were also used. Tom-TEM reconstructions and general large file data stack manipulations of FIB-SEM and SBF-SEM were performed with IMOD. Amira was used for segmentation. Fiji was used for image registration, 3D visualisation and other analysis. To determine glycocalyx fibre spacings in the reconstructed tomogram an autocorrelation method was used from previous publications [ 26 , 27 ]. In brief: X image areas (150 nm by 150 nm) containing glycocalyx were chosen in a reconstruction slice. These were extracted at the same coordinates for every slice if the area contained glycocalyx. To these areas a taper to the intensity mean was added followed by a fast Fourier transform. After this the autocorrelation function was performed leaving a correlation map in real space. Radial profiles were then taken in a direction parallel to the membrane. All positive peaks in the profile were found using the second differential where the distance is a predominant spacing. The peaks were only used if they were above a threshold value determined by the second differential value of control (blank resin) areas.
Supplementary Material Additional file 1 Supplementary Material. Additional heavy metal staining of human blocks. Click here for file Additional file 2 Video S3A. SBF-SEM backscatter imaging of glomerular glycocalyx. 500 z slice (150nm) sequence from SBF-SEM backscatter imaging of glomerular glycocalyx. Scale bar= 20μm. Click here for file Additional file 3 Video S3B. SBF-SEM backscatter imaging of glomerular glycocalyx (Inverted) contrast image rotation of 3D surface projection. Scale bar= 20μm. Click here for file Additional file 4 Video S3C. SBF-SEM backscatter imaging of glomerular glycocalyx. The block segmented by intensity thresholding to reveal glycocalyx stain. Scale bar= 20μm. Click here for file Additional file 5 Video S4A. Serial Block Face Scanning Electron Microscopy of a human glomerulus. 500 slice (150nm) sequence of complete field of view. Scale bar = 10μm. Click here for file Additional file 6 Video S4B. Serial Block Face Scanning Electron Microscopy of a human glomerulus. As Video S4A but with colour assignment (segmentation). Purple/Pink = Capillaries. Green = Podocyte cell body. Yellow is SPS under the main cell body. Scale bar = 10μm. Click here for file Additional file 7 Video S4C. Serial Block Face Scanning Electron Microscopy of a human glomerulus. A podocyte cell body on capillaries after segmentation in 3D projection. Purple/Pink = Capillaries. Green = Podocyte cell body. Yellow is SPS under the main cell body. Scale bar = 10μm. Click here for file Additional file 8 Video S4D. Serial Block Face Scanning Electron Microscopy of a human glomerulus. As Video S4C without the capillaries. Green = Podocyte cell body. Yellow is SPS under the main cell body. Scale bar = 10μm. Click here for file Additional file 9 Video S5A. Micrographs of the Human Glomerulus demonstrating interpodocyte space. 300 Slice (150nm) sequence. Scale Bar = 10μm. Click here for file Additional file 10 Video S5B. Micrographs of the Human Glomerulus demonstrate interpodocyte space. As Video S5B but with interpodocyte space segmented (yellow) and highlighted. Scale Bar = 10μm. Click here for file Additional file 11 Video S5C. Micrographs of the Human Glomerulus demonstrate interpodocyte space. The extracted IPS as a 3D volume. The brown arrows point to the 2 connections with larger IPS. One is a substantial connection (circa 5μm wide, though filled with podocyte cell bodies), but the other connection is highly tortuous and very narrow if it connects at all. Between the two ‘bulbs’ of IPS is a narrow (
📊 Figures
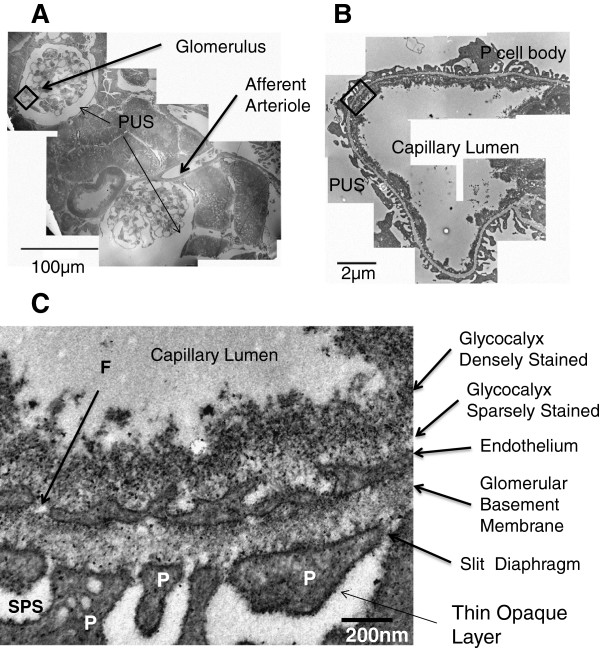
Figure 1
Structure of the glomerular filtration barrier. Transmission electron microscopy of a perfusion fixed rat glomerulus with addition of LaDy GAGa stain (section 80u00a0nm thick). A : A montage of low ma...
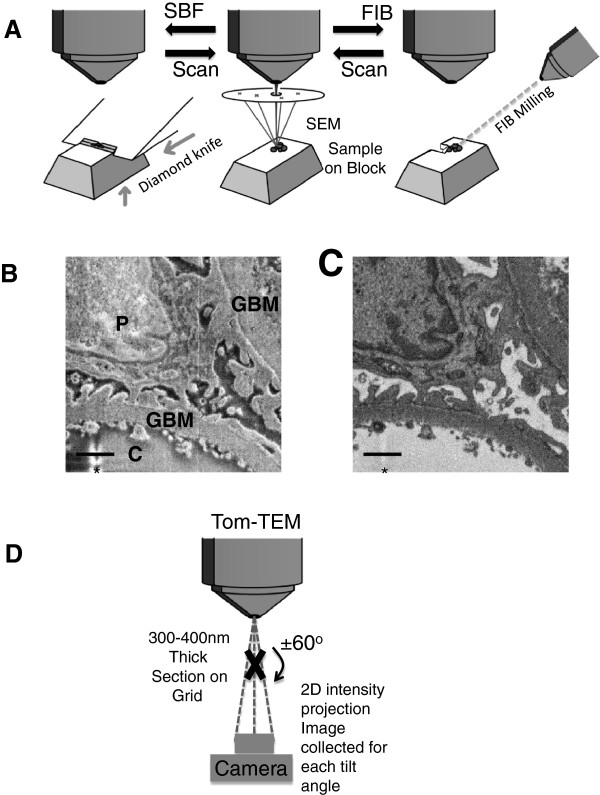
Figure 2
Illustration of methods for SBF-SEM, FIB-SEM and Tom-TEM. A : Illustration of the imaging procedure for SBF-SEM and FIB-SEM. The scanning electron beam (centre) raster scans a specific area of the sur...
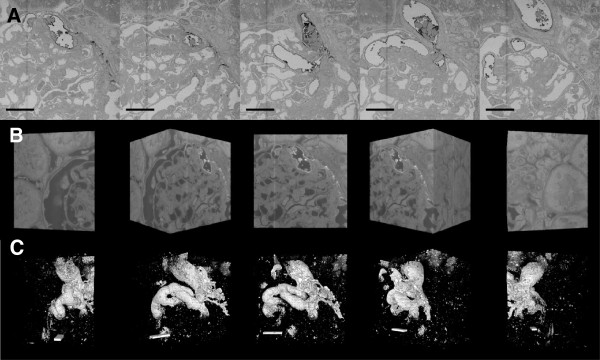
Figure 3
SBF-SEM contrast imaging of glomerular glycocalyx. A : Section sequence (every 7.5u00a0u03bcm) from raw data stack (71u00a0u03bcm u00d7 71u00a0u03bcm u00d7 84u00a0u03bcm) The LaDy GAGa stained compone...
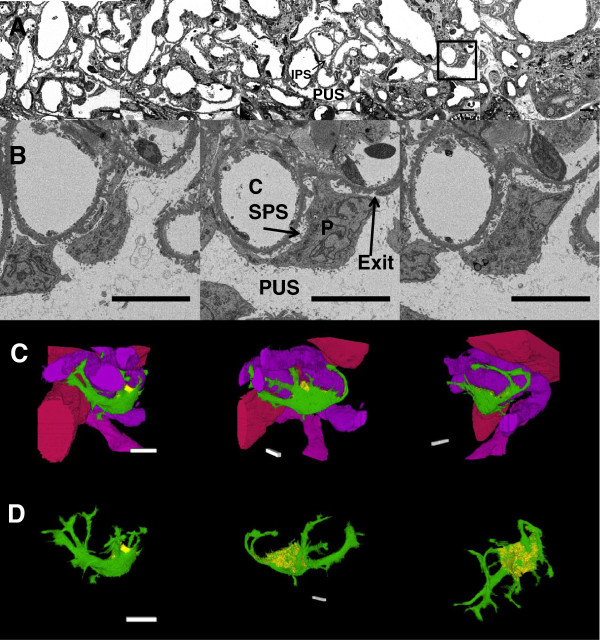
Figure 4
Serial block face scanning electron microscopy of a human glomerulus. A: Micrographs of complete field of view, slices 15u00a0u03bcm apart (z) at the edge of a glomerulus (Additional file 5 : Movie S4...
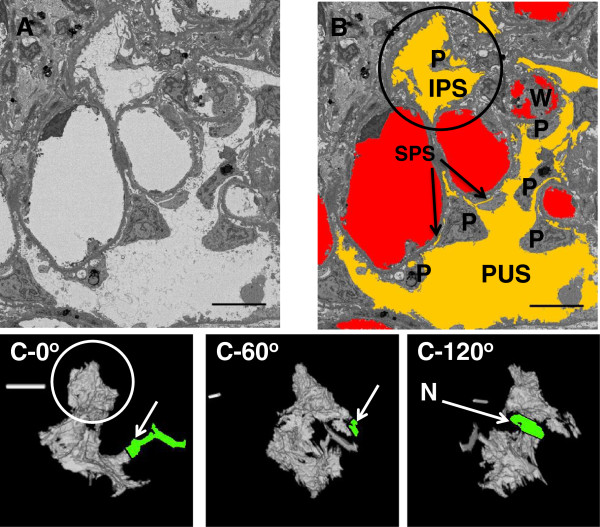
Figure 5
The IPS in human glomeruli. A : Example SBF-SEM micrographs of the human glomerulus (Additional file 9 : Movie S5A). B : The same micrograph as A but with capillaries (red) and urinary spaces (orange)...
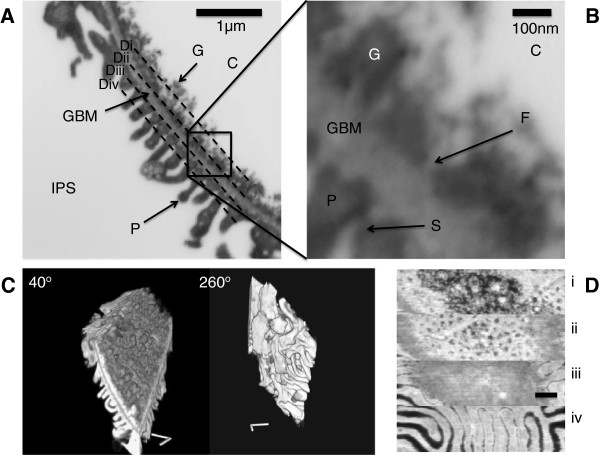
Figure 6
FIB-SEM micrographs of a glomerular capillary wall. A and B: The glomerular filtration barrier using backscattered electron imaging (Additional file 12 : Movie S6A). Labels: (C) capillary lumen, (IPS)...
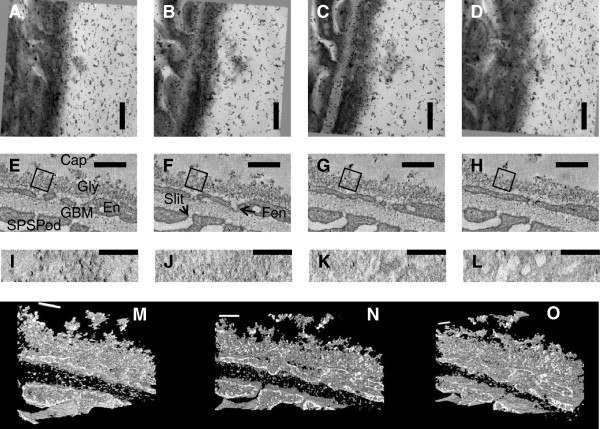
Figure 7
Tomographic reconstruction of rat glomerular capillary glycocalyx using LaDy GAGa staining on a 300u00a0nm thick section. A-D: raw transmission electron microscopy at -60 o ,-30 o ,30 o and 60 o respe...
Figure images are served from the NIH/NLM PubMed Central Open Access Subset or Europe PMC; copyright remains with the publishers and authors.
💬 Discussion
0 commentsNo comments yet. Be the first to start a discussion!
Leave a Comment