Abstract
Abstract Microtubules are hollow biopolymers of 25-nm diameter and are key constituents of the cytoskeleton. In neurons, microtubules are organized differently between axons and dendrites, but their precise organization in different compartments is not completely understood. Super-resolution microscopy techniques can detect specific structures at an increased resolution, but the narrow spacing between neuronal microtubules poses challenges because most existing labelling strategies increase the effective microtubule diameter by 20–40 nm and will thereby blend neighbouring microtubules into one structure. Here we develop single-chain antibody fragments (nanobodies) against tubulin to achieve super-resolution imaging of microtubules with a decreased apparent diameter. To test the resolving power of these novel probes, we generate microtubule bundles with a known spacing of 50–70 nm and successfully resolve individual microtubules. Individual bundled microtubules can also be resolved in different mammalian cells, including hippocampal neurons, allowing novel insights into fundamental mechanisms of microtubule organization in cell- and neurobiology.
🔬 Techniques
🔭 Microscopes
🧬 Organisms
💻 Software
✨ Fluorophores
🧪 Sample Preparation
🔬 Cell Lines
🏭 Microscope Brands
🧪 Reagent Suppliers
🔴 Lasers
📷 Detectors
💻 Software Details
💾 Data Repositories
🏛️ Research Organizations (ROR)
Affiliated research institutions:
📋 Methods
VHH#1 selection VHH#1 was selected from a novel library of 3 × 10 9 humanized nanobodies. Briefly, commercial biotinylated tubulin (Cytoskeleton) was diluted to obtain a 10–20 nM solution (1 ml final) and efficient recovery of biotinylated tubulin was confirmed on 50 μl streptavidin-coated magnetic beads (Dynal). Fractions of bound and unbound samples were compared by western blot using streptavidin–HRP. Adequate amounts of beads and biotinylated antigen were incubated for 2 h with the phage library (10 13 phages diluted in 1 ml of PBS containing 0.1% Tween-20 and 2% nonfat milk). Phages were previously adsorbed on empty streptavidin-coated magnetic beads to remove nonspecific binders. Phages bound to tubulin-coated beads were recovered on a magnet and washed 10 times (round 1) or 20 times (round 2) using PBS containing Tween-20 0.1%. Bound phages were eluted using 500 μl triethylamine (100 mM) for 10 min. Eluted phages were neutralized using 1 M Tris pH 7.4. Elution was repeated once more. E . coli (TG1) were infected with the eluted phages. Round 2 was carried out using 10 12 phages as input. After round 2, 40 bacteria clones were picked at random and used to produce nanobodies in the culture medium. Nanobody specificity was analysed by immunofluorescence as described before 5 and nanobodies staining microtubules were analysed further.
VHH#1 expression and purification
For production of VHH#1, WK6 E . coli containing the plasmid pHEN2–VHH#1–His 6 –cMyc 3 were grown in 2 l of ‘Terrific Broth' (17 mM KH 2 PO 4 , 72 mM K 2 HPO4, 12 g l −1 tryptone, 24 g l −1 yeast extract, 0.4% glycerol) containing 2 mM MgCl 2 , 0.1% glucose, and 100 μg ml −1 ampicillin with shaking at 37 °C until the E. coli had an OD 600 of 0.6–0.9. Isopropyl β-D-1-thiogalactopyranoside (IPTG) was then added to a concentration of 0.5 mM, and the flasks were shaken at 28 °C overnight (∼16 h). To extract the nanobody from the periplasmic space, cells were centrifuged (5,000 g , 10 min), resuspended in 24 ml of TES buffer (0.2 M Tris pH 8.0, 0.5 mM EDTA, 0.5 M sucrose) and shaken for 1 h at 4 °C. The cell–TES mixture was then diluted by the addition of 36 ml of TES/4 buffer (50 mM Tris pH 8.0, 0.125 mM EDTA, 0.125 M sucrose), and shaken for 1 h at 4 °C. The cells were then pelleted (5,000 g , 10 min), and the nanobody-containing supernatant removed. The His 6 -tagged VHH#1 was then purified using HisPur cobalt-agarose resin (Thermo Scientific) following manufacturer's instructions. The eluted protein was concentrated ∼10-fold using ‘Vivaspin' columns (3 kDa MWCO; General Electric).
Show full methods section
VHH#1 selection VHH#1 was selected from a novel library of 3 × 10 9 humanized nanobodies. Briefly, commercial biotinylated tubulin (Cytoskeleton) was diluted to obtain a 10–20 nM solution (1 ml final) and efficient recovery of biotinylated tubulin was confirmed on 50 μl streptavidin-coated magnetic beads (Dynal). Fractions of bound and unbound samples were compared by western blot using streptavidin–HRP. Adequate amounts of beads and biotinylated antigen were incubated for 2 h with the phage library (10 13 phages diluted in 1 ml of PBS containing 0.1% Tween-20 and 2% nonfat milk). Phages were previously adsorbed on empty streptavidin-coated magnetic beads to remove nonspecific binders. Phages bound to tubulin-coated beads were recovered on a magnet and washed 10 times (round 1) or 20 times (round 2) using PBS containing Tween-20 0.1%. Bound phages were eluted using 500 μl triethylamine (100 mM) for 10 min. Eluted phages were neutralized using 1 M Tris pH 7.4. Elution was repeated once more. E . coli (TG1) were infected with the eluted phages. Round 2 was carried out using 10 12 phages as input. After round 2, 40 bacteria clones were picked at random and used to produce nanobodies in the culture medium. Nanobody specificity was analysed by immunofluorescence as described before 5 and nanobodies staining microtubules were analysed further.
VHH#1 expression and purification
For production of VHH#1, WK6 E . coli containing the plasmid pHEN2–VHH#1–His 6 –cMyc 3 were grown in 2 l of ‘Terrific Broth' (17 mM KH 2 PO 4 , 72 mM K 2 HPO4, 12 g l −1 tryptone, 24 g l −1 yeast extract, 0.4% glycerol) containing 2 mM MgCl 2 , 0.1% glucose, and 100 μg ml −1 ampicillin with shaking at 37 °C until the E. coli had an OD 600 of 0.6–0.9. Isopropyl β-D-1-thiogalactopyranoside (IPTG) was then added to a concentration of 0.5 mM, and the flasks were shaken at 28 °C overnight (∼16 h). To extract the nanobody from the periplasmic space, cells were centrifuged (5,000 g , 10 min), resuspended in 24 ml of TES buffer (0.2 M Tris pH 8.0, 0.5 mM EDTA, 0.5 M sucrose) and shaken for 1 h at 4 °C. The cell–TES mixture was then diluted by the addition of 36 ml of TES/4 buffer (50 mM Tris pH 8.0, 0.125 mM EDTA, 0.125 M sucrose), and shaken for 1 h at 4 °C. The cells were then pelleted (5,000 g , 10 min), and the nanobody-containing supernatant removed. The His 6 -tagged VHH#1 was then purified using HisPur cobalt-agarose resin (Thermo Scientific) following manufacturer's instructions. The eluted protein was concentrated ∼10-fold using ‘Vivaspin' columns (3 kDa MWCO; General Electric).
SDS–polyacrylamide gel electrophoresis
(PAGE) and Coomassie-staining of the resulting gels revealed the nanobody to be >90% pure. VHH#1 was dialysed overnight against PBS at 4 °C to remove any residual imidazole. The 2 l of culture yielded ∼50 mg of pure nanobody. The stability of VHH#1 was analysed by immunoblotting of a sample stored at 4 °C for >4 months. Two micrograms of VHH#1 were used for Coomassie staining and about 100 ng for immunoblotting using anti-VHH serum 976 (1:2,000 (ref. 9 )) or mouse monoclonal anti-c-myc antibody (1:5,000, Abcam) recognizing the carboxy-terminal myc-tag of VHH#1. VHH#2 selection The VHH phage display library was generated from llamas immunized with MCF7 cells 9 . Two rounds of selection were performed as described 9 . For selection of VHHs against tubulin, the bovine brain tubulin (Cytoskeleton) was directly coated onto 96-well NUNC Maxisorp plates (Thermo Scientific) in a series of dilutions (0; 0.1;1; 5 μg in PBS) by incubation for 30 min at room temperature and then overnight at 4 °C. Phages retrieved from the phage-glycerol stock were preincubated with 2% milk-PBS for 30 min at room temperature, and added to the tubulin-coated wells and kept at rppm temperature on a shaker for 2 h. Afterwards wells were washed extensively with 0.05% Tween-20 in PBS. Bound phages were eluted with 100 μl per well of 0.1 M triethylamine followed by recovery via infection of E. coli TG1. Phages from the first round were subjected to the second round of selection with 0, 0.1, 1 or 5 μg of coated tubulin. E. coli TG1 were infected with the phages from the second selection and plated on LB-agar plates supplemented with ampicillin. Ninety-six random colonies were picked for testing. Expression of VHHs targeted to the bacterial periplasm was induced by addition of 1 mM IPTG at 37 °C overnight. To obtain the periplasmic fraction, bacterial pellets were resuspended in 10 volumes of PBS (pH 7.4) containing protease inhibitor cocktail (Roche), subjected to two freeze/thaw cycles, and spun down for 15 min at 4,600 r.p.m. Periplasm was collected as supernatant fraction. Specificity of VHHs for tubulin was determined by enzyme-linked immunosorbent assay.
VHH#2 expression and purification
For efficient bacterial expression, four of the most successful and divergent VHH sequences were directly subcloned from pUR8100 into modified pET28a–EPEA vector using SfiI/NotI restriction sites. pET28a–EPEA was created inserting AAACAAAGYQDYEPEA–STOP sequence (NotI/XhoI) in front of the C-terminal 6 × His-myc sequence which allows purification with Capture Select C-tag matrix (Life Technologies). Although all of the constructs were expressed and purified, from now on, we focused on one of the VHH sequences showing the best performance during protein production and labelling (Clone H, that is, VHH#2). For protein production, an overnight culture of E. coli BL21(DE3) transformed with pET28a-VHH#2-EPEA was grown in LB supplemented with kanamycin till OD 600 ≈0.8 and induced with 0.5 mM IPTG for 4 h at 25 °C or at 20 °C overnight. VHHs were purified from the periplasmic fraction in PBS (pH 7.4) containing 0.5% Triton-X100, protease inhibitor cocktail (Roche) and 0.5 mM TCEP and purified using Capture Select C-tag matrix according to the manufacturer's instructions (Life Technologies). Bound VHH was eluted from the beads in buffer containing 2 M MgCl 2 , 20 mM Tris-HCL (pH 7.0) and immediately dialyzed against PBS (pH 7.4). Impurities were removed by size exclusion chromatography performed on an ÄKTA FPLC system (ÄKTA purifier, GE Healthcare, UK) using a Superdex 75 gel filtration column. Fractions containing VHH#2 were pooled and upconcentrated to 1–1.5 μg μl −1 . Cell culture and immunostaining COS-7, MRC5 or Ptk2 cells were plated on 19-mm diameter glass coverslips or 8-well Labtek chambers (Thermo scientific), respectively and cultured in DMEM/Ham's F10 (50/50%) medium supplemented with 10% FCS and 1% penicillin/streptomycin for 2–3 days. Culturing of primary neurons was described before 10 . Briefly, hippocampal primary neurons were prepared from embryonic day 18 rat brains. Cells were plated on coverslips coated with poly- L -lysine (30 μg ml −1 ) and laminin (2 μg ml −1 ) at a density of 40,000 per well. Hippocampal cultures were grown in Neurobasal medium (NB) supplemented with B27, 0.5 μM glutamine, 12.5 μM glutamate and penicillin/streptomycin. For optimal microtubule imaging, cells were pre-extracted and fixed in extraction buffer containing 80 mM PIPES (pH 6.9), 7 mM MgCl 2 , 1 mM EGTA, 0.3% Triton-X100 (Sigma-Aldrich), 150 mM NaCl, 5 mM glucose, 0.25% glutaraldehyde (Electron Microscopy Sciences) for 90 s at 37 °C and then in PBS with 4% PFA and 4% sucrose for 10 min at 37 °C. After fixation, cells were washed two times in PBS and cells were further permeabilized for 10 min in PBS with 0.25% Triton-X100. Cells were then washed three times in PBS, quenched for 10 min with 50 mM NH 4 Cl in PBS, washed again and incubated with Image-IT (Molecular Probes) for 30 min at RT. After three washes with PBS, blocking buffer 1 (used for staining with antibody and VHH#2) containing 2% w/v 2% w/v BSA-c (Aurion) 11 , 0.2% w/v gelatin, 10 mM glycine, 50 mM NH 4 Cl in PBS (pH 7.4) or blocking buffer 2 (used for VHH#1, also works for VHH#2) containing 10% FHS (Gibco, Life Technologies) and 0.1% Triton-X-100 in PBS (pH 7.4) was added for 30–45 min. Primary antibodies or VHHs were diluted in corresponding blocking buffer and were incubated overnight at 4 °C (antibody) or 1–2 days at RT (VHHs). For the secondary antibody labelling, coverslips were washed from the primary antibody and anti-mouse antibody conjugated to AF647 were diluted in a same blocking buffer and added for 1–1.5 h at room temperature. Antibody were α-tubulin (Sigma-Aldrich, clone B-5-1-2, T5168) conjugated to AF647 (dilution 1:100), AF647 conjugated goat anti-mouse IgG (H+L) secondary antibody (Molecular Probes, Life Technologies, dilution 1:500). VHH#1 and VHH#2 were diluted to about 10 μg/ml. All coverslips were extensively washed with PBS shortly before imaging, post-fixed in PBS with 4% PFA and 0.25% GA for 10 min at room temperature and again extensively washed with PBS. For co-staining with F-actin marker, neurons already labelled with VHH#1-AF647 were washed in PBS and incubated with AF568 Phalloidin from Molecular probes (Life Technologies, 1:200 in PBS) for 20 min, extensively washed in PBS and mounted for imaging. For live staining with SiR-tubulin 8 , 100 nM of the probe was added to the growth medium and incubated for 1 h at 37 °C, 5% CO 2 . MRC5 cells expressing plus-end microtubule marker EB3–GFP were used for the life imaging. COS7 cells were fixed with standard pre-extraction/fixation protocol (see above), mixture of 3% PFA and 1% glutaraldehyde for 10 min at 37 °C or 4% PFA for 10 min at 37 °C. Fixed cells were extensively washed in PBS and processed for imaging. Ptk2 cells were fixed at 37 °C using prewarmed PEM buffer (15 mM PIPES pH 7, 1 mM MgCl 2 , 10 mM EGTA) containing 0.1% Triton X-100 and 0.4% glutaraldehyde for 10 min. They were washed three times with PBS, incubated with PBS containing 50 mM NH 4 Cl for 10 min, washed twice with PBS, incubated with freshly prepared PBS with 0.1 mg ml −1 sodium borohydride for 5 min, washed three times with PBS, incubated with Image-IT blocking solution (Life Technologies) for 30 min, washed three times with PBS, and then incubated with blocking buffer 2. Labelled VHH#1 nanobody was then added to a final concentration of 600 nM, and the cells incubated overnight at 25 °C (note that similar labelling was obtained with a 4 h incubation). The cells were then washed three times with PBS containing 0.1% Triton X-100, and twice with PBS and processed for imaging. In vitro microtubule bundling assay Rhodamine-labelled microtubuless were prepared from stabilized seeds as described earlier, 12 and stored at −80 °C. HiLyte Fluor 647-tubulin was purchased from Cytoskeleton and HiLyte Fluor 647-microtubules seeds were made in a same way like Rhodamine–microtubule seeds. The seeds were quickly transferred into a 37 °C water bath, incubated for 5 min and kept in the dark at room temperature for 24 h. Labelled microtubules were diluted 1:30 in PEM80 (80 mM PIPES, pH 6.9, 2 mM MgCl 2 , 1 mM EGTA) containing 10 μM of Taxol (Sigma). Then 50 μl of this dilution was mixed with 0.2 ng of recombinant purified GFP–AtMAP65-1 (ref. 6 ) and incubated for 20 min at room temperature to allow formation of bundles. Imaging flow chambers were assembled using microscope slides and coverslips connected with double-sided tape. Before each experiment coverslips were plasma cleaned for 10 min, coated for 1 min with 0.4% diethylenetriamine diluted in H 2 O and baked for 1 h at 200 °C. Microtubules with and without GFP–AtMAP65-1 were washed into the flow channels and kept in dark. After 20 min, unbound microtubules were washed out with PEM80 containing 1 μM Taxol. For the immunostainings, attached Rhodamine-microtubules were first fixed for 3 min with 4% PFA and 0.25% GA in PEM80, washed with PEM80 containing 1 μM Taxol, quenched for 10 min with 50 mM NH 4 Cl in PBS, washed again and unspecific binding of proteins to the surface was blocked with blocking buffer 1 for 30 min at room temperature. Samples intended for staining with VHH#1 were in addition blocked with Image-IT for 30 min and then blocked with blocking buffer 2 (see above). Primary AF647-labelled anti-α-tubulin antibody (1:20), VHH#1 (10 ng μl −1 ) or VHH#2 (10 ng μl −1 ) were diluted in corresponding blocking buffer, added to the flow channels and incubated in room temperature for 2 h in the dark. Stained samples were postfixed for 3 min with 4% PFA and 0.25% glutaraldehyde in PEM80, washed with PEM80 and imaged immediately.
SMLM imaging
Imaging of fixed cells stained with microtubule probes conjugated to AF647 was performed using 10–100 mM mercaptoethylamine (MEA), 5% w/v glucose, 560 μg ml −1 glucose oxidase, 40 μg ml −1 catalase in PBS. Imaging mixture for in vitro microtubule samples contained 100 mM MEA, 5% w/v glucose, 560 μg/ml glucose oxidase, 40 μg ml −1 catalase in PEM80 containing 1 μM Taxol. SMLM microscopy 13 14 15 was performed on a Nikon Ti microscope equipped with a 100 × Apo TIRF objective (NA. 1.49), a Perfect Focus System and an additional 2.5 × Optovar to achieve an effective pixel size of 64 nm. Evanescent or oblique laser illumination was achieved using a custom illumination pathway with a 15-mW 405-nm diode laser (Power Technology), a 50-mW 491-nm DPSS laser (Cobolt Calypso), and a 40-mW 640-nm diode laser (Power Technology). Fluorescence was detected using an Andor DU-897D EMCDD camera. All components were controlled by Micromanager software 16 . For SMLM imaging of AF647, the sample was continuously illuminated with 640-nm wavelength light. In addition, the sample was illuminated with 405-nm light at increasing intensity to keep the number of fluorophores in the fluorescent state constant. Typically 5,000–15,000 frames were recorded per acquisition with exposure times of 30–40 ms. SMLM imaging of Ptk2 cells was performed as described 17 . Imaging chambers were filled with Buffer TN (50 mM Tris-HCl pH 8, 10 mM NaCl) containing 10% glucose, 10 mM MEA (pH adjusted to 8 with KOH; Sigma), 40 μg ml −1 catalase (Sigma, C40-100MG), and 0.5 mg ml −1 glucose oxidase (Sigma, G2133-50KU), and sealed with a coverslip. Imaging was performed using a standard Nikon NSTORM microscope, using a 647-nm laser adjusted to provide total internal reflection-based illumination. Videos were acquired using an iXon EMCCD (Andor) and a 100 Hz frame rate, with a typical acquisition containing 50,000–100,000 frames. A 488-nm laser was sometimes used to increase the rate at which the AF 647 molecules exited the dark state; however, this was typically not necessary. Acquisitions were then processed to create super-resolution images using custom-written software 3 ( Fig. 2 , Supplementary Fig. 4b ). For 3D-SMLM, we use the biplane method as described 3 18 . SMLM localization and rendering algorithms For Fig. 1 and Supplementary Figs 3 and 4a , we used localization software written in Java as an ImageJ plugin, called Detection of Molecules. Each image in an acquired stack was convoluted with the two-dimensional (2D) Mexican hat kernel matching the microscope's point spread function (PSF) size. The intensity histogram of the convolved image was fitted to a Gaussian distribution and used to calculate the threshold intensity value (mean value of the fit plus three s.d.). The maximum intensity values within individual spots were chosen as initial positions for the peaks' fitting performed on the original image. We used unweighted nonlinear least squares fitting with Levenberg-Marquardt algorithm to the assumed asymmetric 2D Gaussian PSF. Only fits with a calculated width within ±30% of the measured PSF's standard deviation were accepted. Localizations within one pixel distance in a number of successive frames were considered to arise from the same molecule. In this case the weighted mean was calculated for each coordinate, where weights were equal to inverse squared localization precision. The resulting table with molecule coordinates and precision was used to render the final localization image with 5-nm pixel size for microtubule FWHM analysis, and 10- or 20-nm pixel size otherwise. Each molecule was plotted as a 2D Gaussian with integrated intensity equal to one and with s.d. equal to the localization precision. SMLM-localization and rendering of 3D data into images was done as described before 3 .
Analysis of super-resolution images
To estimate the FWHM of the microtubules, line region of interests were drawn by hand on the microtubules in the reconstructed image. A custom-made ImageJ macro was then used to generate an intensity profile perpendicular to the region of interests, integrating the intensity values over a length of 500 nm. A Gaussian distribution was fitted to the intensity profile, from which the FWHM was derived as . In order to calculate the probability of separately resolving two microtubule profiles, all profiles used for FWHM calculation were normalized along the y axis to an area under the curve of 1 and centred on the x axis on the mean derived from the Gaussian distribution fit. To allow for subpixel shifts, bicubic interpolation was applied to the intensity profiles. Two profiles were randomly selected and positioned with their centres a distance between 5- and 125-nm apart from each other. The profiles were summed, and the dip in intensity between the two peaks was calculated. If this dip was >25% of the intensity of the lowest peak, the two profiles were considered to be resolved. After 250 iterations with different randomly selected profiles, the distance between the means was increased by 0.5 nm and the procedure was repeated. At each position, the ratio between resolved and non-resolved sets of intensity profiles was used to calculate the resolving probability. All analysis was performed in the open source software package R. An independent estimate of image resolution was obtained using Fourier Ring Correlation (FRC), as described previously 7 . In short, particle tables generated by Detection of Molecules were converted to tables with only x - and y -coordinates for each localization remaining. The FRC plug-in for ImageJ created by the Delft University of Technology Quantitative Imaging Group was then used to obtain a resolution estimate. To obtain consistent results, it was essential to perform frame-to-frame fluorophore linking (see above, Supplementary Fig. 5 ).
Supplementary Material Supplementary Information Supplementary Figure 1-6, Supplementary Methods and Supplementary References
📊 Figures
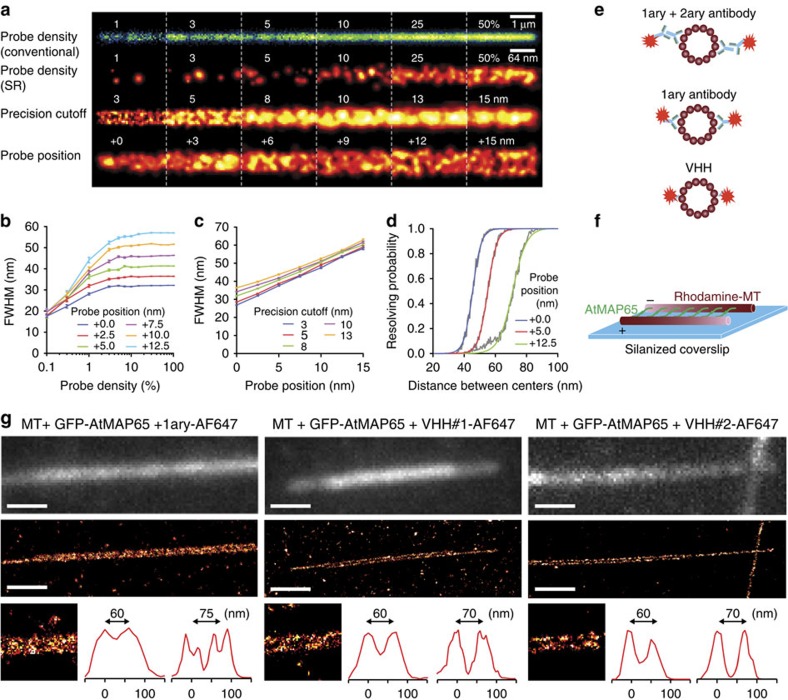
Figure 1
Smaller labels allow resolving bundled microtubules.
( a ) Simulations of conventional (top) and single-molecule localization-based microtubule images for different probe densities, localization precision cutoffs and probe positions (distance between ta...
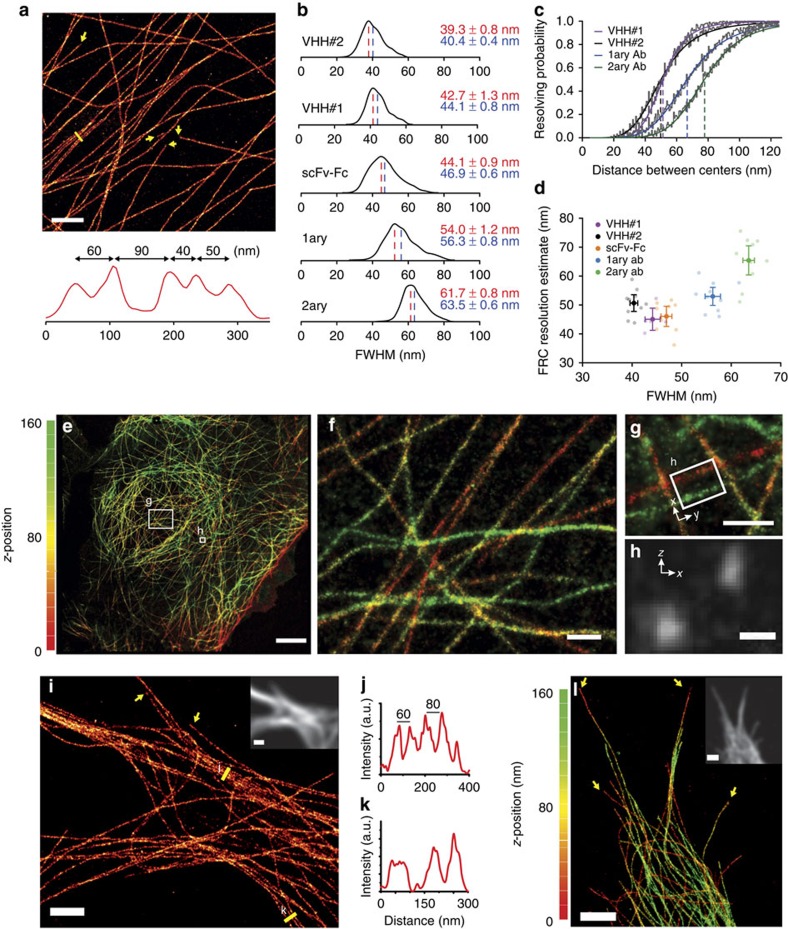
Figure 2
Resolving bundled microtubules in cells using tubulin nanobodies.
( a ) SMLM reconstruction of a Ptk2 cell stained with VHH#1 and intensity profile of closely spaced microtubules along the yellow line. Yellow arrows indicate microtubule ends. Scale bar, 1u2009u03bcm...
Figure images are served from the NIH/NLM PubMed Central Open Access Subset or Europe PMC; copyright remains with the publishers and authors.
💬 Discussion
0 commentsNo comments yet. Be the first to start a discussion!
Leave a Comment