Abstract
Extending superresolution fluorescence microscopy to living animals has remained a challenging frontier ever since the first demonstration of STED (stimulated emission depletion) nanoscopy in the mouse visual cortex. The use of fluorescent proteins (FPs) in in vivo STED analyses has been limiting available fluorescence photon budgets and attainable image contrasts, in particular for far-red FPs. This has so far precluded the definition of subtle details in protein arrangements at sufficient signal-to-noise ratio. Furthermore, imaging with longer wavelengths holds promise for reducing photostress. Here, we demonstrate that a strategy based on enzymatic self-labeling of the HaloTag fusion protein by high-performance synthetic fluorophore labels provides a robust avenue to superior in vivo analysis with STED nanoscopy in the far-red spectral range. We illustrate our approach by mapping the nanoscale distributions of the abundant scaffolding protein PSD95 at the postsynaptic membrane of excitatory synapses in living mice. With silicon-rhodamine as the reporter fluorophore, we present imaging with high contrast and low background down to ∼70-nm lateral resolution in the visual cortex at ≤25-µm depth. This approach allowed us to identify and characterize the diversity of PSD95 scaffolds in vivo. Besides small round/ovoid shapes, a substantial fraction of scaffolds exhibited a much more complex spatial organization. This highly inhomogeneous, spatially extended PSD95 distribution within the disk-like postsynaptic density, featuring intricate perforations, has not been highlighted in cell- or tissue-culture experiments. Importantly, covisualization of the corresponding spine morphologies enabled us to contextualize the diverse PSD95 patterns within synapses of different orientations and sizes.
🔬 Techniques
✨ Fluorophores
🧪 Sample Preparation
🏛️ Research Organizations (ROR)
Affiliated research institutions:
📋 Methods
Details of the mouse line, plasmid and viral vector production, animal procedures, virus transduction, surgical preparation, in vivo labeling and histology, and in vivo STED image acquisition and associated analysis are described in SI Appendix , SI Materials and Methods . In brief, we performed STED nanoscopy of nanoscale distributions of the PSD protein PSD95 in fusion with the HaloTag and enzymatically self-labeled by SiR fluorophores in the visual cortex of anesthetized live mice. All imaging was carried out on a home-built upright STED microscope ( SI Appendix , Fig. S1 ) with a 63× glycerol-immersion objective lens, scanning a pair of laser spots for 640-nm fluorescence excitation and 775-nm STED deexcitation of SiR (as a focal-plane doughnut), and 473-nm excitation for EGFP/EYFP (confocal). The far-red FPs, also explored for PSD95 labeling and STED imaging, were excited by a 594-nm laser. Image acquisition of 5 × 5 µm 2 to 20 × 20 µm 2 FOVs was typically performed with 20-nm pixel size and 30-µs dwell time, resulting in acquisition times of ∼2–30 s for the large STED images and ∼1.3–5.6 s for image portions containing the individual PSD95 assemblies (depending on the acquisition mode and width of the FOV). Further details on image acquisition parameters are in SI Appendix , Table S1 . All animal procedures were conducted in accordance with the Animal Welfare Law of the Federal Republic of Germany and the regulation about animals used in experiments and were approved and authorized by the Niedersächsisches Landesamt für Verbraucherschutz und Lebensmittelsicherheit.
📊 Figures
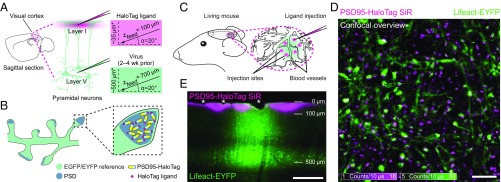
Fig. 1.
In vivo labeling of endogenous PSD95-HaloTag with organic fluorophores. ( A u2013 C ) Schematic illustrations of the in vivo labeling of the postsynaptic protein PSD95 in combination with a morphologi...
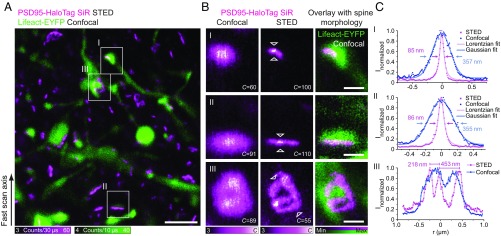
Fig. 2.
STED imaging of PSD95 scaffolds in vivo with excellent structural definition. ( A ) STED image of endogenous PSD95-HaloTag fusion proteins stained with SiR-Halo ligand (magenta), merged with the confo...
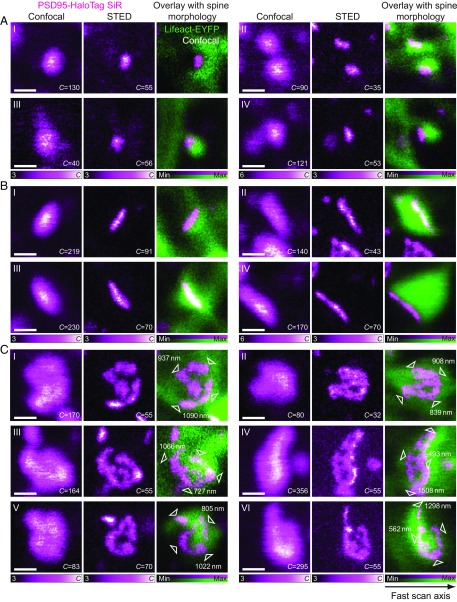
Fig. 3.
Impressions of PSD95 scaffold nanoarchitectures in vivo. ( A u2013 C ) Examples of the different appearances of PSD95 assemblies (SiR-Halo ligand, magenta) in 2D imaging in ( Left ) confocal mode, ( M...
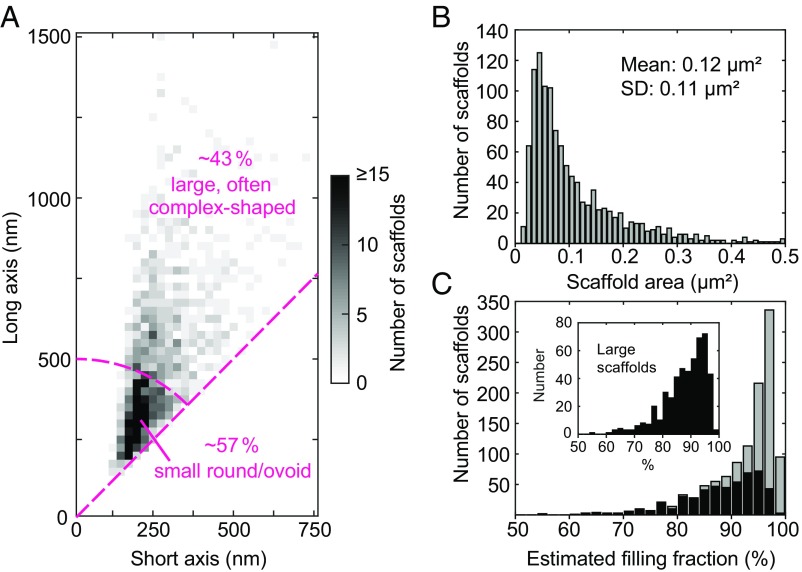
Fig. 4.
Dimensions, areas, and estimated filling fractions of PSD95 scaffold nanoarchitectures extracted from a semiautomated image analysis ( n = 1,148). ( A ) A 2D histogram of long-axis vs. short-axis diam...
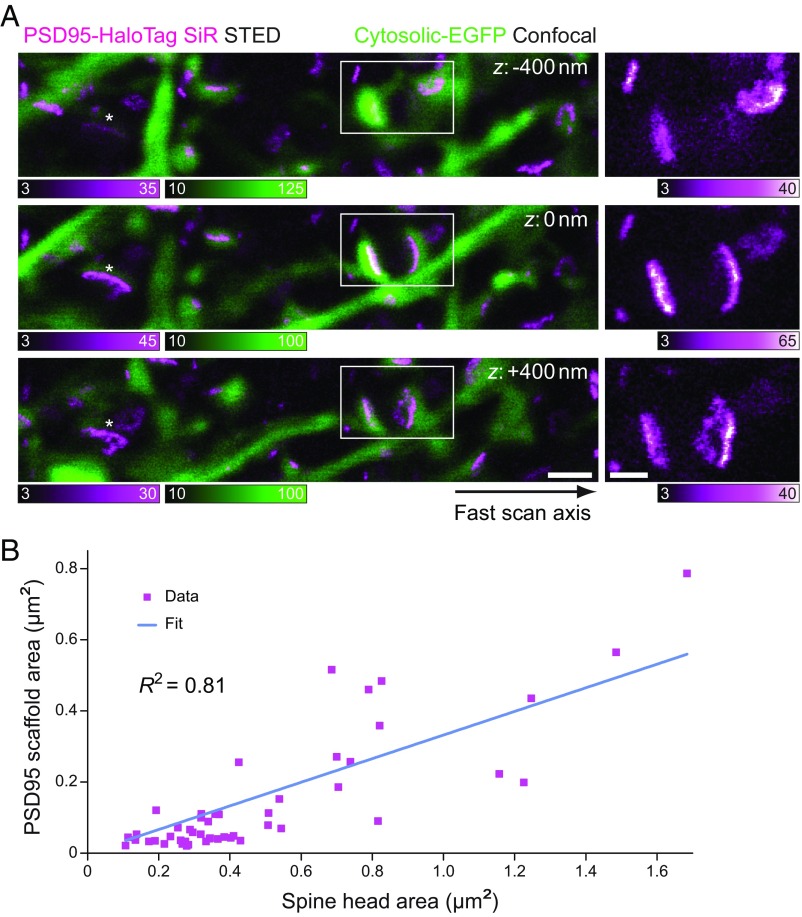
Fig. 5.
PSD95 nanomorphologies related to spine shapes and sizes. ( A ) The 3D context of in vivo nanoscale PSD95 scaffold morphologies. ( Left ) Overlays of STED images of PSD95 (magenta) with the correspond...
Figure images are served from the NIH/NLM PubMed Central Open Access Subset or Europe PMC; copyright remains with the publishers and authors.
💬 Discussion
0 commentsNo comments yet. Be the first to start a discussion!
Leave a Comment