Abstract
AbstractSystemic AL amyloidosis is a rare disease that is caused by the misfolding of immunoglobulin light chains (LCs). Potential drivers of amyloid formation in this disease are post-translational modifications (PTMs) and the mutational changes that are inserted into the LCs by somatic hypermutation. Here we present the cryo electron microscopy (cryo-EM) structure of an ex vivo λ1-AL amyloid fibril whose deposits disrupt the ordered cardiomyocyte structure in the heart. The fibril protein contains six mutational changes compared to the germ line and three PTMs (disulfide bond, N-glycosylation and pyroglutamylation). Our data imply that the disulfide bond, glycosylation and mutational changes contribute to determining the fibril protein fold and help to generate a fibril morphology that is able to withstand proteolytic degradation inside the body.
🔬 Techniques
🔭 Microscopes
🧪 Sample Preparation
🏭 Microscope Brands
🧪 Reagent Suppliers
💻 Software Details
💾 Data Repositories
🏛️ Research Organizations (ROR)
Affiliated research institutions:
📋 Methods
Source of the fibril-containing tissue The fibrils were extracted from the explanted heart of a male patient (FOR001), who suffered from systemic AL amyloidosis with cardiac involvement and underwent cardiac surgery at the age of 51 years. The underlying condition was a monoclonal gammopathy. The patient was treated within the heart-transplant program of the University Hospital Heidelberg. The explanted heart tissue was stored at −80 °C. The study was approved by the ethical committees of the University of Heidelberg (123/2006) and of Ulm University (203/18). Informed consent was obtained from the patient for the analysis of the amyloid deposits. Visualization of amyloid fibril deposits in heart tissue using STEM and SEM Frozen pieces of FOR001 heart tissue (~1 mm 3 ) were fixed in a solution of 0.1% (w/v) glutaraldehyde, 4% (w/v) paraformaldehyde, and 1% (w/v) saccharose in 0.1 M sodium phosphate buffer (pH 7.3) overnight at 4 °C. The further sample preparation for STEM and SEM was based on a protocol from a previous publication 51 . In brief, the fixed tissue pieces were cut into ~200-μm slices with a scalpel and then high-pressure frozen with a Compact 01 high-pressure freezing device (Engineering Office M. Wohlwend) and freeze-substituted in a medium consisting of 0.1% (w/v) uranyl acetate, 0.2% (w/v) osmium tetroxide, and 5% (v/v) water in acetone using an AFS2 freeze-substitution device (Leica Microsystems) with which the temperature was raised from −90 °C to room temperature over a period of 19 h. Afterward, the tissue pieces were embedded in epoxy resin (Sigma-Aldrich) starting with a mixture of 30% (v/v) resin in acetone for 1 h followed by 60% (v/v) resin in acetone for 3 h and 100% resin overnight and polymerization in fresh 100% resin by incubation at 60 °C for 48 h. For SEM imaging, 200-nm thin sections were cut from the polymerized samples using the ultramicrotome Ultracut (Leica Microsystems) equipped with a 45° diamond knife (Diatome). Sections were mounted on glow-discharged silicon wafers and stained with a 0.3% (w/v) lead citrate solution in water for 1 min, washed with distilled water, dried, and imaged in a Hitachi S-5200 field emission scanning electron microscope, detecting the secondary electron signal at 5 kV in analysis mode. For STEM, 300-nm thin sections were cut with a 45° diamond knife and processed in a similar way as described in a previous publication 52 . In brief, sections were mounted on copper grids with 200 parallel grid bars (Plano). After attachment of 15-nm colloidal gold fiducials (Aurion), sections were coated with carbon by electron-beam evaporation in a Baf 300 (BalTec). Tomograms were acquired with a STEM JEM-2100F (JEOL) operated at 200 kV. Tilt series were acquired from −72° to +72° with a 1.5° increment using the bright-field detector. The pixel size was 1.395 nm. Tilt series were reconstructed to tomograms by weighted back projection using an emulated simultaneous iterative-reconstruction technique-like filter (20 iterations) and segmentation of fibrils and cell membranes was performed with the IMOD software package 53 , version 4.9.0.
Show full methods section
Source of the fibril-containing tissue The fibrils were extracted from the explanted heart of a male patient (FOR001), who suffered from systemic AL amyloidosis with cardiac involvement and underwent cardiac surgery at the age of 51 years. The underlying condition was a monoclonal gammopathy. The patient was treated within the heart-transplant program of the University Hospital Heidelberg. The explanted heart tissue was stored at −80 °C. The study was approved by the ethical committees of the University of Heidelberg (123/2006) and of Ulm University (203/18). Informed consent was obtained from the patient for the analysis of the amyloid deposits. Visualization of amyloid fibril deposits in heart tissue using STEM and SEM Frozen pieces of FOR001 heart tissue (~1 mm 3 ) were fixed in a solution of 0.1% (w/v) glutaraldehyde, 4% (w/v) paraformaldehyde, and 1% (w/v) saccharose in 0.1 M sodium phosphate buffer (pH 7.3) overnight at 4 °C. The further sample preparation for STEM and SEM was based on a protocol from a previous publication 51 . In brief, the fixed tissue pieces were cut into ~200-μm slices with a scalpel and then high-pressure frozen with a Compact 01 high-pressure freezing device (Engineering Office M. Wohlwend) and freeze-substituted in a medium consisting of 0.1% (w/v) uranyl acetate, 0.2% (w/v) osmium tetroxide, and 5% (v/v) water in acetone using an AFS2 freeze-substitution device (Leica Microsystems) with which the temperature was raised from −90 °C to room temperature over a period of 19 h. Afterward, the tissue pieces were embedded in epoxy resin (Sigma-Aldrich) starting with a mixture of 30% (v/v) resin in acetone for 1 h followed by 60% (v/v) resin in acetone for 3 h and 100% resin overnight and polymerization in fresh 100% resin by incubation at 60 °C for 48 h. For SEM imaging, 200-nm thin sections were cut from the polymerized samples using the ultramicrotome Ultracut (Leica Microsystems) equipped with a 45° diamond knife (Diatome). Sections were mounted on glow-discharged silicon wafers and stained with a 0.3% (w/v) lead citrate solution in water for 1 min, washed with distilled water, dried, and imaged in a Hitachi S-5200 field emission scanning electron microscope, detecting the secondary electron signal at 5 kV in analysis mode. For STEM, 300-nm thin sections were cut with a 45° diamond knife and processed in a similar way as described in a previous publication 52 . In brief, sections were mounted on copper grids with 200 parallel grid bars (Plano). After attachment of 15-nm colloidal gold fiducials (Aurion), sections were coated with carbon by electron-beam evaporation in a Baf 300 (BalTec). Tomograms were acquired with a STEM JEM-2100F (JEOL) operated at 200 kV. Tilt series were acquired from −72° to +72° with a 1.5° increment using the bright-field detector. The pixel size was 1.395 nm. Tilt series were reconstructed to tomograms by weighted back projection using an emulated simultaneous iterative-reconstruction technique-like filter (20 iterations) and segmentation of fibrils and cell membranes was performed with the IMOD software package 53 , version 4.9.0.
Measurement of the persistence length
A total of 197 amyloid fibrils in heart tissue were traced in the STEM tomograms and were then available as polygonal chains. Based on this representation, the squared end-to-end distance R , i.e., the Cartesian plane distance between the starting and end points, and the contour length L, i.e., the sum of the length of all line segments of the polygonal chain, were computed for each fibril. The persistence length P of the fibrils was then determined by regression analysis using the formula 1 documentclass[12pt]{minimal} usepackage{amsmath} usepackage{wasysym} usepackage{amsfonts} usepackage{amssymb} usepackage{amsbsy} usepackage{mathrsfs} usepackage{upgreek} setlength{oddsidemargin}{-69pt} begin{document}$${R}^{2}=2{PL}left(1-frac{P}{L}left(1-{e}^{frac{-L}{P}}right)right)$$end{document} R 2 = 2 P L 1 − P L 1 − e − L P according to Kollmer et al. 54 and using the curve-fitting tool in Matlab (MATLAB 2019, The MathWorks). P is contained in the confidence interval from 0.66 μm to 0.81 μm in 95% of all cases. The bending rigidity B is computed based on P according to the formula 2 documentclass[12pt]{minimal} usepackage{amsmath} usepackage{wasysym} usepackage{amsfonts} usepackage{amssymb} usepackage{amsbsy} usepackage{mathrsfs} usepackage{upgreek} setlength{oddsidemargin}{-69pt} begin{document}$$B={k}_{B}{TP}$$end{document} B = k B T P where k B and T denote the Boltzmann constant and the temperature (300 K), respectively 21 , 55 . Fibril extraction from FOR001 heart tissue Fibrils were extracted from FOR001 heart tissue using a previously established protocol 56 . In brief, 250 mg of heart tissue was diced with a scalpel and washed five times with Tris Calcium Buffer (TCB) [20 mM Tris, 138 mM NaCl, 2 mM CaCl 2 , and 0.1% (w/v) NaN 3 , pH 8.0]. Each washing step consisted of the addition of 0.5 mL of ice-cold TCB to the pellet, the homogenization of the tissue with a Kontes Pellet Pestle, and the separation of the tissue from the supernatant by centrifugation for 5 min at 3100 × g and 4 °C, followed by the removal of the supernatant. The tissue pellet after the fifth washing step was resuspended in 1 mL of TCB containing 5 mg/mL Clostridium histolyticum collagenase (Sigma-Aldrich) and one tablet of complete ethylenediaminetetraacetic acid (EDTA)-free protease-inhibitor cocktail (Roche) per 7 mL of TCB. After an overnight incubation of the digest at 37 °C in a horizontal orbital shaker (750 rpm), the sample was centrifuged for 30 min at 3100 × g and 4 °C. The pellet was subjected to ten washing steps which were performed in the same manner as the TCB washing steps described above, except that 0.5 mL of Tris EDTA buffer [20 mM Tris, 140 mM NaCl, 10 mM EDTA, and 0.1% (w/v) NaN 3 , pH 8.0] was used instead of TCB. The pellet from the last wash was resuspended in 0.5 mL of ice-cold distilled water, mixed with a pipette, and centrifuged for 5 min at 3100 × g and 4 °C. The fibril-containing supernatant was retained and the pellet was submitted to nine more cycles of resuspension in water and centrifugation. The supernatants were retained to check for the presence of fibrils. Platinum side-shadowing and TEM The handedness of the fibrils was determined by platinum side-shadowing and TEM. Formvar and carbon-coated 200 mesh copper grids (Plano) were glow discharged for 40 s at 40 mA using a PELCO easiGlow glow-discharge cleaning system (Ted Pella). About 15 μL of the fibril solution were applied to the grid and incubated for 30 s at room temperature. The grid was blotted using filter paper (Whatman) to remove excess fluid. The grid was washed three times with 10 μL of distilled water and dried at room temperature. Platinum was evaporated at an angle of 30° onto the grid to form a 1-nm-thick layer by use of a Balzers BAF 300 coating device. Grids were imaged using a JEM-1400 TEM (JEOL) that was operated at an acceleration voltage of 120 kV. The images were recorded with an F216 camera (TVIPS). Cryo-EM sample preparation and data collection C-flat 1.2/1.3 400-mesh holey carbon-coated grids (Science Services) were glow-discharged at 40 mA for 40 s using a PELCO easiGlow glow-discharge cleaning system (Ted Pella). Conditions of grid preparation were optimized with the help of a Vitrobot Mark 3 (Thermo Fisher Scientific) and checked in a 200-kV JEM 2100 F transmission electron microscope (JEOL) that was equipped with a DE12 detector (Direct Electron). The grids for data collection were prepared by application of 3.5 μL of fibril solution to a grid, incubation for 30 s at >95% humidity, both-side blotting using filter paper (Whatman), and plunging into liquid ethane (~103 K). The data set was recorded with a Titan Krios transmission electron microscope (Thermo Fisher Scientific) at 300 kV and applying a Gatan imaging filter with a 20-eV slit. The images were recorded with a K2-Summit detector (Gatan) in counting mode. The software SerialEM v3.7 was used for data collection. In total, 3033 micrographs were collected from a single grid. See Supplementary Table 1 for further details. Global fibril parameters, such as width and crossover distance, were measured using Fiji v1.52 57 . The proportion of fibrils showing the reconstructed morphology was determined by analyzing all fibrils (length at least 200 nm) in 100 micrographs.
Reconstruction of the 3D map
Motion correction and dose-weighting was carried out with MotionCor2 58 . For predicting, refining, and correction of the contrast transfer function, Gctf v1.06 59 was used. Helical reconstruction was performed using Relion 3.0 60 . As a first step, 279,338 particles were picked manually with a box size of ~312 Å and an interbox distance of 34.6 Å (~11%). After a reference-free 2D classification using 279 classes and a regularization value of T = 2 in the first run, another 2D classification was performed with 50 classes. 2D classes were selected based on the visibility of a z-axial repeat at ~4.8 Å and bad classes were excluded. An initial 3D model was generated using Relion’s initial-model job. To generate a better reference for 3D classification, fibrils with visible crossovers were picked from 28 micrographs, resulting in 244 particles. These particles were subjected to a 3D classification with the initial model as a reference. This treatment resulted in a map with fibril-like features. Using this map as a reference, the particle set selected from 2D classification was subjected to several rounds of 3D classification, 3D refinement, and post-processing. The resolution of the resulting map was estimated to be 3.6 Å. To obtain a more homogeneous set of particles, fibrils were picked more selectively, yielding 43,308 particles with a box size of ~270 Å. Using the previously obtained post-processed map as a reference (with adjusted box size), subsequent steps of 3D classification, 3D refinement, and post-processing yielded a map at a resolution of 3.4 Å. All manually picked particles were retained in this reconstruction. Further improvement of map resolution was accomplished through Bayesian polishing, resulting in a final map resolution of 3.1 Å, based on the value of the FSC curve for two independently refined half-maps at 0.143. An estimated map-sharpening B-factor of −67.383 Å 2 was applied. The map had a twist of −1.45566° and a rise of 4.76311 Å. These values agree with the twist value calculated from the measured crossover distances on the cryo-EM micrographs, and with the rise value measured from the micrograph power spectra.
Model building and refinement
The software Coot 61 v0.8.9 was used to manually build the protein model de novo. First, the 3D map was traced and a poly-L-Ala chain created representing the protein backbone. The residues of this chain were then mutated to the FOR001 fibril protein sequence as determined by MS. This initial model was then further improved by subsequent rounds of manual and automated refinement (phenix.real_space_refine) 62 as implemented in Phenix v1.16 63 . Noncrystallographic symmetry and secondary-structure restraints were imposed. Model-based automated sharpening of the map (phenix.auto_sharpen) 63 yielded an improved map, which was used to further refine the model. The quality of the model was assessed using the MolProbity 64 -generated validation report. Modeling parameters are listed in Supplementary Table 1 . Protein sequence determination by electrospray-ionization MS About 2 μg of refolded, lyophilized and glycosylated fibril protein was resuspended in 15 μL of buffer [280 mM Tris/HCl pH 6.8, 9% (w/v) sodium dodecyl sulfate (SDS), 33.3% (w/v) glycerol, and 100 mM dithiothreitol] and processed by denaturing protein gel electrophoresis. Afterward, the gel band of the fibril protein was cut out and washed by a 10-min incubation in the respective protease buffer (see below), and subsequently, in a mixture of 50% (v/v) protease buffer and 50% (v/v) ACN for 10 min. These incubation steps were repeated twice, followed by vacuum drying. Dried gel slices were reduced with 5 mM dithiothreitol (AppliChem) in 50 mM ammonium bicarbonate, pH 8.0, for 20 min at room temperature and subsequently alkylated with 55 mM iodoacetamide (Sigma-Aldrich) in 10 mM ammonium bicarbonate for 20 min at 37 °C. The gel slices were placed in five different protease solutions (trypsin in 50 mM ammonium bicarbonate, pH 8.0; LysC in 50 mM ammonium bicarbonate, pH 8.0; elastase in 50 mM Tris/HCl, pH 9.0; chymotrypsin in 50 mM Tris/HCl buffer, pH 8.0, 10 mM CaCl 2 ; pepsin 40 mM HCl, pH 1.5). Each protease was used at 0.33 ng/μL concentration and digestion was carried out overnight at 37 °C (except for chymotrypsin at 25 °C). The resulting peptides were released from the gel slices in two steps: the first step was to add 20 μL of a solution containing 50% (v/v) ACN and 0.1% (v/v) TFA; the second step was an incubation in an ultrasonic bath (Bandelin Sonorex Super 10 P) at 100% intensity for 10 min each. ACN was evaporated and samples were filled to 15 μL with 0.1% TFA (v/v). Samples were separated by liquid chromatography using a U3000 RSLCnano (Thermo Fisher Scientific) online coupled to the mass spectrometer with an Acclaim PepMap analytical column (75 μm × 500 mm, 2 μm, 100-Å pore size, Thermo Fisher Scientific) in combination with a C18 μ-precolumn (0.3 mm × 5 mm, PepMap, Dionex LC Packings, Thermo Fisher Scientific). First, samples were washed with 0.1% (v/v) TFA for 5 min at a flow rate of 30 μL/min. Subsequent separation was carried out employing a flow rate of 250 nL/min using a gradient consisting of solvent A [0.1% (v/v) formic acid] and solvent B [86% (v/v) ACN, 0.1% (v/v) formic acid]. The main column was initially equilibrated in a mixture containing 5% (v/v) solvent B and 95% (v/v) solvent A. For elution, the percentage of solvent B was raised from 5 to 15% over a period of 10 min, followed by an increase from 15 to 40% over 20 min. Fractions from the main column directly eluted into the ionization module and were further analyzed by MS. Samples were measured using an LTQ Orbitrap Velos Pro system (Thermo Fisher Scientific). The mass spectrometer was equipped with a nanoelectrospray ion source and distal-coated SilicaTips (FS360-20-10-D, New Objective). The instrument was externally calibrated using standard compounds (LTQ Velos ESI Positive Ion Calibration Solution, Pierce, Thermo Scientific). The system was operated using the following parameters: spray voltage, 1.5 kV; capillary temperature, 250 °C; S-lens radio-frequency level, 68.9%. The software XCalibur 2.2 SP1.48 (Thermo Fisher Scientific) was used for data-dependent MS/MS analyses. Full scans ranging from mass-to-charge ratio (m/z) 370–1700 were acquired in the Orbitrap at a resolution of 30,000 (at m/z 400) with automatic gain control enabled and set to 10 6 ions and a maximum fill time of 500 ms. Collision-induced dissociation was employed as the fragmentation method on individual sample sets. Per survey scan, 10 ions were selected. Single charged ions were rejected and the m/z peaks of fragmented single-charged ions were excluded from fragmentation for 60 s. In the linear ion trap, the automatic gain control was set to 10,000 ions and a maximum fill time of 100 ms. For MS/MS fragmentation, a normalized collision energy of 35% with an ‘activation q’ of 0.25 and an activation time of 30 ms was used. The resulting fragments were analyzed using the linear ion-trap part at rapid scan speeds. Subsequent detection of fragmentation spectra was performed in the Orbitrap mass analyzer at a resolution of 7500. For de novo sequencing, the Peaks AB Software (Bioinformatics Solutions) was used. The resulting sequence was then used as a target for further analyses using the Peaks X software suite (Bioinformatics Solutions) in order to confirm the de novo sequence. For all analyses, the mass accuracy was set to 10 ppm on intact peptide masses and 0.5 Da. Various PTMs were considered, including the deamidation of Asn or Gln residues, pyroglutamate modifications (Gln), oxidation of Met, as well as carbamidomethylated Cys as a result of the alkylation. Ile/Leu as well as Gln/Lys have the same molecular weights and could not be uniquely determined. These residues were assigned based on homology considerations. MS analysis of the total fibril protein mass Lyophilized FOR001 fibril protein was resuspended in Glycoprotein Denaturing Buffer (New England Biolabs) and subsequently it was deglycosylated without the heating step of the standard protocol. The deglycosylated protein was diluted with 0.1% TFA (v/v) to obtain a concentration of 66 μg/mL. It was applied with a flow rate of 10 μl/min onto a PepSwift trap column (200 μm × 5 mm, Thermo Fisher Scientific) in combination with a monolithic ProSwift RP-4H analytical column (100 μm × 50 cm, Thermo Fisher Scientific), which was connected to a U3000 RSLCnano (Thermo Fisher Scientific) that was coupled to the mass spectrometer. The fibril protein was eluted using a gradient of solvent B [86% (v/v) ACN, 0.1% (v/v) formic acid] and solvent A [0.1% (v/v) formic acid] with a flow rate of 1 μL/min. The gradient started with an increase of 5–55% solvent B over a period of 75 min, followed by an increase from 55 to 95% over 15 min. The concentration of 95% solvent B stayed constant for 3 minutes with a subsequent reduction from 95 to 5% solvent B over 9 min. Fractions from the ProSwift RP-4H analytical column directly eluted into the ionization module and were further analyzed by MS. Samples were measured using an LTQ Orbitrap Elite system (Thermo Fisher Scientific). The mass spectrometer was equipped with a nanoelectrospray ion source and distal-coated SilicaTips (FS360-20-10-D, New Objective). The instrument was externally calibrated using standard compounds (LTQ Velos ESI Positive Ion Calibration Solution, Pierce, Thermo Scientific) and operated using the following parameters: spray voltage, 1.5 kV; capillary temperature, 250 °C; S-lens radio-frequency level, 68.9%. The software XCalibur 2.2 SP1.48 (Thermo Fisher Scientific) was used for data-dependent MS/MS analyses. Full scans ranging from mass-to-charge ratio (m/z) 370–1700 were acquired in the Orbitrap at a resolution of 30,000 (at m/z 400) with automatic gain control enabled and set to 10 6 ions and a maximum fill time of 500 ms. The raw data were deconvoluted by the MASH Explorer 65 using default settings and the Quick Deconvolution feature. All calculated monoisotopic masses with a score equal to or above 94% resulting from initial m/z peaks with 5 charges or more were considered as correct and are shown in Supplementary Fig. 5b, c . The deconvoluted mass peaks were further assigned to protein species by using the software mMass 66 considering a tolerance of 0.1 Da and a peak charge of 0. Sequence modifications were set as follows: pyroglutamylation at Gln1 was set as variable, whereas the disulfide bond between Cys22 and Cys89 was set as fixed. Refolding of the FOR001 fibril protein Solid guanidine hydrochloride was added to a sample of ex vivo FOR001 fibrils to reach a final concentration of 6 M followed by an overnight incubation at room temperature to disaggregate the fibrils. The protein was refolded by dialysis (molecular weight cutoff 3.5 kDa, Spectra/Por 6 Dialysis Membrane Pre-wetted RC Tubing, Spectrum Labs) against 20 mM Tris buffer, pH 8.0, for 24 h at 4 °C. The protein was purified by anion-exchange chromatography with Q-SepharoseFF medium (10 mL, Cytiva) in an XK 16/20 column (Cytiva) with a slope gradient from 0% to 100% elution buffer [20 mM Tris buffer, 1 M NaCl, pH 8.0] over 20 column volumes (CVs). The fibril protein-containing fractions, as identified by protein-gel electrophoresis, were purified further with a Resource 15 RPC column (3 mL, Cytiva) that was equilibrated in solvent A [0.1% (v/v) trifluoroacetic acid (TFA) in water]. The protein was eluted through a slope gradient from 0 to 58% solvent B [86% (v/v) acetonitrile (ACN), 0.1% (v/v) TFA] over 20 CVs, followed by second gradient from 58 to 100% solvent B over 4 CVs to remove other bound proteins. Fractions were collected and the fractions containing the FOR001 fibril protein were identified by protein gel electrophoresis, pooled, and lyophilized. Deglycosylation of the refolded FOR001 fibril protein For the experiment shown in Supplementary Fig. 5a , the lyophilized, refolded FOR001 fibril protein was dissolved in water at approximately 2 mg/mL concentration. The exact protein concentration was determined by the intrinsic protein absorbance at 280 nm. This solution was mixed with water and SDS-containing 10 × glycoprotein-denaturing buffer [5% (w/v) SDS, 400 mM dithiolthreitol] (New England Biolabs) to generate a final FOR001 fibril protein solution with the volume V Prot containing a protein concentration of 1 mg/mL and 1 x Glycoprotein Denaturing Buffer (New England Biolabs). The protein was heated for 10 min at 100 °C to partially denature the protein before it was cooled to room temperature. For N-deglycosylation, the heated sample was mixed with 1/5 V Prot of a 10% (v/v) solution of the detergent Nonident P40 in water (New England Biolabs), 1/5 V Prot 10 × Glycobuffer 2 [500 mM sodium phosphate, pH 7.5] (New England Biolabs), 1/2 V Prot water, and 1/10 V Prot PNGase F in 20 mM Tris/HCl, 50 mM NaCl, and 5 mM EDTA, pH 7.5 (New England Biolabs), and incubated for 1 h at 37 °C. For O-deglycosylation, the heated sample was mixed with 1/5 V Prot of a 10% (v/v) Nonident P40 solution (New England Biolabs), 1/5 V Prot 10 × Glycobuffer 2 (New England Biolabs), 3/10 V Prot water, 1/10 V Prot O-glycosidase in 20 mM Tris/HCl, 50 mM NaCl, and 1 mM EDTA, pH 7.5 (New England Biolabs), and 1/5 V Prot neuraminidase in 20 mM Tris/HCl, 50 mM NaCl, and 5 mM EDTA, pH 7.5 (New England Biolabs), and incubated for 10 min at 37 °C. The deglycosylation was checked by denaturing protein-gel electrophoresis. N- and O-glycosylated fetuin protein, which we purchased as a 10 mg/mL solution from New England Biolabs, was used as a control substance. For the experiments reported in Fig. 5 , the lyophilized, refolded FOR001 protein was dissolved in water at 1 mg/mL concentration and denatured—without SDS and dithiothreitol—for 10 min at 100 °C, as the SDS in the denaturing buffer was found to interfere with the subsequent reversed-phase chromatography. Protein-concentration measurement based on the intrinsic absorbance at 280 nm About 40 μL of protein solution was mixed with 160 μL of 7.5 M guanidine hydrochloride (Carl Roth) in 25 mM sodium phosphate buffer, pH 6.5. The absorbance was measured at 280 nm in a Lambda Bio+ ultraviolet/visible (PerkinElmer) spectrometer using a Quartz Suprasil R Ultra-Micro cuvette (Hellma). The protein concentration was determined based on the Lambert–Beer law using a theoretic molar extinction coefficient of 16,740 M −1 cm −1 for the FOR001 fibril protein according to the method of Gill and von Hippel 67 . Fibril-formation kinetics measurements using ThT Refolded and lyophilized FOR001 fibril protein (glycoslylated or deglycosylated) was dissolved at 2 mg/mL concentration in water. Aggregation kinetics measurements were set up in PF 96-well F-bottom black microplates (Greiner Bio-One International). Each well was filled with 100 μL of sample, containing 0.4 mg/mL glycosylated or deglycosylated fibril protein, 20 μM ThT and 10 mM sodium acetate, 10 mM boric acid, 10 mM sodium citrate, pH 4.0, and 150 mM NaCl. The plates were sealed with Rotilabo-sealing film (Carl Roth) and incubated at 37 °C in FLUOstar Omega (BMG Labtech) for 72 h. During incubation, the plates were agitated by orbital shaking at 300 rpm, which was paused during measurement. The fluorescence emission intensity at 490 nm was recorded every 30 min upon excitation at 450 nm. Proteinase K digestion of amyloid fibrils Aliquots of solutions containing ex vivo FOR001 amyloid fibrils or in vitro formed fibrils from glycosylated or deglycosylated FOR001 fibril protein (from the ThT kinetic experiment) were mixed with water and a 10 × buffer stock [200 mM Tris, pH 8.0, 1.4 M NaCl, 20 mM CaCl 2 , and 1% (w/v) NaN 3 ] to reach a total volume of 60 μL containing 0.2 mg/mL protein in 1 × buffer. A first aliquot (10 μL) was withdrawn from this solution and retained for gel electrophoresis as the control sample without protease. The remaining 50 μL of the protein solution were mixed with 1 μL of a 2 mg/mL proteinase K solution (Thermo Fisher Scientific). Immediately afterward, a second aliquot (10 μL) was removed (0-min sample). The remaining solution was incubated at 37 °C in a heating block and further aliquots (10 μL) were withdrawn after 1 min, 2 min, and 5 min. As soon as an aliquot was withdrawn, it was mixed with 1 μL of 200 mM phenylmethylsulfonyl fluoride (PMSF) (Carl Roth) in methanol, incubated for 1 min at room temperature, and flash-frozen in liquid nitrogen. After the experiment, all aliquots were brought to room temperature and analyzed by denaturing protein-gel electrophoresis. The resulting protein bands (72 × 150 pixels) were densitometrically quantified using the program Fiji v1.52 57 . The intensity of the fibril protein band without proteinase K was set to 100%, and an equally sized area on the gel without protein at 0%.
Denaturing protein gel electrophoresis
Samples from the deglycosylation experiment and proteolytic stability measurement (10-μL volume for deglycosylation, 11-μL volume for proteolytic stability, including 1-μL PMSF) were mixed with 2 μL of 10 × NuPAGE reducing agent (Thermo Fisher Scientific), 5 μL of 4 × NuPAGE LDS sample buffer (Thermo Fisher Scientific), and water to generate a sample with a total volume of 20 μL. The solution was heated at 95 °C for 10 min and applied onto a 4–12% NuPAGE Bis-Tris gel (Thermo Fisher Scientific), operated in NuPAGE MES SDS running buffer (Thermo Fisher Scientific). BlueEasy Prestained (Genetics) was used as a marker. The gel was stained in a solution containing 30% (v/v) ethanol, 10% (v/v) acetic acid, and 0.25% (w/v) Coomassie brilliant blue and destained with a solution containing 20% (v/v) ethanol and 10% (v/v) acetic acid. Analysis of GL segments and mutations The FOR001 amino acid sequence was used to search the IgBLAST database ( https://www.ncbi.nlm.nih.gov/igblast/ ), which returned the GL segment IGLV1-51*02 . The protein sequence of the GL segment was retrieved from the VBase2 database ( http://www.vbase2.org/ ). The FOR001 J segment was compared with the five functional IGLJ GL segments in the GenBank database ( https://www.ncbi.nlm.nih.gov/genbank/ ). It matched both IGLJ2 (Gene ID: 28832) and IGLJ3 (GeneID: 28831) and no unique source could be determined. Nor could we identify the GL precursor of the C segment as most of the C L domain is missing in the FOR001 fibril protein. The residues Leu97–Ala98 constitute the variable V/J junctional region. CDRs were determined with abYsis ( http://www.abysis.org/abysis/ ) based on the Kabat definition 68 . In this paper, all mutations are represented in the direction GL to fibril protein. Computation of the aggregation score To compute the aggregation score, we used TANGO version 2.1 69 , WALTZ 70 , FoldAmyloid 71 , Aggrescan 72 , and PASTA2.0 73 . These programs calculate a residue-specific aggregation potential. The following settings were chosen for each program: TANGO: temperature: 309.15 K, ionic strength: 0.02 M, and concentration: 1 M and pH 7.0; WALTZ: the threshold was set to high sensitivity and the pH to 7.0; FoldAmyloid: scale: triple hybrid, averaging frame: 5; Aggrescan: default settings; PASTA: 90% specificity, top pairing energies: 22. Residues with a high aggregation potential are defined as follows: TANGO: β-sheet aggregation values above 0.0; WALTZ: total sequence score above 0.0; Foldamyloid: five successive amino acids with a triple-hybrid threshold above 0.062; Aggrescan: aggregation-propensity values above −0.02; PASTA: PASTA energy units below −2.8. An aggregation score of 0 means that none of the programs identifies a high aggregation score for a given residue. An aggregation score of 5 means that all five programs predict a high aggregation score for that residue. Protein structure representation The images of the density map and protein model were created with the software UCSF Chimera v1.14 74 . Hydrogen bonds were defined according to the criteria of both UCSF Chimera v.1.14 74 and the software Coot v0.8.9 61 . The β-sheets were defined as a minimum of two residues having φ/ψ angles in the β-sheet region of the Ramachandran plot and at least one-backbone hydrogen bond.
Sample statistics
In this paper errors report the standard deviation. In Fig. 5e , a one-tailed Welch t -test was used. Reporting summary Further information on research design is available in the Nature Research Reporting Summary linked to this article.
Supplementary information Supplementary Information Reporting Summary
📊 Figures
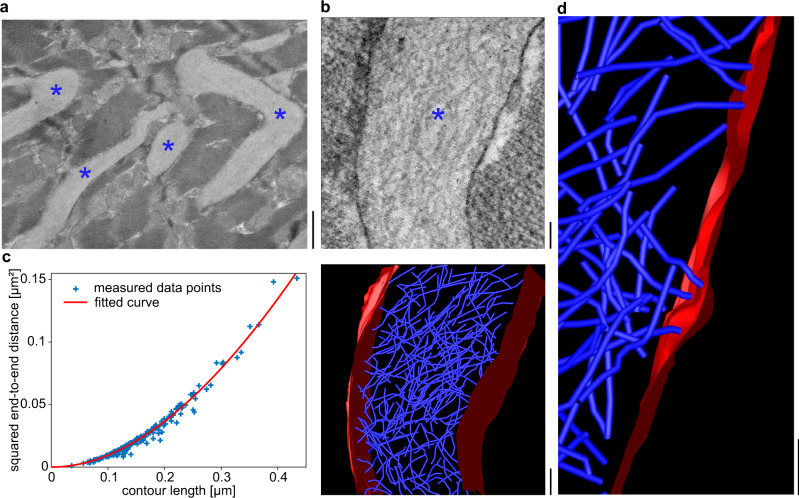
Fig. 1
Tissue deposits of FOR001 amyloid fibrils.
a SEM overview of FOR001 heart tissue. The fibril deposits between cardiomyocytes are marked with blue asterisks. Scale bar: 1u2009u03bcm. b STEM tomogram. Top: virtual section. The fibril deposit is ...
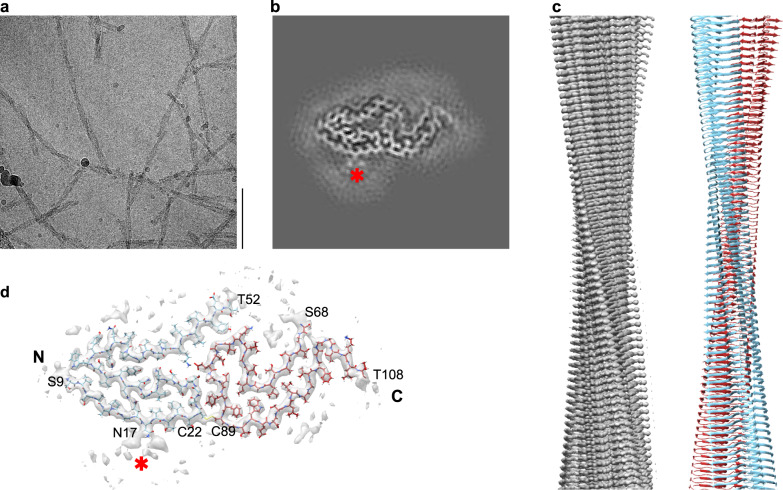
Fig. 2
Cryo-EM structure of the FOR001 AL amyloid fibril.
a Cryo-EM image of FOR001 amyloid fibrils. Scale bar is 100u2009nm. The dataset consists of 3033 micrographs. b Cross section of the map obtained by summing five central slices. c Side view of the map...
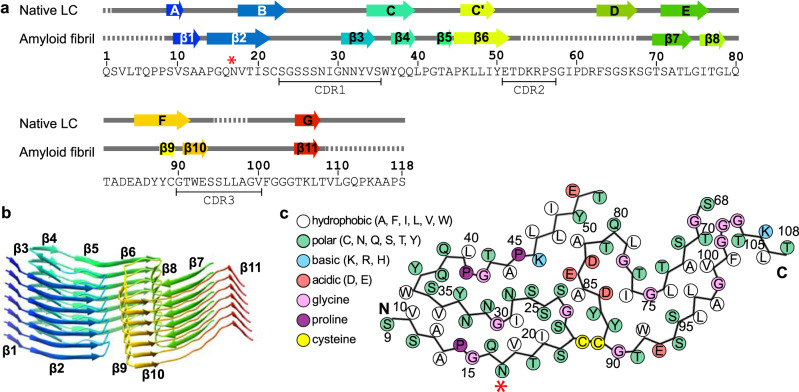
Fig. 3
Location of the secondary structural elements and mutational sites in the fibril structure.
a Amino acid sequence of the FOR001 fibril protein and secondary structural elements of the FOR001 fibril protein (PDB 7NSL) and of a crystal structure of a natively folded LC (PDB 4ODH 10.2210/pdb4OD...
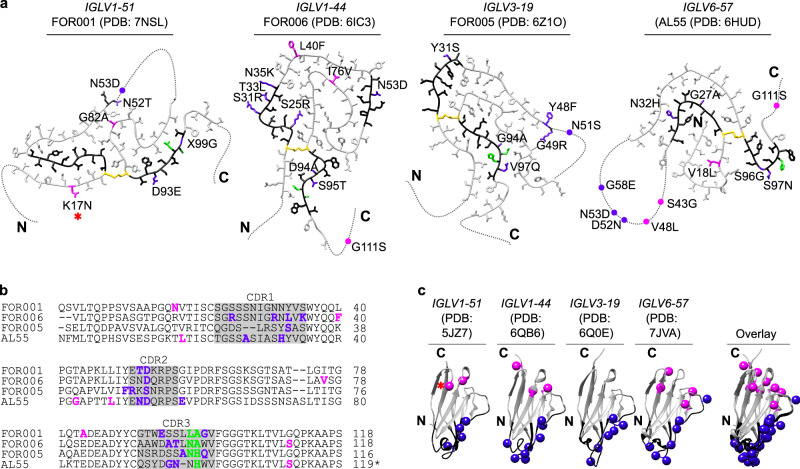
Fig. 4
Location of the mutations in known AL amyloid fibrils and natively folded V L domains.
a Location of the mutations in known AL amyloid fibril structures. The fibrils are derived from the GL segments IGLV1-51*02 u03bb1 (FOR001, this study, PDB 7NSL) IGLV1-44*01 u03bb1 (FOR006, PDB 6IC3 1...
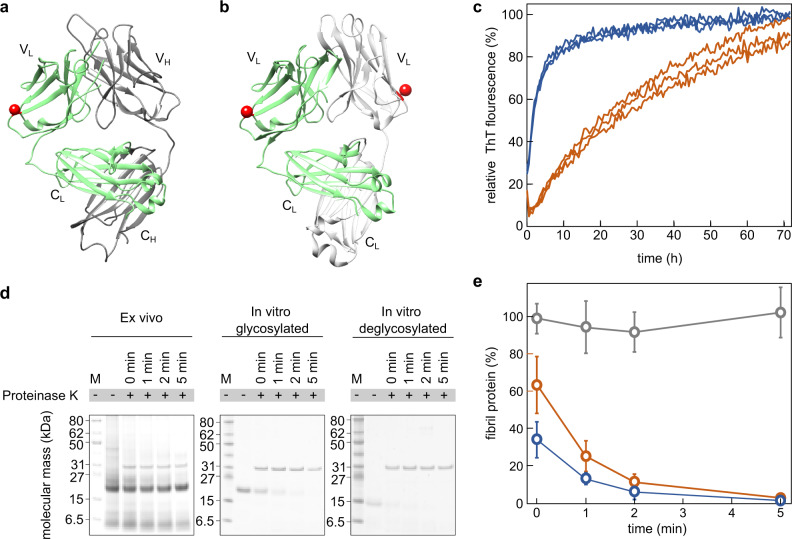
Fig. 5
Effect of glycosylation on the formation of fibrils from FOR001 fibril protein.
a Ribbon representations of a fragment antigen binding that contains a LC with an IGLV1-51*02 GL segment (PDB 4ODH 10.2210/pdb4ODH/pdb). The V L and the C L domain, as well as the variable heavy (V H ...
Figure images are served from the NIH/NLM PubMed Central Open Access Subset or Europe PMC; copyright remains with the publishers and authors.
💬 Discussion
0 commentsNo comments yet. Be the first to start a discussion!
Leave a Comment