Abstract
Three-dimensional cell cultures, such as spheroids and organoids, serve as increasingly important models in fundamental and applied research and start to be used for drug screening purposes. Optical tissue clearing procedures are employed to enhance visualization of fluorescence-stained organs, tissues, and three-dimensional cell cultures. To get a more systematic overview about the effects and applicability of optical tissue clearing on three-dimensional cell cultures, we compared six different clearing/embedding protocols on seven types of spheroid- and chip-based three-dimensional cell cultures of approximately 300 μm in size that were stained with nuclear dyes, immunofluorescence, cell trackers, and cyan fluorescent protein. Subsequent whole mount confocal microscopy and semi-automated image analysis were performed to quantify the effects. Quantitative analysis included fluorescence signal intensity and signal-to-noise ratio as a function of z-depth as well as segmentation and counting of nuclei and immunopositive cells. In general, these analyses revealed five key points, which largely confirmed current knowledge and were quantified in this study. First, there was a massive variability of effects of different clearing protocols on sample transparency and shrinkage as well as on dye quenching. Second, all tested clearing protocols worked more efficiently on samples prepared with one cell type than on co-cultures. Third, z-compensation was imperative to minimize variations in signal-to-noise ratio. Fourth, a combination of sample-inherent cell density, sample shrinkage, uniformity of signal-to-noise ratio, and image resolution had a strong impact on data segmentation, cell counts, and relative numbers of immunofluorescence-positive cells. Finally, considering all mentioned aspects and including a wish for simplicity and speed of protocols - in particular, for screening purposes - clearing with 88% Glycerol appeared to be the most promising option amongst the ones tested.
🔬 Techniques
🔭 Microscopes
💻 Software
✨ Fluorophores
🧪 Sample Preparation
🔬 Cell Lines
🏭 Microscope Brands
🧪 Reagent Suppliers
📷 Detectors
🔎 Objectives
💻 Software Details
🏛️ Research Organizations (ROR)
Affiliated research institutions:
📋 Methods
A list of all cell lines and reagents used in this study can be found in Table 1 and Supplementary Table S1 , respectively. TABLE 1 Cell lines used in the study. Cell line Cell type Labeling Source Mono-cultures HaCaT Keratinocyte – B.R.A.I.N. AG B7_033#1NPC1 iPSC-derived neural precursor – Hector Institute for Translational Brain Research, Mannheim CCD-1137SK Fibroblast – ATCC HT29 Colorectal adenocarcinoma – ATCC HTC-8 Human taste bud – B.R.A.I.N. AG Dynarray co-culture MDA-MB231 Triple-negative breast cancer ECFP ATCC CCD-1137SK Fibroblast CellTracker Red ATCC Melanoma tri-culture HaCaT Keratinocyte CellTracker Red B.R.A.I.N. AG SK-MEL-28 Melanoma CellTracker Green ATCC CCD-1137SK Fibroblast ATCC Cell line, cell type, labeling and source are indicated.
Cell Culture
To investigate the influence of optical tissue clearing protocols on cells of different origin and 3D-cultivation methods, a total of seven tumorous and non-malignant cell lines was chosen for the generation of mono- and tri-culture spheroids, and a microcavity array-based co-culture model: human keratinocyte cell line HaCaT, human induced pluripotent stem cell-derived neural precursor cells B7_033#1NPC1, human fibroblast cell line CCD-1137SK, colorectal adenocarcinoma-associated HT29 cells, human tongue cell line HTC-8, melanoma cell line SK-MEL-28, and the stably transfected, breast cancer-associated cell line MDA-MB-231-ECFP. All cell lines were repeatedly authenticated by phenotypic analysis and regularly tested for mycoplasma.
Show full methods section
A list of all cell lines and reagents used in this study can be found in Table 1 and Supplementary Table S1 , respectively. TABLE 1 Cell lines used in the study. Cell line Cell type Labeling Source Mono-cultures HaCaT Keratinocyte – B.R.A.I.N. AG B7_033#1NPC1 iPSC-derived neural precursor – Hector Institute for Translational Brain Research, Mannheim CCD-1137SK Fibroblast – ATCC HT29 Colorectal adenocarcinoma – ATCC HTC-8 Human taste bud – B.R.A.I.N. AG Dynarray co-culture MDA-MB231 Triple-negative breast cancer ECFP ATCC CCD-1137SK Fibroblast CellTracker Red ATCC Melanoma tri-culture HaCaT Keratinocyte CellTracker Red B.R.A.I.N. AG SK-MEL-28 Melanoma CellTracker Green ATCC CCD-1137SK Fibroblast ATCC Cell line, cell type, labeling and source are indicated.
Cell Culture
To investigate the influence of optical tissue clearing protocols on cells of different origin and 3D-cultivation methods, a total of seven tumorous and non-malignant cell lines was chosen for the generation of mono- and tri-culture spheroids, and a microcavity array-based co-culture model: human keratinocyte cell line HaCaT, human induced pluripotent stem cell-derived neural precursor cells B7_033#1NPC1, human fibroblast cell line CCD-1137SK, colorectal adenocarcinoma-associated HT29 cells, human tongue cell line HTC-8, melanoma cell line SK-MEL-28, and the stably transfected, breast cancer-associated cell line MDA-MB-231-ECFP. All cell lines were repeatedly authenticated by phenotypic analysis and regularly tested for mycoplasma.
Spheroid Generation
For all mono- and tri-culture spheroids used in this study, the appropriate amounts of cells were seeded onto ultra-low attachment (ULA) 96-well U-bottom plates (Corning) in their corresponding medium and centrifuged at 300 rpm for 5 min. All cells were maintained in a humidified incubator at 37°C and 5% CO 2 and, with the exception of a melanoma tri-culture model, kept in culture until reaching a diameter of ∼ 300 μm. HaCaT Spheroids The human keratinocyte cell line HaCaT (B.R.A.I.N. AG) was cultured in Dulbecco’s Modified Eagle Medium (DMEM, Capricorn) supplemented with 1% penicillin/streptomycin (Pen/Strep, Sigma-Aldrich) and 10% fetal bovine serum (FBS, Capricorn). For spheroid generation, cells were detached using Trypsin/EDTA (Sigma-Aldrich) and seeded onto 96-well ULA plates at a concentration of 9 × 10 3 cells per well. A diameter of ∼300 μm was reached after four days of cultivation. B7_033#1NPC1 Spheroids The human iPSC-derived B7_033#1 NPC1 line was kindly provided by S. Horschitz (Hector Institute for Translational Brain Research, Mannheim, Germany) and cultured in DMEM/Ham’s F12 + GlutaMAX supplemented with 1% N2 and 2% B27 supplements, 1% GlutaMAX, 1% Minimum Essential Medium Non-essential Amino Acids (MEM-NEAA, all Invitrogen), 1% Pen/Strep and 20 ng/mL FGF-2_Type 147 (Cell Guidance Systems). For spheroid generation, cells were detached using TrypLE (Invitrogen) and seeded onto 96-well ULA plates at a concentration of 1 × 10 4 cells per well. A diameter of ∼ 300 μm was reached after three days of cultivation. CCD-1137SK Spheroids CCD-1137SK fibroblast cells derived from human foreskin (ATCC) were cultured in Iscove’s Modified Dulbecco’s Medium (IMDM, Capricorn) supplemented with 10% FBS and 1% Pen/Strep. For spheroid generation, cells were detached using Trypsin/EDTA and seeded onto 96-well ULA plates at a concentration of 1 × 10 4 cells per well. An average diameter of 300 μm was reached after four days of cultivation.
HT29 Spheroids HT-29 colon cancer cells
(ATCC) were cultured in McCoy’s 5A medium (Capricorn) supplemented with 10% FBS and 1% Pen/Strep. For spheroid generation, cells were detached using Trypsin/EDTA and seeded onto 96-well ULA plates at a concentration of 1 × 10 3 cells per well. A diameter of ∼ 300 μm was reached after three days of cultivation. HTC-8 Spheroids Human tongue cell line HTC-8 (B.R.A.I.N. AG) was cultured in HTC-medium according to Hochheimer et al. (2014) . For spheroid generation, cells were detached using Trypsin/EDTA and a concentration of 6 × 10 3 cells per well were seeded onto 96-well U-bottom plates. An average diameter of 300 μm was reached after five days of cultivation. Melanoma Tri-Culture Spheroids Melanoma tri-cultures were generated according to Klicks et al. (2019) . Briefly, 1 × 10 4 cells of CCD-1137SK cells were seeded, followed by simultaneous addition of HaCaT (1 × 10 4 cells/well) and SK-MEL-28 (ATCC) (2.5 × 10 3 cells/well) after three days. For discrimination of individual cell types, HaCaT and SK-MEL-28 cells were labeled with CellTracker Red CMPTX (10 μM) and CellTracker Green CMFDA (10 μM) dye (both Life Technologies), respectively according to manufacturer instructions for 30 min. Tri-culture spheroids were kept in culture for another two days to reach an average diameter of 300 μm.
Dynarray Co-culture Model
The human breast cancer cell line MDA-MB231-ECFP was maintained in DMEM supplemented with 10% FBS, 1% MEM-NEAA and 1% Pen/Strep. For co-culture experiments in Dynarrays (300MICRONS), MDA-MB-231-ECFP and CCD-1137SK cells were used. MDA-MB-231 (ATCC) were stably transfected with ECFP-C1 plasmid (Addgene) using Nucleofector TM II (Lonza) following the manufacturer’s protocol. Briefly, ECPF plasmid was linearized by incubating 10 μg/μL DNA with 10% μL Ase I buffer 3.1 (New England Biolabs) and 5% Ase I enzyme (New England Biolabs) for 30 min at 37°C under gentle shaking with 300 rpm. To keep the construct in linear shape, DNA was incubated with alkaline phosphatase (Invitrogen) for 30 min at 37°C. 1 × 10 6 MDA-MB-231 cells were transfected using Nucleofector II and 2 μg linearized ECFP. CCD-1137SK were labeled with CellTracker Red CMPTX according to manufacturer instructions at a concentration of 10 μM in serum-free medium for 30 min. Prior to cell seeding, Dynarrays were treated with an isopropyl alcohol cascade (100%, 70%, 50%, 30% of alcohol in purified water for 30 s each). After washing twice with purified water, chips were coated for 1 h at room temperature with 30 μg/ml rat tail collagen 1 (Roche) in 0.2% acetic acid and washed once with phosphate-buffered saline (PBS). 2 × 10 6 MDA-MB231-ECFP and 2 × 10 6 CellTracker labeled CCD-1137SK were mixed in 100 μl media and seeded onto Dynarray chips. Following a 3 h incubation at 37°C in a CO 2 incubator, 10 ml DMEM were added and changed every other day for nine days.
Fixation and Immunofluorescence
Spheroids were transferred into 200 μl PCR-tubes, washed 2 x with PBS and fixed with 4% paraformaldehyde (PFA, Carl Roth) for 1 h at 37°C, followed by washing twice with PBS containing 1% FBS, for 5 min each. Then, spheroids were quenched with 0.5 M glycine (Carl Roth) in PBS for 1 h at 37°C with gentle shaking. With the exception of Sca l eS clearing protocol, all other optical clearing methods contained the following steps for immunofluorescence: after fixation and PFA-quenching, samples were incubated in penetration buffer for 30 min, containing 0.2% Triton X-100, 0.3 M glycine, and 20% DMSO (all Carl Roth) in PBS to improve penetration of antibodies and nuclear dyes. Spheroids were then washed twice with PBS/1% FBS and incubated in blocking buffer (0.2% Triton X-100, 1% bovine albumin serum (BSA, Carl Roth), 10% DMSO in PBS) for 2 h at 37°C with gentle shaking. After blocking, samples were incubated with primary antibody overnight (ON) at 37°C with gentle shaking. Primary anti-KI67 antibody (Merck, rabbit polyclonal antibody) was diluted 1:300 in antibody buffer (0.2% Tween 20, 10 μg/ml heparin (both Sigma-Aldrich), 1% BSA, 5% DMSO in PBS). Samples were then washed 5 times for 5 min each in washing buffer (0.2% Tween 20, 10 μg/mL heparin, 1% BSA) and stained with secondary antibody and nuclear dyes ON at 37°C with gentle shaking. Corresponding secondary antibody and nuclear dyes were diluted in antibody buffer with the following concentrations: donkey anti-rabbit AlexaFluor488, 1:800; donkey anti-rabbit AlexaFluor647, 1:800; DRAQ5, 1:1000 (all Invitrogen); DAPI, 1:500 (Sigma-Aldrich). Samples were washed subsequently 5 times for 5 min in washing buffer with gentle shaking and then embedded or cleared according to the following protocols, protected from light to prevent bleaching of fluorophores.
Optical Clearing Embedding in PBS or Mowiol
(Sigma-Aldrich) and optical clearing with Glycerol: after immunofluorescence and 24 h prior to imaging, samples were mounted in 18 well μ-slides (ibidi) in either PBS or Mowiol. Glycerol-based RI matching was performed according to Williams et al. (2019) by immersion of stained spheroids in an aqueous solution of 88% Glycerol (RI 1.459) ON at RT with gentle shaking, followed by mounting on 18 well μ-slides in the same solution. All procedures were executed with minimal exposure to light. After mounting, spheroids were always kept in the microscope room for several hours to allow for temperature adjustment prior to microscopy. Clear T2 This was performed according to Dingle et al. (2015) . Briefly, fixed spheroids were incubated for 10 min at RT in a solution of 25% formamide/10% polyethylene glycol (PEG) (both Carl-Roth), followed by a 5 min incubation in a 50% formamide/20% PEG solution. Finally, samples were immersed in fresh 50% formamide/20% PEG and incubated for 60 min at RT and subsequently mounted. All steps were carried out under gentle movement. CytoVista After immunofluorescence staining, remaining liquid was carefully removed from samples, followed by ON immersion at RT in 30 μL of CytoVista Tissue Clearing Reagent (Invitrogen). Then, spheroids were mounted in ibidi 18 well μ-slides in CytoVista reagent. Sca l eS An adapted version of the original Sca l eS tissue clearing protocol ( Hama et al., 2015 ) for indirect immunofluorescence was used. After fixation, spheroids were immersed ON in S0 solution (20% (w/v) D-sorbitol (Sigma-Aldrich), 5% (w/v) Glycerol (Carl-Roth), 3% (v/v) DMSO in PBS, pH 7.2) to avoid sample floating in subsequent steps. Permeabilization involved adaptation in S0, immersion in A2 (10% (w/v) Glycerol, 4 M urea (Sigma-Aldrich), 0.1% (w/v) Triton X-100 in ddH 2 O, pH 7.7) for 24 h at 37°C, followed by a 24 h incubation in B4(0) (8 M urea in ddH 2 O, pH 8.4) at 37°C and a final incubation in A2 ON at 37°C. Then, samples were washed for 6 h in PBS at RT and blocked in Sca l eS blocking solution (2.5% (w/v) BSA, 0.05% (w/v) Tween 20, 0.1% (w/v) Triton X-100 in PBS, pH 7.4) for 24 h at 37°C. Then, samples were incubated with primary antibody for 24 h at 37°C, washed two times for 2 h each in fresh AbSca l e (0.33 M urea, 0.1% (w/v) Triton X-100 in PBS, pH 7.4) at RT and then incubated ON at 37°C in secondary antibody solution containing nuclear dyes. Next, samples were washed in fresh AbSca l e for 6 h at RT, followed by reblocking twice for 2 h each in Sca l eS blocking solution. After refixation in 4% PFA for 1 h at RT, spheroids were washed in PBS ON at 4°C. For RI matching, samples were incubated in Sca l eS4 solution (40% (w/v) D-sorbitol, 10% (w/v) Glycerol, 4 M urea, 15% DMSO in ddH 2 O, pH 8.1) ON at RT and mounted in 18 well μ-slides. All steps were carried out under gentle movement to ensure proper immersion of samples. After mounting, spheroids were kept in the microscope room for several hours to allow temperature adjustment.
Image Acquisition and Analysis
For microscopic imaging, an inverted Leica TCS SP8 confocal microscope (Leica Microsystems CMS, Mannheim) equipped with HC PL APO 20 x/0.75 IMM CORR objective, 405 nm, 488 nm, 561 nm, and 633 nm lasers and Leica Application Suite X software was used. All image stacks were acquired with comparable settings, using Immersion Type F (Leica Microsystems, RI 1.52), at a resolution of 1024 × 1024 pixels, z-step size of 1.5 μm, a laser intensity of 1–1.5% and a gain between 600 and 750 V, in order to avoid overexposure of pixels. For comparability of tested clearing methods, image stacks for Figures 1 – 7 and Supplementary Figures S1 – S6 were acquired without z-compensation. Data for Figures 8 , 9 were acquired with z-compensation. For brightfield microscopy, an Axiovert 25 (Carl Zeiss Microscopy GmbH) was used. FIGURE 1 Preservation of fluorescence signal intensity, sample volume and optical transparency is strongly dependent on optical clearing protocol. Upon growth to a diameter of approximately 300 μm, spheroids made of HaCaT keratinocytes were fixed, stained with anti-KI67 (green) and the nuclear dyes, DAPI (gray) and DRAQ5 (red), followed by optical tissue clearing or embedding as indicated and subsequent confocal whole mount microscopy. Images show representative top ( Left panels for each staining) and orthogonal ( Right panels for each staining) 3D volume projections of single and merged channels after corresponding clearing method. Scale bars, 50 μm. FIGURE 2 Aqueous clearing methods and detergent-containing hyperhydration prevent massive post-fixation volume changes. Upon growth to a diameter of approximately 300 μm, spheroids made of HaCaT keratinocytes were fixed, stained with anti-KI67 and DRAQ5, followed by optical tissue clearing or embedding as indicated. Spheroid diameters were determined from brightfield images before and after fixation and from confocal microscopy stacks after staining. (A) Representative brightfield images of spheroids before and after fixation as well as maximum projections of confocal image stacks upon staining and clearing/embedding as indicated. In the confocal panels, DRAQ5 and KI67 fluorescence signals are shown in magenta and green, respectively. Scale bars, 100 μm.
Quantitative analysis of average spheroid diameter
(B) and change of average spheroid diameter relative to pre-fixation state (C) . Graphs depict mean + standard deviation (SD); n ≥ 9; * p ≤ 0.05, *** p ≤ 0.001. FIGURE 3 High-refractive index aqueous solutions or detergent-containing hyperhydration improve light penetration into spheroids. Upon growth to a diameter of approximately 300 μm, spheroids made of HaCaT keratinocytes were fixed, stained with anti-KI67, DAPI, and DRAQ5, followed by optical tissue clearing or embedding as indicated and subsequent confocal whole mount microscopy. (A,B) Depicted are single optical sections of spheroids at discrete z-depths with fixed intervals of 50 μm (A) or 25 μm (B) . Each panel shows DAPI, DRAQ5, and KI67 fluorescence signals, as well as a merge. In merged panels DAPI is shown in blue, DRAQ5 in red, and KI67 in green. Colocalization of DAPI and DRAQ5 appears in magenta, additional colocalization with KI67 in green to white hues. Scale bars 50 μm. FIGURE 4 Optical transparency, preservation of fluorescence signals and depth-dependent SNR are dependent on clearing method and cell line. Mono-culture spheroids of HaCaT cells were grown to approximately 300 μm diameter and then fixed. Upon staining of proliferating cells (anti-KI67) and nuclei (DAPI and DRAQ5), spheroids were embedded/cleared as indicated and then imaged in toto using confocal microscopy. Analysis of depth-dependent signal intensity of DAPI and DRAQ5 was performed by selecting one circular region of interest (ROI) per sample through the central region of the spheroid followed by mean intensity measurement throughout the entire stack depth. SNR values for DAPI and DRAQ5 were determined by measurement of mean intensity and standard deviation of background and nuclear signal via semi-automated thresholding. Then, SNR was calculated as the ratio of mean signal intensity in identified nuclear regions to the average standard deviation of background intensity (μ SIGNAL /σ BACKGROUND ). To account for volume-changing effects of individual clearing methods, all depth values were normalized by the method-dependent degree of swelling or shrinkage. (A,B) Graphs show mean intensities of DAPI and DRAQ5 as a function of normalized z-depth HaCaT spheroids. (C,D) Graphs show mean SNR values for staining with DAPI and DRAQ5 as a function of normalized z-depth for HaCaT spheroids. All mean values were calculated from n ≥ 7 spheroids per condition. FIGURE 5 Optical clearing efficiency is affected by complexity of a spheroid-based tri-culture model. Melanoma tri-culture spheroids were generated starting with formation of a core spheroid of CCD-1337SK fibroblasts, followed after 72 h by simultaneous addition of HaCaT keratinocytes labeled with CellTracker Red and SK-MEL-28 melanoma cells marked with CellTracker Green. After another two days of cultivation, spheroids were fixed, stained with anti-KI67 and DAPI, and then embedded or cleared as indicated. Confocal 3D-imaging of whole spheroid cultures was performed. (A) Representative top and orthogonal 3D-volume projections of fluorescence signals (indicated) of a PBS-embedded spheroid are shown in upper and lower panels, respectively. In the merge, DAPI appears in blue, CellTracker Green in green, CellTracker Red in yellow, and KI67 in red. Scale bars, 50 μm. (B) Depicted are representative images of tri-culture spheroids after different types of embedding/clearing as indicated. Top and side view maximum projections are shown in upper and middle panels. Lower panels show single optical sections at 75 μm of imaging depth. Scale bars, 50 μm in upper and middle row, 100 μm in lower row. Quantitative analysis of mean signal intensity of DAPI and CellTracker Green (C) and SNR of DAPI signals (D) as a function of normalized depth. Mean of n = 10 spheroids per condition. FIGURE 6 ECFP fluorescence is maintained by Glycerol-RI matching in a chip-based co-culture model of breast cancer cells and fibroblasts. ECFP-expressing MDA-MB-231 breast cancer cells were co-seeded with CellTracker Red labeled CCD-1337SK fibroblasts into Dynarray chips with 300 μm wide cavities. After 9 days of cultivation, chips were fixed, stained with anti-KI67 and DRAQ5, and then embedded or cleared as indicated. (A) Representative top and orthogonal 3D-volume projections of fluorescence signals (indicated) of Mowiol-embedded chip cavities are shown in upper and lower panels, respectively. In the merge, ECFP appears in cyan, CellTracker Red in yellow, KI67 in green, and DRAQ5 in red. Scale bars, 50 μm. (B) Depicted are representative images of chip cavities after different types of embedding/clearing as indicated. Top and side view maximum projections are shown in upper and middle panels. Lower panels show single optical sections at 75 μm of imaging depth. Scale bars, 50 μm in upper and middle row, 100 μm in lower row. (C,D) Quantitative analysis of mean signal intensity of ECFP, CellTracker Red, and DRAQ5 (C) and SNR of DRAQ5 signals (D) as a function of depth. Mean of n = 10 cavities per condition. FIGURE 7 Optical clearing of HaCaT spheroids with Glycerol improves detection and quantification of cell nuclei. Upon growth to a diameter of approximately 300 μm, spheroids made of HaCaT keratinocytes were fixed, stained with anti-KI67 and DRAQ5, followed by optical tissue clearing or embedding as indicated and subsequent confocal whole mount microscopy. Semi-automated image segmentation was performed to detect and count KI67 + and DRAQ5 + nuclei. (A) Depicted are raw single optical sections and orthogonal views from central regions for both markers (KI67 – raw; DRAQ5 – raw) and corresponding segmented images (KI67 – segmented; DRAQ5 – segmented). In raw images, fluorescence signals of KI67 and DRAQ5 are shown in green and red, respectively. Different colors of segmented nuclei were used for better visual discrimination. Scale bars, 50 μm. B-C: Quantitative analysis of KI67 + (B) and Draq5 + nuclei (C) as a function of clearing/embedding protocol.
Data show mean +
SD; n ≥ 9; ** p ≤ 0.01; *** p ≤ 0.001. FIGURE 8 Z-profiles of signal intensity and SNR remain more stable upon z-compensation. Upon growth to a diameter of approximately 300 μm, spheroids made of HaCaT keratinocytes were fixed, stained with anti-KI67 and DRAQ5, followed by optical tissue clearing with Glycerol and subsequent confocal whole mount microscopy. (A) Depicted are orthogonal maximum projections (left three columns) and a clipped projection to visualize the spheroid core (right column) of the same spheroid imaged in the absence (upper panels) or presence of z-compensation (lower panels). In the left panels, fluorescence signals of KI67 and DRAQ5 are shown in green and red, respectively. The right panels show only DRAQ5 signals in gray. Scale bars, 50 μm. Graphical representations of z-profiles for DRAQ5 channel signal intensity (B) and SNR (C) in a z-extended column through the central region of the spheroid. FIGURE 9 Z-compensation improves semi-automated segmentation of nuclei. Upon growth to a diameter of approximately 300 μm, spheroids made of HaCaT keratinocytes were fixed, stained with anti-KI67 and DRAQ5, followed by optical tissue clearing with Glycerol and subsequent confocal whole mount microscopy. (A) Depicted are single raw confocal images (left two columns) and corresponding segmented nuclei (right two columns) at different z-depths showing DRAQ5 signals in gray and segmented nuclei in different colors. The corresponding image stacks were taken in the absence or presence of z-compensation, as indicated. SNR values measured in the shown raw images are given in their upper left angles. Scale bars, 50 μm. Quantitative analysis of Draq5 + nuclei (B) , KI67 + nuclei (C) , and ratio of KI67 + /DRAQ5 + nuclei (D) in the absence or presence of z-compensation.
Data show mean +
SD; n ≥ 9; ** p ≤ 0.01; *** p ≤ 0.001. Measurement of spheroid diameter and depth-dependent z-axis profile: the average size of each spheroid before and after fixation was determined by measuring the sample diameter twice in a perpendicular angle using the line tool of FIJI ( Schindelin et al., 2012 ) on maximum z-projections made from image stacks acquired by confocal microscopy. For measuring the depth-dependent signal intensity, a circular region of interest (ROI) with a diameter of 100 μm was placed in the central region of each spheroid. The ROI area was duplicated from the original image stack and the mean signal intensity determined for each single optical section by using FIJIs function to plot a z-axis profile. Signal-to-Noise Ratio For the depth-dependent SNR, ROI-stacks for the measurement of signal intensity were used to determine intensity values of background and nuclear signal. Briefly, a median filter (radius 1) was applied to image stacks from a central region of each spheroid and a threshold range was manually set in upper regions of the sample, to cover areas defined as background, and converted into binary masks. ROIs generated from binary masks were used to automatically measure mean background intensity and standard deviation from the initial image stack. For determination of signal intensity of nuclear dyes, an automated thresholding mechanism was applied independently to each optical section and images were converted into binary masks, which were used to measure signal intensities from initial stacks. SNR was calculated for each optical section and defined as: SNR = μ SIGNAL σ BACKGROUND where μ depicts mean intensity of signal and σ the standard deviation of background intensity. In order to measure excitation wavelength-dependent differences in SNR, DAPI and DRAQ5 were analyzed. 3D-Segmentation of Nuclei 3D confocal data were pre-processed using Fiji. This included image cropping, splitting of multichannel datasets into single channel stacks to segment cell nuclei and antibody staining separately, background correction, conversion into 8-bit format, and export as tiff files. Segmentation and quantification of stacks was performed with a previously published algorithm ( Schmitz et al., 2017 ) which employs 3D-seeded watershed for segmentation. Parameter values were adjusted using the build-in graphical user interface. The median filter range was set to 3 pixels, local threshold range to 10 pixels, and hole filling range to 1 pixel. For seed detection, Laplace of Gaussian (LoG) with a seed range between 9 and 25 pixels was chosen. The other parameters were applied as default. Post-segmented data were exported as different 3D stacks in tiff format and a XLSX file containing quantitative results.
Statistical Analysis
Statistical analysis employed the program GraphPad Prism 8. Data were tested for normal distribution by Kolmogorov-Smirnov test. For statistical analysis of spheroid size measurements, non-parametric Kruskal-Wallis with Dunn’s multiple comparisons test was performed. Analysis of segmentation results was done by one-way ANOVA with Tukey’s multiple comparisons test. Significance level α was set to 0.05 with 95% confidence interval and p-values were adjusted to account for multiple comparisons.
Signal Intensity in Depth Depends on Clearing Method, Cell Line, and Fluorophore To quantify the decay of DAPI and DRAQ5 signal intensities as a function of depth, mean intensities at each optical section were measured in circular ROIs placed in the central region of each spheroid. To compensate for clearing-induced volume changes of samples, depth values were normalized to pre-fixation diameters multiplied with the percentage change of swelling or shrinkage (normalized depth). Mean data were plotted for HaCaT spheroids in Figures 4A,B , and for all other cell lines in Supplementary Figure S4 . This showed that different clearing protocols can be better suited to either DAPI or DRAQ5, or to a specific cell line. In all spheroids, maximal brightness values were seen in the upper parts of spheroids, followed by exponential decays. As indicated by the 50% and 90%-signal decay depths, Glycerol or Sca l eS were superior for most of the samples ( Supplementary Table S3 ). CytoVista was good in HT29 and HTC-8 cells, whereas Clear T2 was not superior for any condition. Overall, 50% loss of signal intensity ranged from 85 to 133 μm of depth for DAPI and from 56 to 127 μm for DRAQ5 ( Supplementary Table S3 ). 90% loss of signal intensity ranged from 151 to 327 μm of depth for DAPI and from 133 to 331 μm for DRAQ5 ( Supplementary Table S3 ).
Supplementary Material The Supplementary Material for this article can be found online at: https://www.frontiersin.org/articles/10.3389/fmolb.2020.00020/full#supplementary-material Click here for additional data file. Click here for additional data file. Click here for additional data file. Click here for additional data file. Click here for additional data file. Click here for additional data file. Click here for additional data file. Click here for additional data file. Click here for additional data file. Click here for additional data file.
📊 Figures
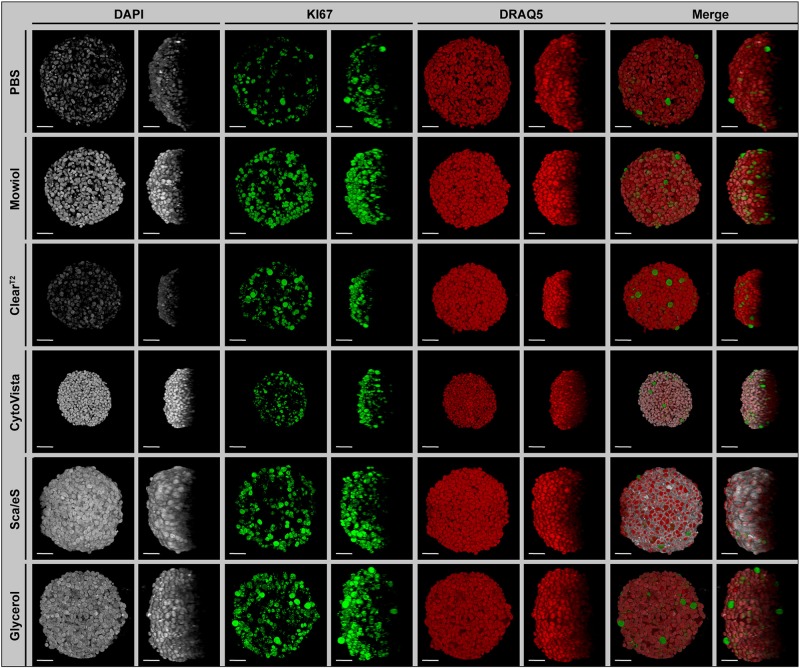
FIGURE 1
Preservation of fluorescence signal intensity, sample volume and optical transparency is strongly dependent on optical clearing protocol. Upon growth to a diameter of approximately 300 u03bcm, spheroi...
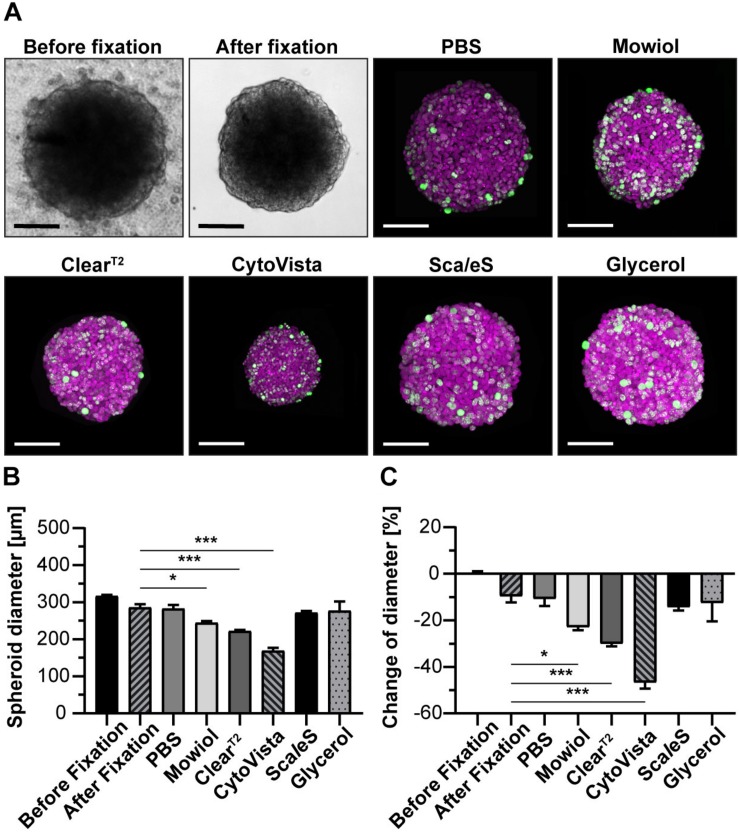
FIGURE 2
Aqueous clearing methods and detergent-containing hyperhydration prevent massive post-fixation volume changes. Upon growth to a diameter of approximately 300 u03bcm, spheroids made of HaCaT keratinocy...
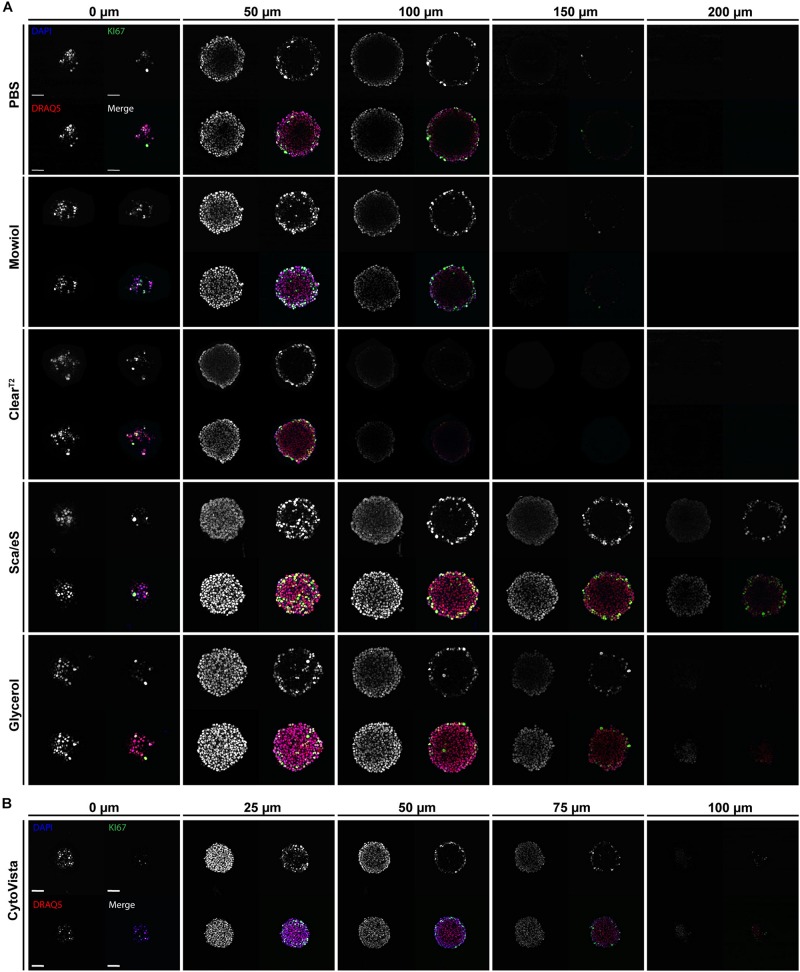
FIGURE 3
High-refractive index aqueous solutions or detergent-containing hyperhydration improve light penetration into spheroids. Upon growth to a diameter of approximately 300 u03bcm, spheroids made of HaCaT ...
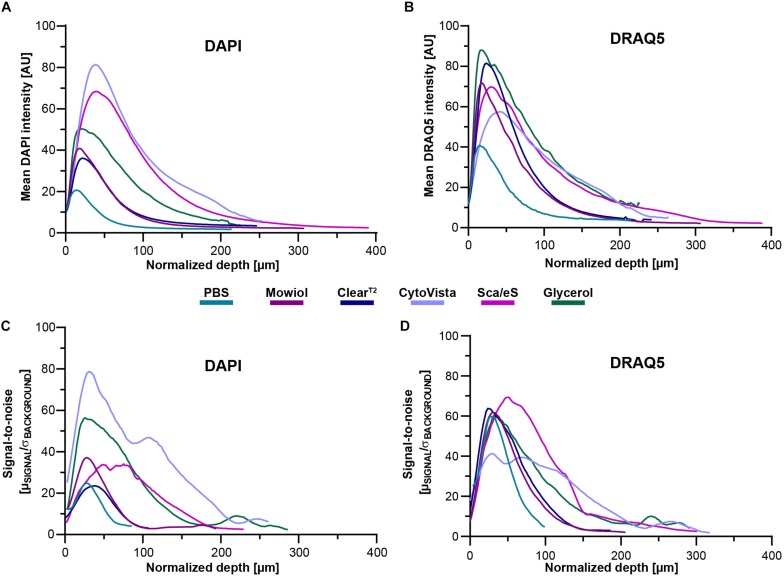
FIGURE 4
Optical transparency, preservation of fluorescence signals and depth-dependent SNR are dependent on clearing method and cell line. Mono-culture spheroids of HaCaT cells were grown to approximately 300...
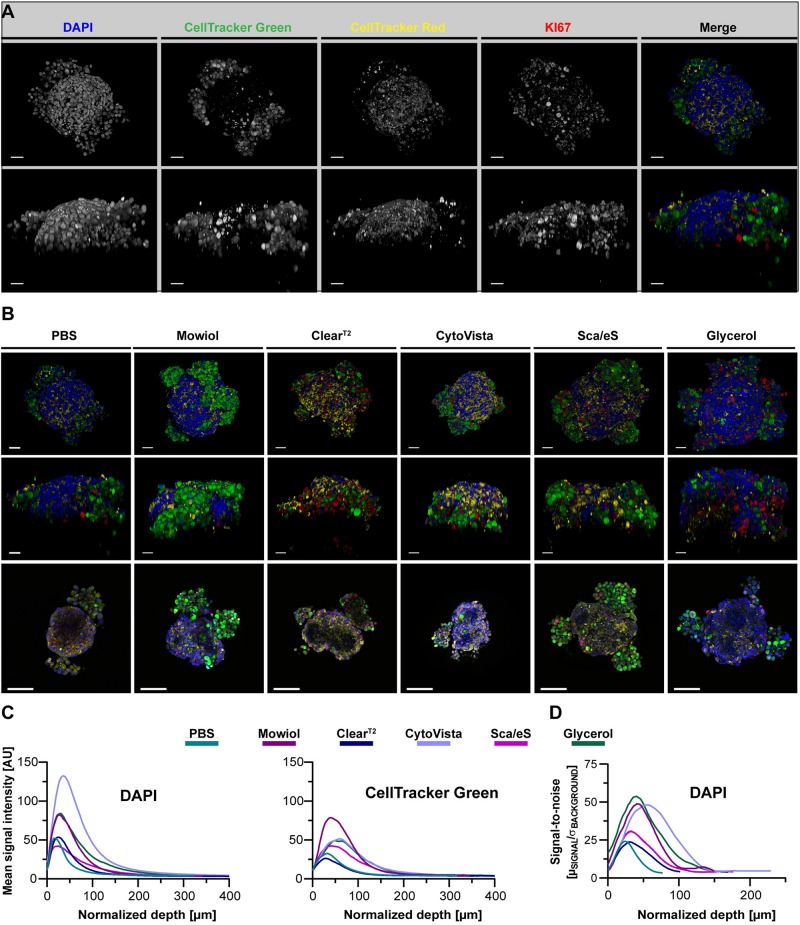
FIGURE 5
Optical clearing efficiency is affected by complexity of a spheroid-based tri-culture model. Melanoma tri-culture spheroids were generated starting with formation of a core spheroid of CCD-1337SK fibr...
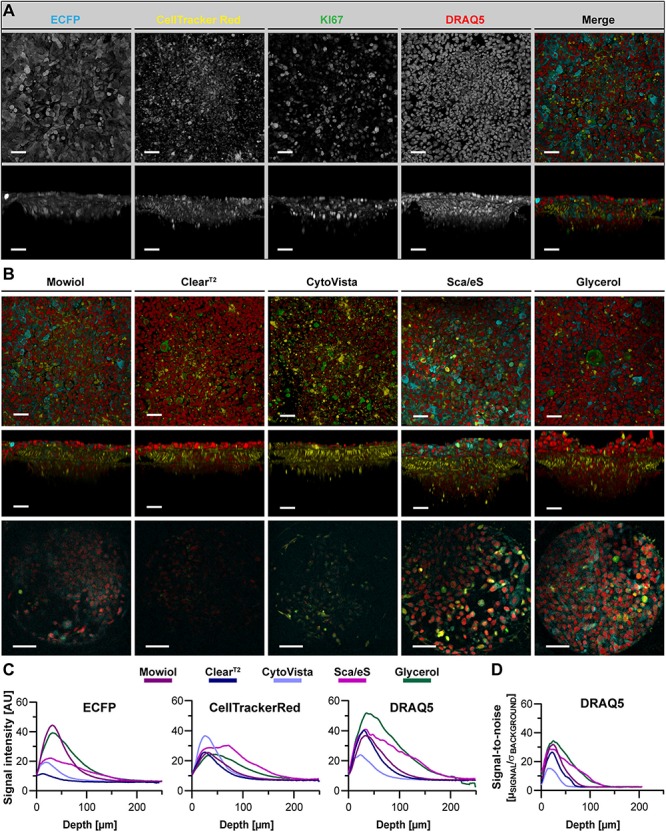
FIGURE 6
ECFP fluorescence is maintained by Glycerol-RI matching in a chip-based co-culture model of breast cancer cells and fibroblasts. ECFP-expressing MDA-MB-231 breast cancer cells were co-seeded with Cell...
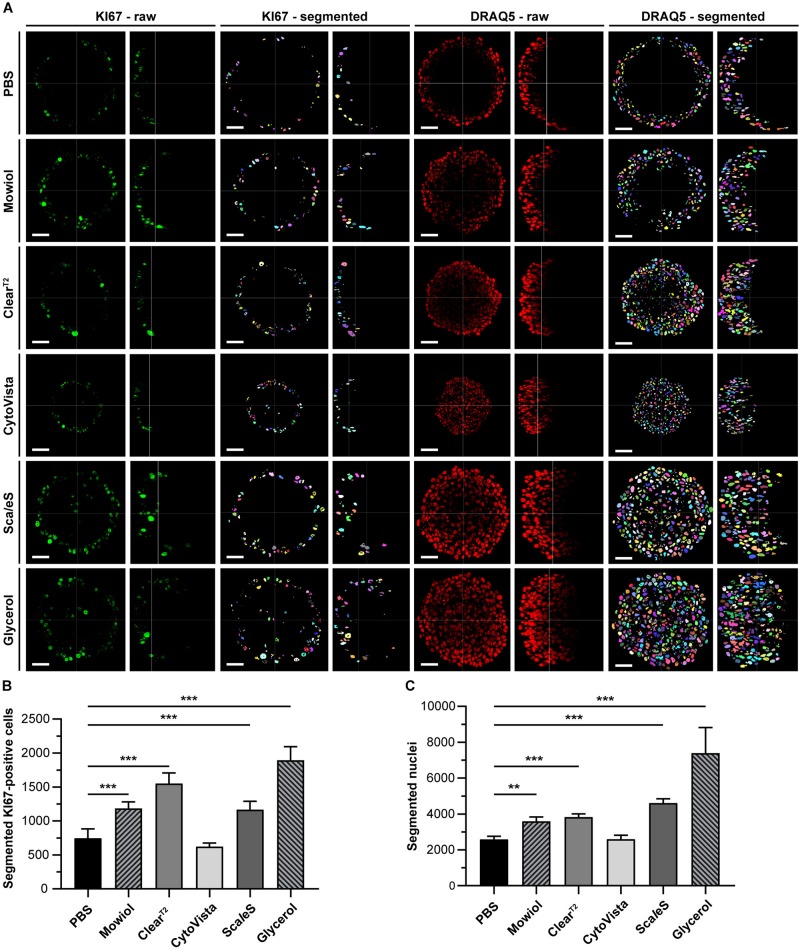
FIGURE 7
Optical clearing of HaCaT spheroids with Glycerol improves detection and quantification of cell nuclei. Upon growth to a diameter of approximately 300 u03bcm, spheroids made of HaCaT keratinocytes wer...
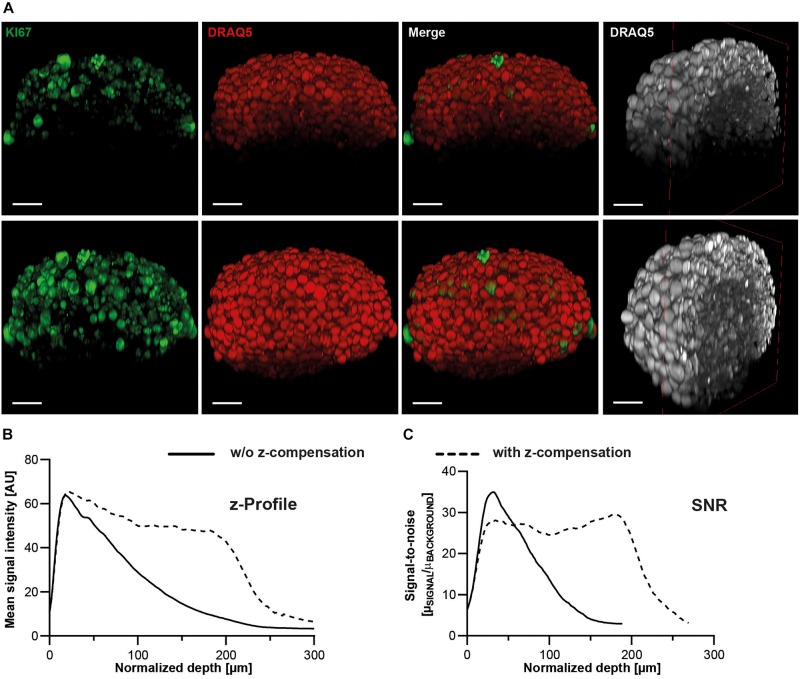
FIGURE 8
Z-profiles of signal intensity and SNR remain more stable upon z-compensation. Upon growth to a diameter of approximately 300 u03bcm, spheroids made of HaCaT keratinocytes were fixed, stained with ant...
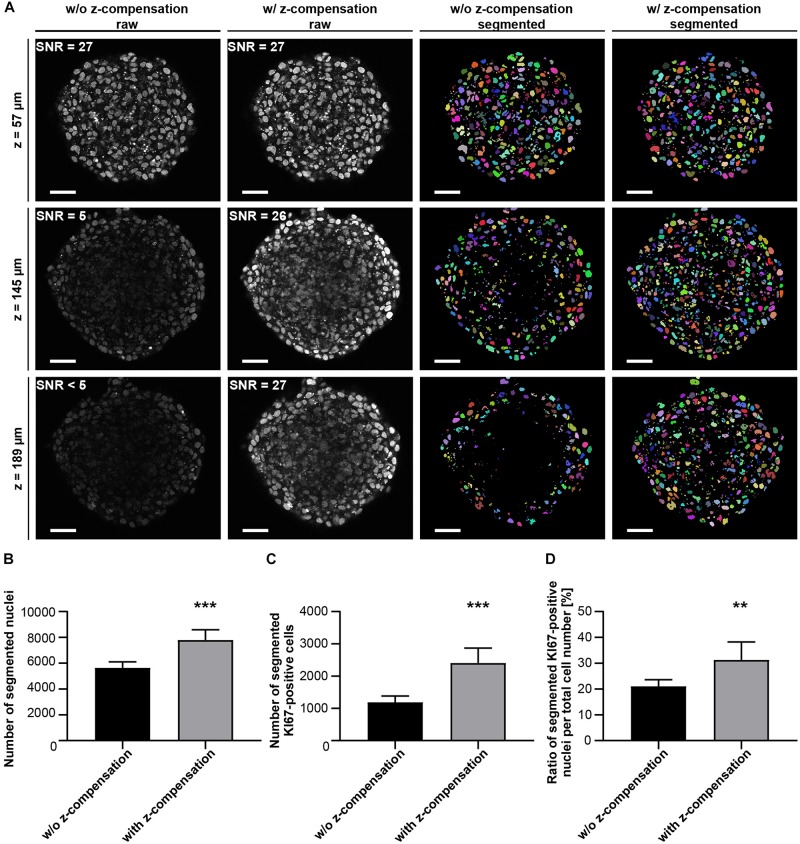
FIGURE 9
Z-compensation improves semi-automated segmentation of nuclei. Upon growth to a diameter of approximately 300 u03bcm, spheroids made of HaCaT keratinocytes were fixed, stained with anti-KI67 and DRAQ5...
Figure images are served from the NIH/NLM PubMed Central Open Access Subset or Europe PMC; copyright remains with the publishers and authors.
💬 Discussion
0 commentsNo comments yet. Be the first to start a discussion!
Leave a Comment