Abstract
Mitophagy is a natural phenomenon and entails the lysosomal degradation of mitochondria by the autophagy pathway. In recent years, the development of fluorescent pH-sensitive mitochondrial reporters has greatly facilitated the monitoring of mitophagy by distinguishing between cytosolic mitochondria or those delivered to acidic lysosomes. We recently published the mito-QC reporter, which consists of a mitochondrial outer membrane-localised tandem mCherry-GFP tag. This allows the quantification of mitophagy via the increase in red-only mCherry signal that arises when the GFP signal is quenched upon mitochondrial delivery to lysosomes. Here we develop a macro for FIJI, the mito-QC Counter, and describe its use to allow reliable and consistent semi-automated quantification of mitophagy. In this methods article we describe step-by-step how to detect and quantify mitophagy and show that mitophagy levels can be reliably calculated in different cell lines and under distinct stimuli. Finally, we show that the mito-QC Counter can be used to quantify mitophagy in tissues of mito-QC transgenic mice. We demonstrate that mitophagy levels in skeletal muscle correlates with glycolytic activity. Our present data show that the mito-QC Counter macro for FIJI enables the robust quantification of mitophagy both in vitro and in vivo.
🔬 Techniques
🔭 Microscopes
💻 Software
✨ Fluorophores
🧪 Sample Preparation
🔬 Cell Lines
🏭 Microscope Brands
🧪 Reagent Suppliers
🔎 Objectives
💻 Software Details
💻 Code & Software
💾 Data Repositories
🏛️ Research Organizations (ROR)
Affiliated research institutions:
📋 Methods
3 Protocol on how to use the mito-QC Counter A Download and install the mito-QC Counter macro 1 The file “ mQC_counter.ijm” ("version 1.0", DOI: 10.5281/zenodo.3466642) is available at the following address: https://github.com/graemeball/mQC_counter 2 Paste this file in the following folder: Windows: (the folder where you saved FIJI)fiji-win64Fiji.apppluginsScriptsPlugins Mac: Right click on the FIJI program and select “show package contents”. Select plugins→Scripts > Plugins and paste the file in this subfolder. 3 Start FIJI and install the plugin →Plugins→Macros→Install… Restart FIJI 4 We advise creating a shortcut for the plugin Plugins→Shortcut→Add Shortcut… (Example: F6) Restart FIJI B Find the appropriate settings for batch analysis using the single image mode 1 Open a picture with high mitophagy ( e.g. cells stimulated with deferiprone for 24 h ( Allen et al., 2013 )) Make sure the following options are selected in the Bio-Formats Import Options window that appears: View stack with: Hyperstack Color mode: Composite Click OK 2 Adjust the green channel brightness →Image→Adjust→Brightness/contrast… A new window appears called B&C. Slide the maximum cursor to the left until you can visualise the cell borders. This is needed so that the cell outline can be noted in the next step. 3 Select the “ Freehand Selection ” tool (Bean-shaped selection tool icon, 4 th from left) Draw around the first cell, then press “ t ” Repeat with all cells in the picture. 4 Start the macro (F6). A new dialog widow will appear. Make sure your green and red channels correspond to the values shown. Do not tick the batch box. In general, a radius for smoothing value of 1 is sufficient and there should be no need to change this value unless the image is oversampled or very noisy. Adjust the mito-QC Counter parameters: start with the default settings and press OK If results are not satisfactory using default threshold parameters, repeat this step and change the thresholds to exclude false negatives (missing peaks) and false positives (usually in low-intensity background regions). See troubleshooting Table 2 for more information. Table 2 Troubleshooting tips to use the mito-QC Counter. Table 2 Problem Solution Not enough dots detected. Decrease the Ratio image threshold. (ex:0.4) Decrease the spot red intensity threshold. (ex: mean(0) -1 stDev). Too many dots detected. Increase the Ratio image threshold (ex:0.6) Increase the spot red intensity threshold (ex: mean(0) +1 stDev). Unspecific dots (especially at the border of your cell). Increase the spot red intensity threshold (ex: mean(0) +1 stDev). Picture is very noisy.
Show full methods section
3 Protocol on how to use the mito-QC Counter A Download and install the mito-QC Counter macro 1 The file “ mQC_counter.ijm” ("version 1.0", DOI: 10.5281/zenodo.3466642) is available at the following address: https://github.com/graemeball/mQC_counter 2 Paste this file in the following folder: Windows: (the folder where you saved FIJI)fiji-win64Fiji.apppluginsScriptsPlugins Mac: Right click on the FIJI program and select “show package contents”. Select plugins→Scripts > Plugins and paste the file in this subfolder. 3 Start FIJI and install the plugin →Plugins→Macros→Install… Restart FIJI 4 We advise creating a shortcut for the plugin Plugins→Shortcut→Add Shortcut… (Example: F6) Restart FIJI B Find the appropriate settings for batch analysis using the single image mode 1 Open a picture with high mitophagy ( e.g. cells stimulated with deferiprone for 24 h ( Allen et al., 2013 )) Make sure the following options are selected in the Bio-Formats Import Options window that appears: View stack with: Hyperstack Color mode: Composite Click OK 2 Adjust the green channel brightness →Image→Adjust→Brightness/contrast… A new window appears called B&C. Slide the maximum cursor to the left until you can visualise the cell borders. This is needed so that the cell outline can be noted in the next step. 3 Select the “ Freehand Selection ” tool (Bean-shaped selection tool icon, 4 th from left) Draw around the first cell, then press “ t ” Repeat with all cells in the picture. 4 Start the macro (F6). A new dialog widow will appear. Make sure your green and red channels correspond to the values shown. Do not tick the batch box. In general, a radius for smoothing value of 1 is sufficient and there should be no need to change this value unless the image is oversampled or very noisy. Adjust the mito-QC Counter parameters: start with the default settings and press OK If results are not satisfactory using default threshold parameters, repeat this step and change the thresholds to exclude false negatives (missing peaks) and false positives (usually in low-intensity background regions). See troubleshooting Table 2 for more information. Table 2 Troubleshooting tips to use the mito-QC Counter. Table 2 Problem Solution Not enough dots detected. Decrease the Ratio image threshold. (ex:0.4) Decrease the spot red intensity threshold. (ex: mean(0) -1 stDev). Too many dots detected. Increase the Ratio image threshold (ex:0.6) Increase the spot red intensity threshold (ex: mean(0) +1 stDev). Unspecific dots (especially at the border of your cell). Increase the spot red intensity threshold (ex: mean(0) +1 stDev). Picture is very noisy.
Increase the radius for smoothing
High background fluorescence can lead to excessive detection of mitolysosome area and unreliable counting. Optimise experimental conditions to reduce background. We advise avoiding the use of mounting media containing nuclear dyes. Instead, counterstaining with nuclear dyes is possible if performed before the mounting step. Heterogenous population of cells expressing the reporter (viral or transient transfection). Estimation of mitochondrial content and linked parameters cannot be used in these conditions. If these parameters need to be assessed, we advise FACS sorting the cells to obtain a homogenous population. Bleaching of mCherry and/or GFP signal can lead to different ratios between pictures of the same sample and aberrant results in the mitophagy mask. Optimise sample preparation and/or acquisition parameters to reduce bleaching. Once you have found satisfactory parameters, check that they are appropriate with images of different treatments/genotypes. C Batch processing with the mito-QC Counter 1 Open the first picture Outline the first cell as above, then press “ CTRL ”+“ B ” to add the selection to the image overlay. Repeat with all cells in the picture. Press Reset in the B&C window Save the picture as a Tiff in a new folder (make 1 folder per condition) For the first picture: →File→Save as→Tiff… For the next pictures: “ CTRL” + “S ” Repeat for all images. 2 Start the plugin (F6). A new window appears, tick the batch box and use the parameters previously determined. Press OK , a new window will appear and you can now select the folder you have created containing the Tiff files with overlays. The plugin will automatically save for each image in that same folder: - a. csv file with all your results (see Table 1 ). - a mCherry/GFP ratio image. - a image with an overlaid of cell ROIs and detected peaks. - a “mitophagy mask” image which enables the visualisation of mitophagy.
7 Material and methods 7.1 Assessment of mitophagy in cell lines in vitro Experiments were conducted in either SH-SY5Y or ARPE-19 cells following American Type Culture collection (ATCC) guidance. In brief, cells were cultured in 1:1 DMEM:F-12 media (Thermo Scientific; #12634010) supplemented with 10 % (v/v) FBS (Sigma; #F7524), 2 mM l -glutamine (Thermo Scientific; #25030-024), 100 U/ml penicillin and 0.1 mg/ml streptomycin (Thermo Scientific; #15140-122) and incubated at 37 °C with 5 % CO 2 in a water-saturated incubator. The mito- QC reporter was retrovirally transfected as previously described ( Allen et al., 2013 ). Mitophagy was assessed from pools of cells transfected with the reporter. Iron chelation induced mitophagy with Deferiprone (DFP) (Sigma; #379409) was achieved as previously reported, where cells were treated with 1 mM DFP, dissolved in water before use with a pulse of heat (90 °C), for 24 h. For hypoxia treatment cells were transferred to a Ruskinn INVIVO2 300 workstation (Ruskinn/Baker) at 37 °C in 1 % O 2 and 5 % CO 2 , where were incubated for 42 h. After 36 h incubation in hypoxia, 50 nM of Bafilomycin A1 (Enzo; BML-CM110) was added to inhibit lysosome acidification during the remaining 6 h up to 42 h. The experiments using the mito- QC reporter to assess mitophagy were processed as previously described ( Allen et al., 2013 ). In brief, cells containing the mito- QC reporter were washed once with PBS (Thermo Scientific; #14190-094) and fixed with 3.7 % PFA (Sigma; P6148) in 200 mM HEPES (Formedium; HEPES10), pH 7.0 for 10 min at room temperature. Then, samples were washed twice with DMEM media supplemented with 10 mM HEPES pH 7.0 and 0.04 % Sodium Azide (Sigma; S8032), followed by a 10 min incubation. After two washes with PBS, coverslips were incubated with 1 μg/ml Hoechst (Thermo Scientific; #62249) for 30 min, washed three times with PBS, dipped in MilliQ water and mounted onto glass slides with ProLong Diamond Antifade Mountant (Thermo Scientific; # P36961 ). The immunostaining of SH-SY5Y mito- QC reporter cells with LAMP1 was performed as follow: cells were washing once with PBS and fixing cells with 3.7 % PFA pH 7.0 for 20 min at room temperature. The cross-linking reaction was quenched as described above. Cells were the permeabilised with 1 % BSA (Roche; #10735108001)/PBS + 0.1 % NP-40 (Merck/Millipore; #492016) for 3 min at room temperature. In contrast to tissue preparations, the permeabilization of cell in vitro can affect the red-only mitolysosome stability. Therefore, the quantification of mitophagy using the mito- QC reporter should be avoided after detergent permeabilization of cells in vitro . Following permeabilization and fixation, coverslips were next washed two times with 1 % BSA/PBS and followed by a 30 min incubation at room temperature. The LAMP1 primary antibody (Santa Cruz; sc-20011) were incubated at 1/300 in 1 % BSA/PBS for 1.5 h at 37 °C. Then, coverslips were washed with 1 % BSA/PBS four times of 10 min each. The secondary anti-mouse Alexa Fluor 647 nm antibody (Thermo Scientific; #A21236) was incubated at 1/1000 in 1 % BSA/PBS for 30 min in the dark at room temperature. Coverslips were washed again four times with 1 % BSA/PBS for 10 min each. Cells were then stained with Hoechst and mounted glass slides as described above. Images with the mito- QC reporter to quantify mitophagy were acquired using a Nikon Eclipse Ti widefield microscope (Plan Apo Lambda 60x Oil Ph3 DM) with the NIS-Elements software, while the images for the LAMP1 co-localisation experiment were acquired in a Leica SP8 laser scanning confocal microscope (HC PL APO 63x/1.40 oil CS2). All the images were processed with FIJI v1.52n software (ImageJ, NIH). Quantification of mitophagy was performed from three independent experiments counting over 50 cells for condition. Images were processed with the mito-QC Counter . For images acquired in the widefield microscope the following parameters were used: Radius for smoothing images = 1, Ratio threshold = 0.6, and Red channel threshold = mean + 0 standard deviation. For images acquired in the Leica SP8 confocal microscope the following parameters were used: Radius for smoothing images = 2, Ratio threshold = 1.5, and Red channel threshold = mean + 0.5 standard deviation.
Assessment of mitophagy in mouse tissues in vivo
Experiments were performed on mito- QC (mCherry-GFP-Fis1 101−152 ) reporter mice that were generated as previously described ( McWilliams et al., 2016 ; McWilliams et al., 2018 ). Experiments were performed on 4 adult mice (17–19 weeks old) of both genders, all homozygous for the mito- QC reporter. Animals were housed in sex-matched littermate groups of between two and five animals per cage in neutral temperature environment (21° ±1 °C), with a relative humidity of 55–65 %, on a 12:12 h photoperiod, and were provided food and water ad libitum . All experiments were performed in agreement with the guidelines from Directive 2010/63/EU of the European Parliament on the protection of animals used for scientific purposes. All animal studies and breeding were approved by the University of Dundee ethical review committee, and further subjected to approved study plans by the Named Veterinary Surgeon and Compliance Officer (Dr. Ngaire Dennison) and performed under a UK Home Office project license in agreement with the Animal Scientific Procedures Act (ASPA, 1986). Mice were terminally anesthetised with an intraperitoneal injection of pentobarbital sodium (Euthatal, Merial) then trans-cardially perfused with Dulbecco’s PBS (DPBS: Gibco, 14190-094) to remove blood. Tissues were collected and processed by overnight immersion fixation in freshly prepared 3.7 % Paraformaldehyde (Sigma, P6148), 200 mM HEPES, pH = 7.00. The next day, fixed tissues were washed three times in DPBS, and immersed in a sucrose 30 % (w/v) solution containing 0.04 % sodium azide. Samples were stored at 4 °C in that sucrose solution until further utilisation. Tissues were embedded in an O.C.T. matrix (Scigen, 4586) and frozen-sectioned with a cryostat (Leica CM1860UV). 12 microns sections were placed on slides (Leica Surgipath® X-tra™ Adhesive, 3800202), and then air dried and kept at -80 °C until further utilisation. Sections were thawed at room temperature and washed 3 times 5 min in DPBS (Gibco, 14190-094). Slides were then mounted using Vectashield Antifade Mounting Medium (Vector Laboratories, H-1000) and high precision cover glasses (No. 1.5H, Marienfeld, 0107222) and sealed with nail polish. Confocal pictures were obtained by uniform random sampling using a Zeiss 710 laser scanning confocal microscope (Plan-Apochromat 63x/1.4 Oil DIC M27) using the optimal parameters for acquisition (Nyquist). Representative tile scan was obtained using a 10x objective (EC Plan-Neofluar 10x/0.3). Representative images intensities were enhanced to improve visualisation in figures. Quantification of mitophagy was realised on 6 pictures per sample. Images were processed with the mito- QC Counter with the following parameters: Radius for smoothing images = 1, Ratio threshold = 1, and Red channel threshold = mean+1 standard deviation.
Appendix A Supplementary data
The following is Supplementary data to this article:
📊 Figures
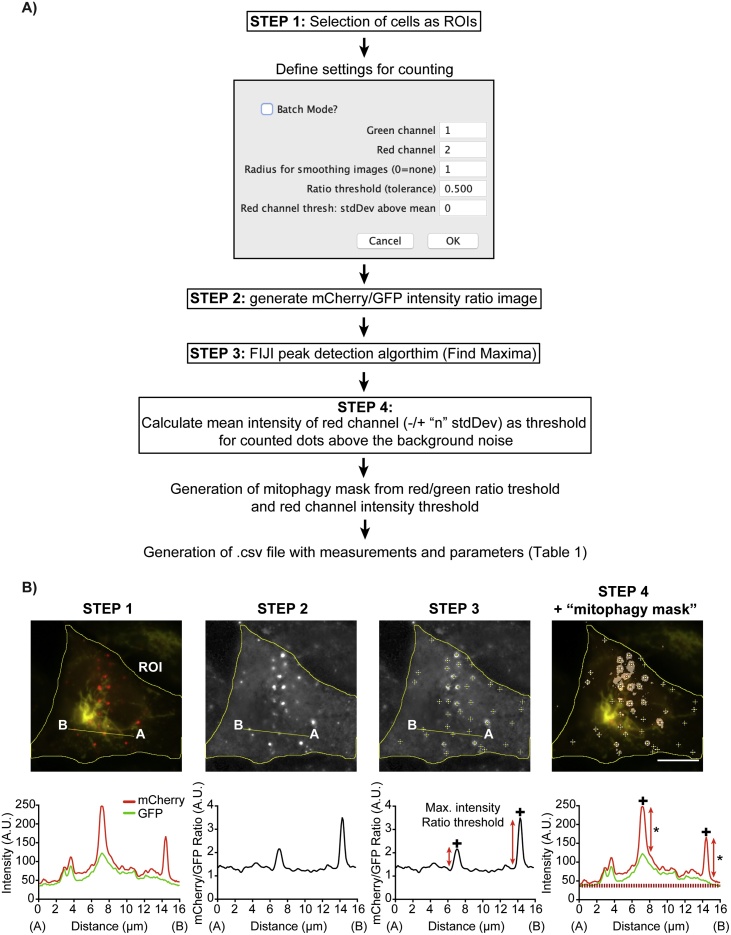
Fig. 1
The mito-QC Counter: a macroinstruction for FIJI to assess mitophagy with the mito-QC reporter. (A) Schematic workflow of the mito-QC Counter macro to quantify mitophagy and autophagy assays. (B) Repr...
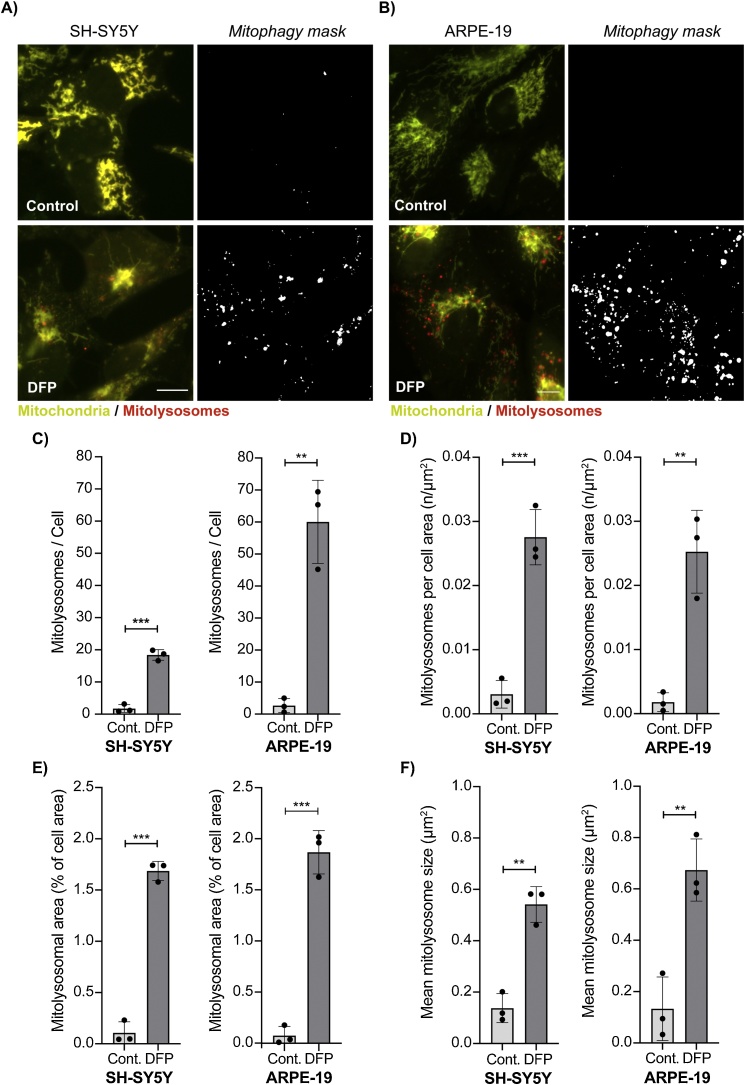
Fig. 2
Assessment of DFP-induced mitophagy in SH-SY5Y and ARPE-19 cells. (A/B) Representative widefield fluorescence images of SH-SY5Y and ARPE-19 cells expressing the mito -QC reporter. Mitophagy was stimul...
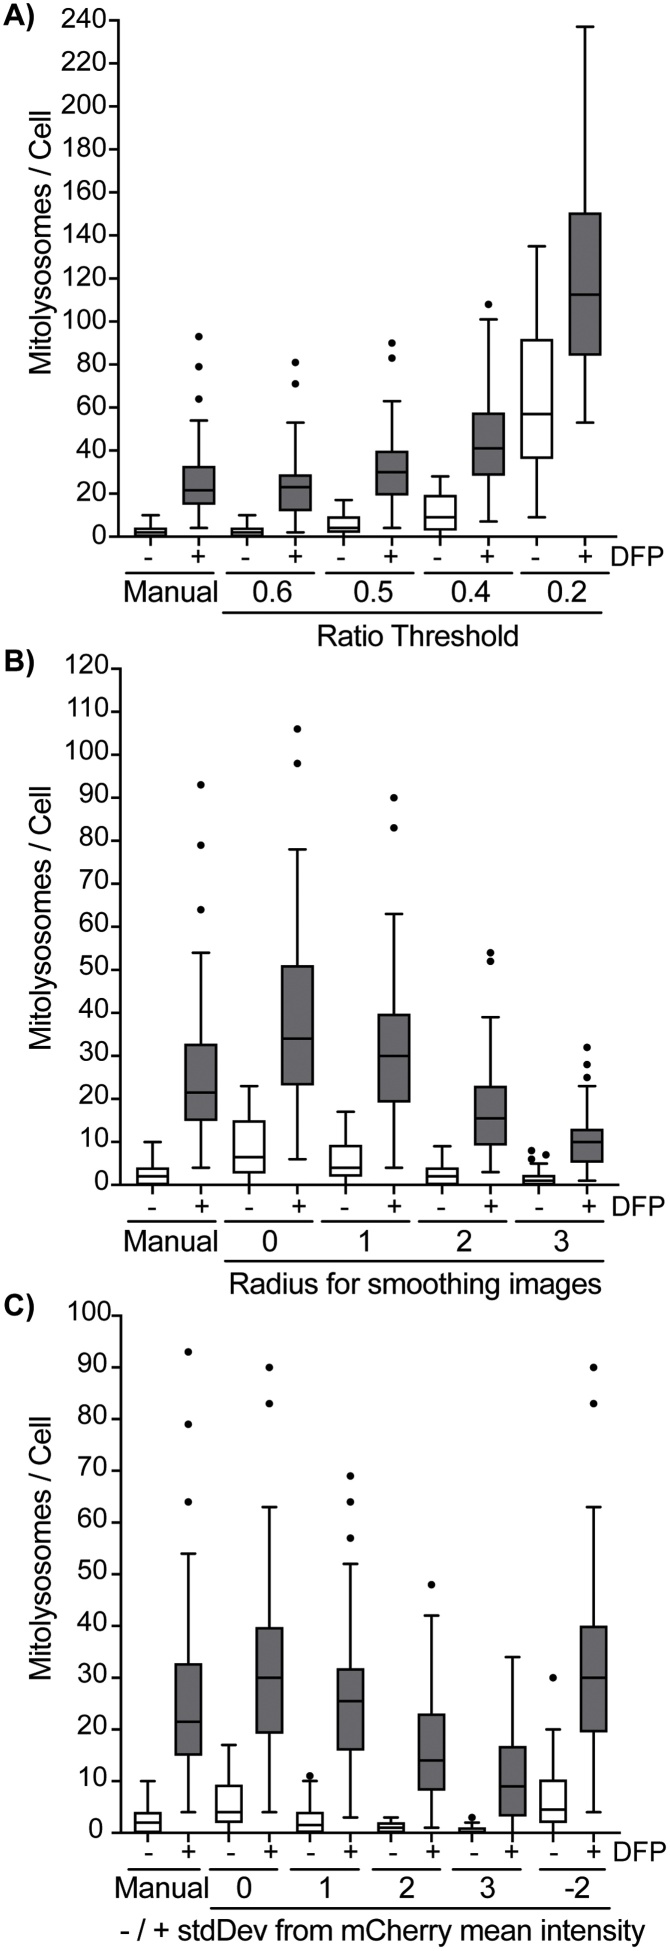
Fig. 3
Testing mito-QC Counter thresholding settings to assess mitophagy. SH-SY5Y cells expressing the mito-QC reporter were induced with 1u202fmM DFP for 24u202fh and the number of mitolysosomes was quantif...
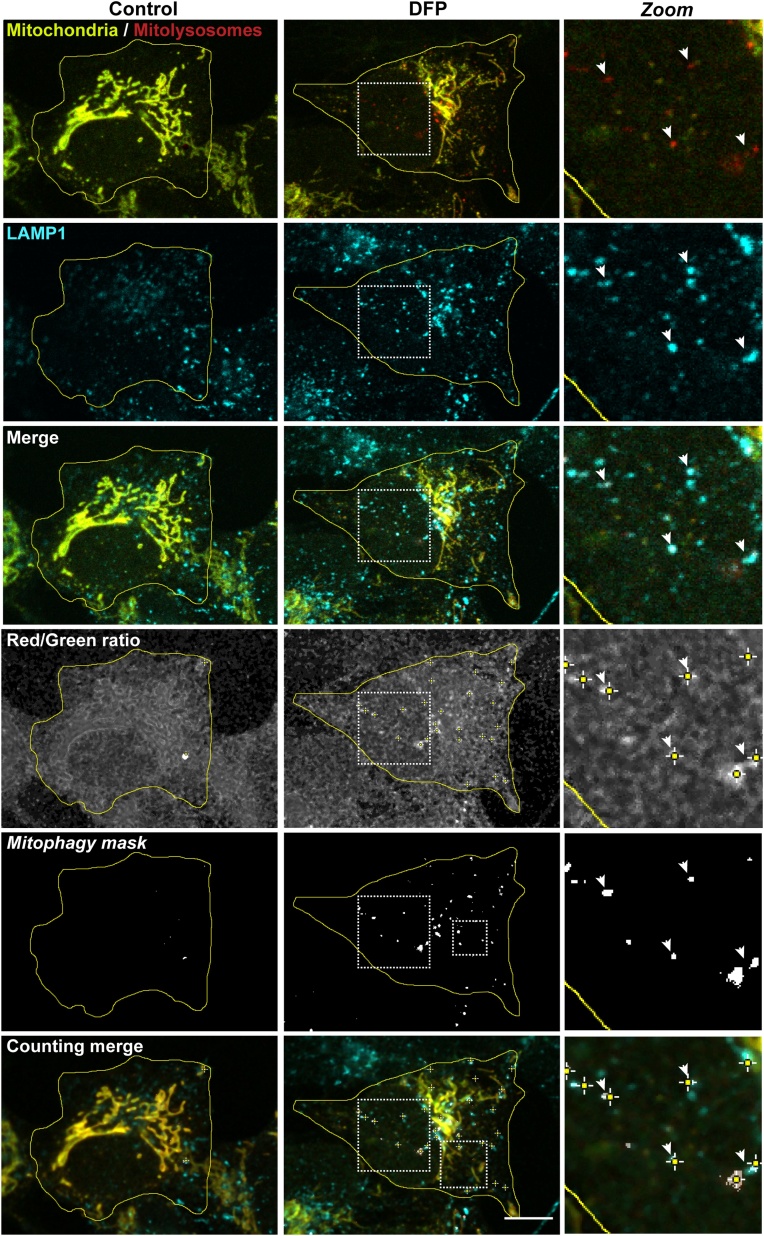
Fig. 4
The red-only puncta quantified by the mito-QC Counter are mitolysosomes. Representative confocal images of SH-SY5Y cells expressing the mito -QC reporter and stained with anti-LAMP1 antibody. Mitophag...
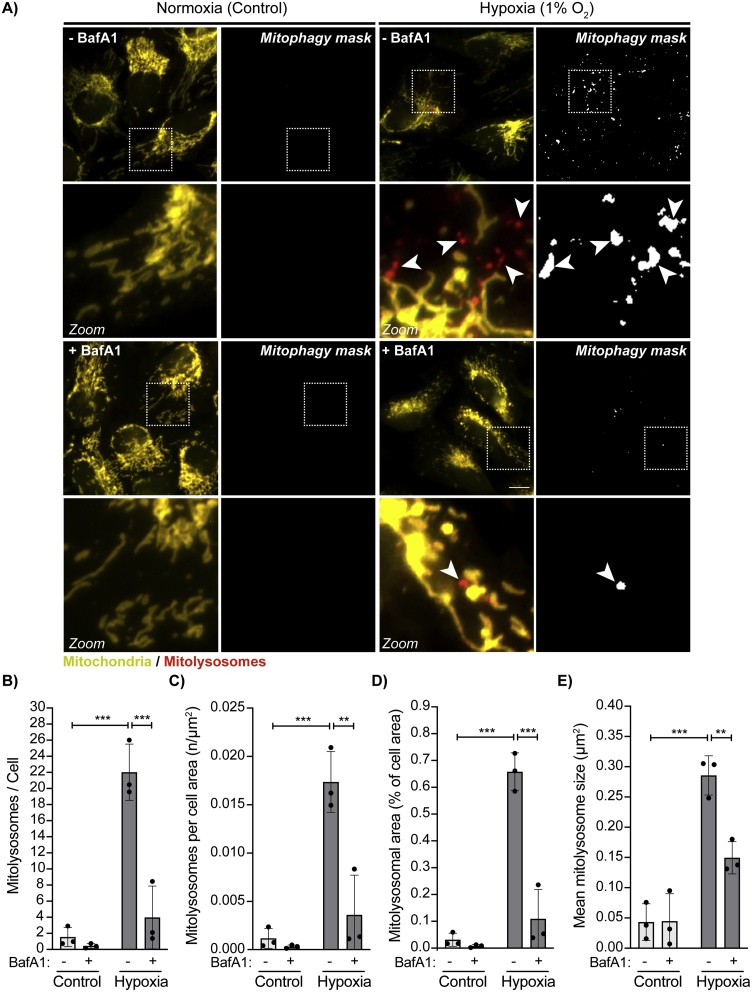
Fig. 5
Assessment of mito-QC Counteru2019s specificity in hypoxia-induced mitophagy with Bafilomycin A1. (A) Representative widefield fluorescence images of ARPE-19 cells expressing the mito-QC reporter and ...
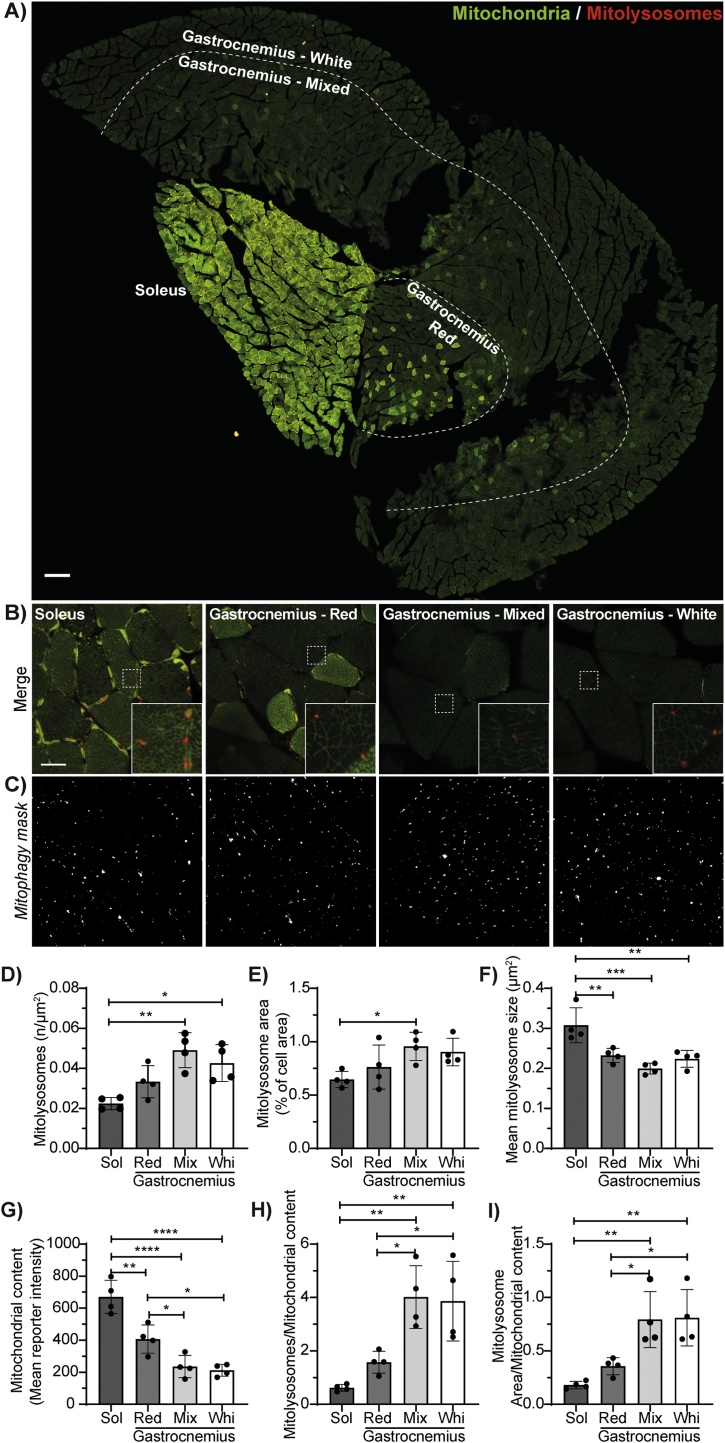
Fig. 6
The mito-QC Counter assesses in vivo basal mitophagy in skeletal muscle. (A) Representative tile scan of a transverse section of mito -QC mouse hindlimb skeletal muscles. Scale bar =200u202fu03bcm. (B...
Figure images are served from the NIH/NLM PubMed Central Open Access Subset or Europe PMC; copyright remains with the publishers and authors.
💬 Discussion
0 commentsNo comments yet. Be the first to start a discussion!
Leave a Comment