Abstract
AbstractNeuronal excitability has been shown to control the migration and cortical integration of reelin-expressing cortical interneurons (INs) arising from the caudal ganglionic eminence (CGE), supporting the possibility that neurotransmitters could regulate this process. Here we show that the ionotropic serotonin receptor 3A (5-HT3AR) is specifically expressed in CGE-derived migrating interneurons and upregulated while they invade the developing cortex. Functional investigations using calcium imaging, electrophysiological recordings and migration assays indicate that CGE-derived INs increase their response to 5-HT3AR activation during the late phase of cortical plate invasion. Using genetic loss-of-function approaches and in vivo grafts, we further demonstrate that the 5-HT3AR is cell autonomously required for the migration and proper positioning of reelin-expressing CGE-derived INs in the neocortex. Our findings reveal a requirement for a serotonin receptor in controlling the migration and laminar positioning of a specific subtype of cortical IN.
🔬 Techniques
🔭 Microscopes
🧬 Organisms
💻 Software
✨ Fluorophores
🧪 Sample Preparation
🏭 Microscope Brands
🧪 Reagent Suppliers
📷 Detectors
💻 Software Details
🏛️ Research Organizations (ROR)
Affiliated research institutions:
📋 Methods
Mice
Animal experiments were conducted according to the Swiss and international guidelines and approved by the local Geneva animal care committee. Adult timed pregnant mice were obtained by overnight (ON) mating and the following morning was counted as embryonic day (E) E0.5. To study CGE-derived INs, we used transgenic mice expressing GFP under the control of the GAD65 regulatory sequences ( GAD65- GFP) 25 30 and transgenic mice expressing the enhanced GFP under the control of the Htr3a regulatory sequences ( Htr3a- GFP) provided by the GENSAT Consortium 16 . Both strains were maintained on a C57Bl/6 background. C57Bl/6 wild-type mice were used for in vivo graft experiments. The Nkx2.1 -Cre mice have been previously described 32 and the R26R- tdTOM fl/fl reporter mice were obtained from Jackson Laboratory. Htr3a- GFP mice were crossed to R26R- tdTOM fl/fl mice to obtain Htr3a- GFP; R26R- tdTOM fl/fl mice. Htr3a -ko mice have been previously described 57 and crossed to GAD65- GFP mice to obtain Htr3a -ko; GAD65- GFP animals. Tissue processing and immunohistochemistry (IHC) Pregnant females were euthanized by lethal intraperitoneal (i.p.) injection of pentobarbital (50 mg kg −1 ), embryos were collected by caesarian cut and brains were dissected and fixed ON in cold 4% paraformaldehyde (PFA) dissolved in 0.1 M phosphate buffer, pH 7.4. For postnatal brains, animals were deeply anaesthetized by i.p. injection of pentobarbital, transcardially perfused with 0.9% saline followed by cold 4% PFA and postfixed (ON) in cold 4% PFA. Brains were cut on a Vibratome (Leica, VT1000S) for IHC and for free-floating in situ hybridization. Sections were kept at 4 °C in 0.1 M phosphate buffer saline and were stained by IHC as described 31 with the following primary antibodies rabbit anti-GFP (1:500; Millipore), goat anti-GFP (1:1,000; Chemicon), mouse anti-human ovalbumin upstream promoter transcription factor 2 (COUP-TFII; 1:500; Perseus proteomics), goat anti-SP8 (1:50; Santa-Cruz), rabbit anti-NKX2.1 (1:100; Santa-Cruz), mouse anti-PV (1:1,000; Swant), rat anti- SST (1:500; Millipore), mouse anti-Reelin (1:500; Abcam), rabbit anti-VIP (1:500; Abcam), rabbit anti-NPY (1:1,000; Immunostar), rabbit anti-Calretinin (1:1,000; Swant). Secondary goat or donkey Alexa-488, -568 and -647 antibodies (Molecular Probes, Invitrogen) raised against the appropriate species were used at a dilution of 1:500–1,000 and sections were counterstained with Hoechst 33258 (1:10,000). In situ hybridization Sections were hybridized as described previously 25 with the respective DIG-labelled RNA probes. The Htr3a plasmid probe 16 was linearized with HindIII-HF for RNA probe synthesis by T7 polymerase (kind gift from Dr B. Emerit). The Lhx6 plasmid probe 58 (kind gift from Dr M. Denaxa) was linearized with Not 1 for antisense RNA probe synthesis by T3 polymerase. The unbound probe was washed and slices were incubated with alkaline phosphatase-conjugated anti-DIG antibody (1:2,000; Roche) ON at 4 °C. NBT/BCIP (Roche) was then used as an alkaline phosphatase substrate to reveal the hybridized probe. Fast Red (Roche) was used as an alkaline phosphatase fluorescent substrate.
Show full methods section
Mice
Animal experiments were conducted according to the Swiss and international guidelines and approved by the local Geneva animal care committee. Adult timed pregnant mice were obtained by overnight (ON) mating and the following morning was counted as embryonic day (E) E0.5. To study CGE-derived INs, we used transgenic mice expressing GFP under the control of the GAD65 regulatory sequences ( GAD65- GFP) 25 30 and transgenic mice expressing the enhanced GFP under the control of the Htr3a regulatory sequences ( Htr3a- GFP) provided by the GENSAT Consortium 16 . Both strains were maintained on a C57Bl/6 background. C57Bl/6 wild-type mice were used for in vivo graft experiments. The Nkx2.1 -Cre mice have been previously described 32 and the R26R- tdTOM fl/fl reporter mice were obtained from Jackson Laboratory. Htr3a- GFP mice were crossed to R26R- tdTOM fl/fl mice to obtain Htr3a- GFP; R26R- tdTOM fl/fl mice. Htr3a -ko mice have been previously described 57 and crossed to GAD65- GFP mice to obtain Htr3a -ko; GAD65- GFP animals. Tissue processing and immunohistochemistry (IHC) Pregnant females were euthanized by lethal intraperitoneal (i.p.) injection of pentobarbital (50 mg kg −1 ), embryos were collected by caesarian cut and brains were dissected and fixed ON in cold 4% paraformaldehyde (PFA) dissolved in 0.1 M phosphate buffer, pH 7.4. For postnatal brains, animals were deeply anaesthetized by i.p. injection of pentobarbital, transcardially perfused with 0.9% saline followed by cold 4% PFA and postfixed (ON) in cold 4% PFA. Brains were cut on a Vibratome (Leica, VT1000S) for IHC and for free-floating in situ hybridization. Sections were kept at 4 °C in 0.1 M phosphate buffer saline and were stained by IHC as described 31 with the following primary antibodies rabbit anti-GFP (1:500; Millipore), goat anti-GFP (1:1,000; Chemicon), mouse anti-human ovalbumin upstream promoter transcription factor 2 (COUP-TFII; 1:500; Perseus proteomics), goat anti-SP8 (1:50; Santa-Cruz), rabbit anti-NKX2.1 (1:100; Santa-Cruz), mouse anti-PV (1:1,000; Swant), rat anti- SST (1:500; Millipore), mouse anti-Reelin (1:500; Abcam), rabbit anti-VIP (1:500; Abcam), rabbit anti-NPY (1:1,000; Immunostar), rabbit anti-Calretinin (1:1,000; Swant). Secondary goat or donkey Alexa-488, -568 and -647 antibodies (Molecular Probes, Invitrogen) raised against the appropriate species were used at a dilution of 1:500–1,000 and sections were counterstained with Hoechst 33258 (1:10,000). In situ hybridization Sections were hybridized as described previously 25 with the respective DIG-labelled RNA probes. The Htr3a plasmid probe 16 was linearized with HindIII-HF for RNA probe synthesis by T7 polymerase (kind gift from Dr B. Emerit). The Lhx6 plasmid probe 58 (kind gift from Dr M. Denaxa) was linearized with Not 1 for antisense RNA probe synthesis by T3 polymerase. The unbound probe was washed and slices were incubated with alkaline phosphatase-conjugated anti-DIG antibody (1:2,000; Roche) ON at 4 °C. NBT/BCIP (Roche) was then used as an alkaline phosphatase substrate to reveal the hybridized probe. Fast Red (Roche) was used as an alkaline phosphatase fluorescent substrate.
Preparation of dissociated cultures and acute slices
For migration studies, E14.5 and E17.5 cortices from GAD65 -GFP + coronal sections were isolated under a fluorescence scope (Leica, M165 FC) through microdissection. For calcium recordings, microdissection of the CGE of E14.5 Htr3a- GFP caudal coronal slices and cortices of E14.5 wild-type coronal slices was performed. Isolated tissue was collected in Hanks’ balanced salt solution (HBSS), manually triturated and dissociated in trypsin at 37 °C for 15 min and blocked in fetal calf serum. Dissociated cells were then centrifuged for 5 min at 1,200 r.p.m. and pellets were resuspended in neurobasal medium (NBM; Invitrogen) supplemented with 2% B27 (Gibco), 2 mM glutamine, 1% penicillin–streptomycin, 2 mM N -acetyl-cysteine and 1 mM sodium pyruvate. For migration assays, cells were plated in 96-well microplates (Costar 3720) coated with laminin (10 μg ml −1 ; Invitrogen) and poly- D -lysin (0.1 mg ml −1 ; Sigma). Acute brain slices were prepared as described 24 from Htr3a -GFP+, GAD65 -GFP+ and Htr3a -ko; GAD65 -GFP + embryos. Briefly, brains were extracted, embedded in HBSS with 3% ultra-pure low-melting point agarose (Invitrogen or Roth) and 250-μm-thick slices were cut on a Vibratome (VT1000S; Leica) in cold oxygenated (95% O 2 , 5% CO 2 ) artificial cerebrospinal fluid (ACSF) containing (in mM): NaCl (125), KCl (3), CaCl 2 (1.6), MgCl 2 (1.5), NaH 2 PO 4 (1.25), NaHCO 3 (26), D -glucose (10) Na 2 HPO 4 , pH 7.6). FACS and microarrays Acute cortical slices were prepared as described above and under a fluorescence dissecting scope (Leica, M165 FC), the E14.5 pallium including the SVZ stream and the E18.5 and P2.5 developing cortices excluding the SVZ stream were isolated from GAD65- GFP+ caudal coronal slices. Each time point was obtained in triplicate from three different litters and consisted of pooled embryos or pups ( n =4–5). Following dissociation of the tissue, GAD65 -GFP + cells were isolated using FACS with the FACS VantageSE and collected in RNA Later solution (Invitrogen). RNA from the cells was extracted using the RNeasy Mini kit (Qiagen) and the quality was checked on an Agilent 2100 Bioanalyser (Agilent Technologies). A small-scale protocol from Affymetrix (High Wycombe) was used to reproducibly amplify and label total RNA. Briefly, approximately 100 ng total RNA was converted into double-stranded cDNA using a cDNA synthesis kit (Superscript; Invitrogen) with a special oligo(dT)_24 primer containing a T7 RNA promoter site added to the 5′ poly(T) tract. After the first cRNA amplification by in vitro transcription using the Ambion MEGAscript T7 kit (Ambion), 400 ng cRNA was once more reverse transcribed, and biotinylated cRNAs were generated from double-strand cDNAs using an in vitro transcription labelling kit from Affymetrix. For each probe, 20 μg of the second amplification biotinylated cRNA was fragmented and hybridized to Mouse Genome 430 2.0 Array (Affymetrix) following the standard protocols. GeneChips were incubated at 45 °C for 16 h with biotin-labelled cRNAs probes, and washed and stained using a streptavidin–phycoerythrin conjugate with antibody amplification using Affymetrix GeneChip Fluidis Station 450. GeneChips were scanned on a GC3000 scanner (Affymetrix). The signal intensities were analysed using the Partek Genomics suites (version 6.6 beta) and the data were normalized using robust multi-array average (RMA) 59 . The messenger RNA expression levels of genes (ProbeSet) were compared using a two-way analysis of variance model and contrasted with uncorrected P values set at 2-fold intensity increase from E14.5 versus E18.5 and >2-fold intensity decrease from P2.5 versus E18.5.
ELISA quantification of protein expression
Microdissection of the CGE was performed at E14.5, trypsinized dissociated cells were plated on 96-well plates and cultured in NMB supplemented with m CPBG (10 μM; Tocris) and the mitotic inhibitor arabinofuranosyl cytidine (1 μM). Quantification of protein levels was performed using ELISA kit (Thermo scientific) and 5-HT 3A R antibody (1:1,000, LSBio) on E14.5 day in vitro 1 (+DIV1) or E14.5 (+DIV4) cells. Absorbance levels were measured on a SpectraMax Paradigm Multimode Microplate detection reader (Molecular Devices). Absorbance levels for the 5HT 3A R were normalized to absorbance levels calculated for the total amount of cells via Janus Green whole-cell staining. Focal electroporation on slices For focal electroporation on slices, acute coronal slices of E14.5 Htr3a -GFP + embryos were transferred on membranes (nucleopore Track-Etch; 1 μm pore size, Whatman) floating on NBM in an incubator (37 °C, 5% CO 2 ) for at least 2 h following Vibratome sectioning. A plasmid encoding for a red fluorescent protein (pUBI-tdTOM) was focally injected at the concentration of 1 μg ml −1 through a beveled glass micropipette into the MGE using a nanoinjector (B203XVZ; WPI) and precision of the injection site was controlled by addition of 10% Fast Green (Sigma) to the plasmid. The slices were kept moisturized in HBSS and electroporated between platinum Petri dish and cover square platinum electrodes (CUY701-P5E and CUY701-P5L; Nepa Gene) with two unipolar square pulses (Δ P : 100 V; duration: 5 ms; interval: 500 ms) generated by a CUY21-SQ electroporator (Nepa Gene). Slices were then cultured 3 days in vitro (+DIV3) in an incubator (37 °C and 5% CO 2 ).
Calcium imaging and analysis
Calcium experiments were performed in CGE-isolated cultures (E14.5 +DIV1–3; see above; Preparation of dissociated cultures and acute slices). Cell cultures were loaded with Fura-2AM (1 μM; Invitrogen) in NBM for 20 min in an incubator (37 °C, 5% CO 2 ). Observations were done in a bath chamber (RC-26; Warner Instruments) continuously superfused with ACSF (95% O 2 , 5% CO 2 ) under an inverted epifluorescence microscope (Observer Z1; Zeiss) equipped for live imaging (Life Technologies) with an oil-immersion × 40 objective (Zeiss, Fluar × 40/1.3 oil Ph3) and CoolSNAP-HQ camera. ACSF and microscope bath chamber temperatures were kept at 37 °C. The software MetaFluor (version 7.7.0.0; Molecular Devices) was used to acquire images each second and monitor intracellular calcium changes. Calcium events were analysed in Clampfit (version 9.2.0.11; Molecular Devices). A baseline recording was obtained before challenging cells with m CPBG (1 μM,) or SR57227 hydrochloride (1 μM). To isolate specific responses to 5-HT 3A R activation, experiments were performed with blockers for voltage-gated sodium channels, AMPA receptors, NMDA receptors and GABA A receptors (respectively, TTX, 200 nM; NBQX, 2 μM; D-AP5, 20 μM and gabazine, 4 μM; Tocris) superfused 5 min before and along with m CPBG. Cell viability was systematically assessed by a final surperfusion of 100 mM KCl in ACSF. A calcium event was defined as a calcium increase two times greater than the baseline activity and lasting for more than 1 s. Htr3a -GFP + cINs were recorded at E14.5 (+DIV1) and E14.5 (+DIV3) in the presence and absence of blockers.
Electrophysiological recordings
Coronal brain sections of 300-μm thick were obtained at E14-E15, E18-E19, P2/P3 using a Vibratome (Leica, VT1000S). During recording, slices were continuously superfused with ACSF containing (in mM): NaCl (120), KCl (3.5), CaCl 2 (2.5), MgSO 4 (1.3), NaH 2 PO 4 (1.25), NaHCO 3 (25), glucose (25), continuously bubbled with 95% O 2 and 5% CO 2 , pH 7.4. Whole-cell voltage and current clamp recordings were made from visually identified GFP + neurons using an EPC9 amplifier (HEKA) and an upright microscope (Zeiss Axioskop FS2) equipped with infrared differential interference contrast (IR-DIC) and standard epifluorescence. Patch pipettes had a resistance of 4–6 MΩ when filled with (in mM): 105 K-gluconate, 30 KCl, 0.5 CaCl 2 , 5 EGTA, 2 Mg-ATP, 10 HEPES. Application of serotonin (5-HT, 100 μM; Tocris) or SR 57227 hydrochloride (100 μM; Tocris) was performed via pressure ejection from a second pipette connected to a picospritzer. To isolate specific responses to 5-HT 3A R activation, recordings at E17-E18 were performed with blockers (TTX, 1 μM; NBQX, 10 μM; D-AP5, 100 μM and gabazine, 20 μM; Tocris). Cells were voltage clamped at −60 mV and currents were evoked by series of 20-ms-duration depolarizing voltage pulses. Current clamp recordings were performed in response to long (1 s) hyperpolarizing and depolarizing current injections. Signals were filtered at 1–5 kHz, sampled at 2–10 kHz and off-line analysis was performed using Igor Pro (Wavemetrics).
Time-lapse imaging and analysis
Time-lapse imaging of migrating GAD65 -GFP + cells in cultures was performed using an automated microscope (ImageXpress Micro XL; Molecular Devices) equipped with objective × 10 (Plan Fluor × 10/0.30 Ph1), which allows the simultaneous recording of migrating cells in multiple wells at 37 °C under 95% O 2 and 5% CO 2 . Following a control time-lapse imaging period of 360 min, SR57227 hydrochloride (100 nM; Tocris), serotonin (5-HT, 100 nM; Tocris) or vehicle (NBM) was added to the medium and recordings were performed for an additional 360 min. Using Metamorph software (version 7.4; Molecular Devices), cells were tracked at E14.5 (+DIV1) and at E17.5 (+DIV1). Time-lapse imaging of cortical invasion of cINs was performed on cortical slices at E17.5, placed on porous nitrocellulose (Millicell-CM, Millipore) inserts in Fluorodishes (WPI) filled with NBM and with an inverted confocal microscope (Nikon A1R) equipped for live imaging (Life Technologies) with a long working distance × 20 objective (CFI Plan Fluor ELWD C × 20/0.45, Nikon). The microscope incubation chamber temperature was kept at 37 °C with a constant flux (25 l h −1 ) of 5% CO 2 humidified at 96%. 50-μm-thick stacks (3 μm-stepped) were acquired every 10 min during 10–12 h, with resonant laser scanning to reduce toxicity and to avoid bleaching. The first 90 min of movies were removed from analysis to avoid bias in measurements because of settling of the slices in the microscope chamber. For quantification of cortical invasion, the intermediate zone (260–410 μm from the pia) and cortical (50–220 μm from the pia) compartments were manually drawn in Metamorph and GFP + INs from GAD65 -GFP + and Htr3a -ko ; GAD65 -GFP + slices located in the IZ compartment at start were tracked during 8 h. The percentage of GAD65 -GFP + INs entering the cortex and not going back into the IZ or further migrating in the MZ during the 8-h time period was calculated. Migration speed was calculated as the total distance travelled by GAD65 -GFP + INs divided by total imaging time excluding the pausing time. The percentage pausing time was calculated as the fraction of time the cell nucleus was stationary during the imaging period. For simultaneous imaging of growth cones of CGE INs and MGE INs, E14.5 (+DIV3) Htr3a -GFP + slices that were focally electroporated in the MGE (see Focal electroporation on slice) were placed in the bath chamber (RC-26; Warner Instruments) and were immobilized with an anchor. Imaging was done in the CP with a continuous superfusion of oxygenized ACSF (95% O 2 , 5% CO 2 ) under an inverted confocal microscope (Nikon, A1R) equipped for live imaging with a × 60 oil-immersion objective (Plan Apo VC H × 60/1.4, Nikon) with a × 3 numerical zoom. ACSF and microscope incubation chamber temperatures were kept at 37 °C. 10-μm-thick stacks (1 μm-stepped) were acquired every 2 min with resonant laser scanning. Dual imaging was done in channel series mode to avoid fluorescence crosstalk. Imaging sessions were systematically started 20–30 min after immersion of the slice in ACSF to avoid axial drift, loss of focus and bias in measurement because of settling of the slice. A standard imaging session was composed of a baseline period of 14 min followed by 14 min drug application ( m CPBG, 100 μM; Tocris) and 2 × 14 min wash. Time-lapse stacks were aligned using Metamorph software (version 7.4). For quantification, contours of the growth cone were manually drawn using Metamorph and their speed of progression as well as their area was measured. The speed was calculated by tracking the base of the growth cone. The leading process was taken as an axis of growth so that all movements towards the growth cone were considered positive and those towards the cell body negative. In vivo grafts The CGE of E14.5 GAD65 -GFP + or Htr3a -ko; GAD65 -GFP + mice was isolated, cells were dissociated and resuspended to obtain a cell suspension of approximately 100,000 cells per μl. 10% Fast Green (Sigma) was added to the cell suspension as a tracer. Using a nanoinjector (WPI, B203XVZ), approximately 1 μl of the cell suspension was injected into the CGE of embryos from pregnant E14.5 WT using beveled glass pipettes with a diameter of 70–100 μm. Embryos from host mouse were then collected at E19 for tissue processing and analysis. Only embryos with grafted cells observed in the CGE at E19 were used for the quantification.
Quantification of IN identity and distribution
Images were acquired using an epifluorescence microscope (Nikon, Eclipse 90i) equipped with a × 10 objective (Plan Apo × 10/1, Nikon) or a confocal (Nikon, A1R) microscope equipped with dry × 10 and × 20 objectives (CFI Plan Apo × 10/0.45 and CFI Plan Apo VC; × 20/0.75, Nikon) and oil-immersion × 40 and × 60 objectives (CFI Plan Fluor × 40/1.3 and CFI Plan Apo VC H × 60/1.4, Nikon). Quantification of the distribution of IN subtypes in the cortex was done by apposing a 10-bin grid at the level of the primary somatosensory cortex and bins corresponding to cortical layers were pooled.
Statistical analysis
No statistics were used to determine optimal group sample size; however, sample sizes were similar to those used in previous publications from our group and others. No samples were excluded from statistical analysis. Statistical analyses (GraphPad Prism software, version 6.0) were performed using paired or unpaired Student’s t -test, one-way or two-way analysis of variance with Tukey’s or Bonferroni’s multiple comparisons test.
Supplementary Material Supplementary Information Supplementary Figures 1-5, Supplementary Tables 1-2 and Supplementary References Supplementary Movie 1 Time-lapse sequence showing that the 5-HT 3A R agonist (SR57227 100 nM) stimulates the migration of E17.5 (+DIV1) GAD65 -GFP+ interneurons (INs). End image of the movie depicts examples of migratory tracks of GAD65 -GFP+ INs during the control period (in white) that are shorter in distance compared to the SR57227 condition (in red). Scale bar: 10 μm. Supplementary Movie 2 Time-lapse sequence showing that the 5-HT 3A R agonist (SR57227 100 nM) does not stimulate the migration of E14.5 (+DIV1) GAD65 -GFP+ INs. End image of the movie depicts examples of migratory tracks of GAD65 -GFP+ INs during the control period (in white) that are not increased in distance compared to the SR57227 condition (in red). Scale bar: 10 μm. Supplementary Movie 3 Time-lapse sequence showing that 5-HT 3A R agonist ( m CPBG 100μM) exposure (red arrows) induces a delayed increase in the growth cone (G.C.) size of a Htr3a -GFP+ interneuron migrating in the cortical plate. End image of the movie depicts the travel and examples of growth cone areas during baseline (white), 5-HT 3A R agonist exposure (red), wash 1 (green) and wash 2 (cyan). Scale bar: 5 μm. Supplementary Movie 4 Time-lapse sequence showing that 5-HT 3A R agonist ( m CPBG 100μM) exposure (red arrows) does not modify the growth cone (G.C.) size of a TOM+ labeled MGE-derived interneuron migrating in the cortical plate. End image of the movie depicts the travel and examples of growth cone areas during baseline (white), 5-HT 3A R agonist exposure (red), wash 1 (green) and wash 2 (cyan). Scale bar: 5 μm. Supplementary Movie 5 Time-lapse sequence showing E17.5 GAD65 -GFP+ INs migrating from the intermediate zone (IZ) (white arrowheads) into the cortical plate (CP) (red arrowheads). A higher proportion of GAD65 -GFP+ INs enter the cortical plate (CP) (red arrowheads) compared to Htr3a-ko; GAD65 -GFP+ INs (Supplementary movie 6). End image of the movie depicts examples of migratory tracks of GAD65 -GFP+ INs migrating into the CP (in red) or staying in the IZ (in white). Scale bar: 50 μm. Supplementary Movie 6 Time-lapse sequence showing Htr3a -ko; GAD65 -GFP+ INs preferentially remaining in the E17.5 intermediate zone (IZ) (white arrowheads). A higher proportion of Htr3a -ko; GAD65 -GFP+ INs remain in IZ (white arrowheads) compared to GAD65-GFP+ INs (Supplementary movie 5). End image of the movie depicts examples of migratory tracks of Htr3a -ko; GAD65-GFP+ INs remaining in the IZ (in white). Scale bar: 50 μm.
📊 Figures
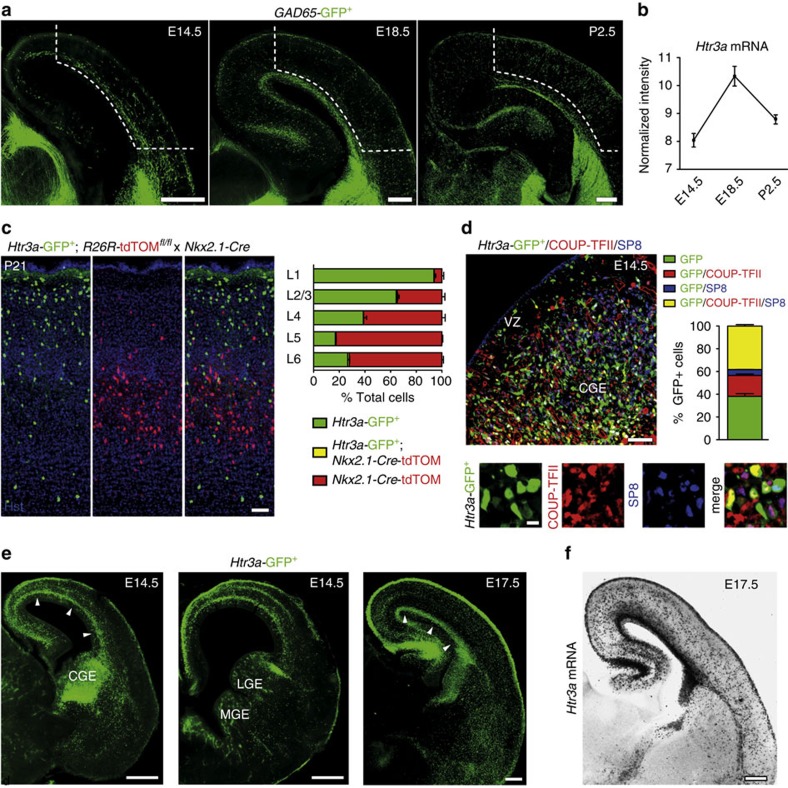
Figure 1
5-HT 3A R is specifically expressed and upregulated in caudal ganglionic eminence (CGE)-derived interneurons (INs) during the phase of cortical invasion.
( a ) Microdissection of cortical tissue (dotted lines) containing GAD65 -GFP + INs was performed at three developmental time points corresponding to the phase of tangential migration (E14.5), cortica...
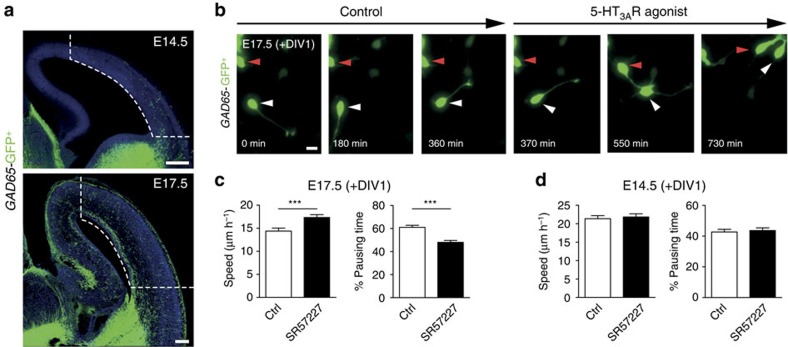
Figure 2
5-HT 3A R activation increases the migratory speed of CGE-derived interneurons (INs) during the phase of cortical plate invasion.
( a ) Microdissection of cortical tissue (dotted lines) containing GAD65 -GFP + INs was performed at E14.5 corresponding to the phase of tangential migration or at E17.5 during the phase of cortical i...
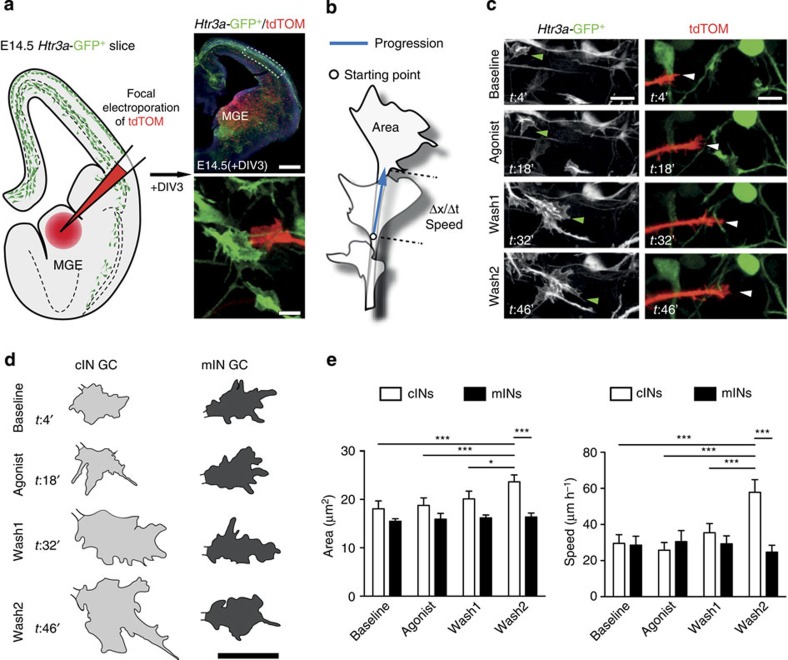
Figure 3
The 5-HT 3A R specifically regulates growth cone dynamics of interneurons (INs) derived from the CGE but not the MGE.
( a ) Schema illustrating that MGE-derived INs (mINs) were labelled using focal electroporation of a tdTOM-expressing plasmid in the MGE, whereas CGE-derived INs (cINs) were labelled using Htr3a- GFP ...
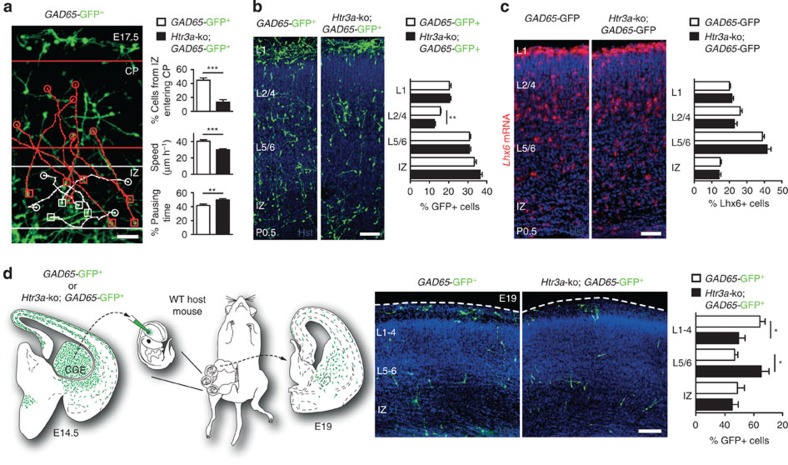
Figure 4
5-HT 3A R controls the migration and positioning of CGE-derived INs in the cortical plate (CP).
( a ) Examples of migratory paths in E17.5 acute cortical slices showing cINs remaining in the intermediate zone (IZ; white tracks) or invading the CP (red tracks). Squares indicate start positions an...
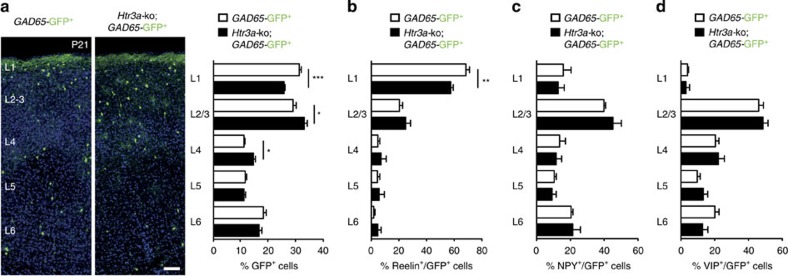
Figure 5
5-HT 3A R controls the laminar positioning of reelin-expressing CGE-derived INs in the cortex.
( a ) At P21, the positioning of Htr3a -ko; GAD65 -GFP + INs ( n =2,775 cells in six brains) was significantly altered in superficial layers compared with GAD65 -GFP + INs ( n =2,707 cells in six brai...
Figure images are served from the NIH/NLM PubMed Central Open Access Subset or Europe PMC; copyright remains with the publishers and authors.
💬 Discussion
0 commentsNo comments yet. Be the first to start a discussion!
Leave a Comment