Abstract
Abstract Estimating the orientation and 3D position of rotationally constrained emitters with localization microscopy typically requires polarization splitting or a large engineered Point Spread Function (PSF). Here we utilize a compact modified PSF for single molecule emitter imaging to estimate simultaneously the 3D position, dipole orientation, and degree of rotational constraint from a single 2D image. We use an affordable and commonly available phase plate, normally used for STED microscopy in the excitation light path, to alter the PSF in the emission light path. This resulting Vortex PSF does not require polarization splitting and has a compact PSF size, making it easy to implement and combine with localization microscopy techniques. In addition to a vectorial PSF fitting routine we calibrate for field-dependent aberrations which enables orientation and position estimation within 30% of the Cramér-Rao bound limit over a 66 μm field of view. We demonstrate this technique on reorienting single molecules adhered to the cover slip, λ -DNA with DNA intercalators using binding-activated localization microscopy, and we reveal periodicity on intertwined structures on supercoiled DNA.
🔬 Techniques
💻 Software
✨ Fluorophores
🧪 Sample Preparation
🏭 Microscope Brands
🧪 Reagent Suppliers
📷 Detectors
🔎 Objectives
💻 Software Details
💻 Code & Software
💾 Data Repositories
🏛️ Research Organizations (ROR)
Affiliated research institutions:
📋 Methods
Fitting model
We use standard Maximum Likelihood Estimation (MLE) using an image formation model that describes the expected photon count across the image as a function of the molecule position r 0 = ( x 0 , y 0 , z 0 ), signal photon count N of the entire PSF on the camera, background photons per pixel b , and dipole orientation Ω 0 = ( ϕ 0 , θ 0 ) with the degree of orientational constraint g 2 , giving a total of 8 parameters. The underlying PSF model is the fully vectorial PSF model, as in earlier work 15 , 25 , 53 – 55 , but now extended to estimate the dipole orientation along with the degree of orientational constraint. The image formation model is based on a weighted sum of the freely rotating dipole PSF and the fixed dipole PSF corresponding to the equilibrium dipole orientation 36 , plus a constant background: 1 documentclass[12pt]{minimal} usepackage{amsmath} usepackage{wasysym} usepackage{amsfonts} usepackage{amssymb} usepackage{amsbsy} usepackage{mathrsfs} usepackage{upgreek} setlength{oddsidemargin}{-69pt} begin{document}$$H({{{{{{{bf{r}}}}}}}},{{Omega }})=Nleft[frac{(1-{g}_{2})}{3}{H}_{{{{{{{{rm{free}}}}}}}}}({{{{{{{bf{r}}}}}}}})+frac{{g}_{2}}{3}{H}_{{{{{{{{rm{fixed}}}}}}}}}({{{{{{{bf{r}}}}}}}},{{Omega }})right]+frac{b}{{a}^{2}}$$end{document} H ( r , Ω ) = N ( 1 − g 2 ) 3 H free ( r ) + g 2 3 H fixed ( r , Ω ) + b a 2 where a is the pixel size and 0 ≤ g 2 ≤ 1 represents the degree of orientational constraint, with the limiting cases of a fully free dipole g 2 = 0 and a fully fixed dipole g 2 = 1. This seems simplistic compared to more complex rotational diffusion models 50 , 56 – 58 . The appropriateness of the model for rotational diffusion faster than the fluorescence lifetime, however, is demonstrated in ref. 36 . An asymmetric rotational diffusion model would require 2 additional fitting parameters, raising the total amount of parameters to 10 which we expect is not realistic to fit with
📊 Figures
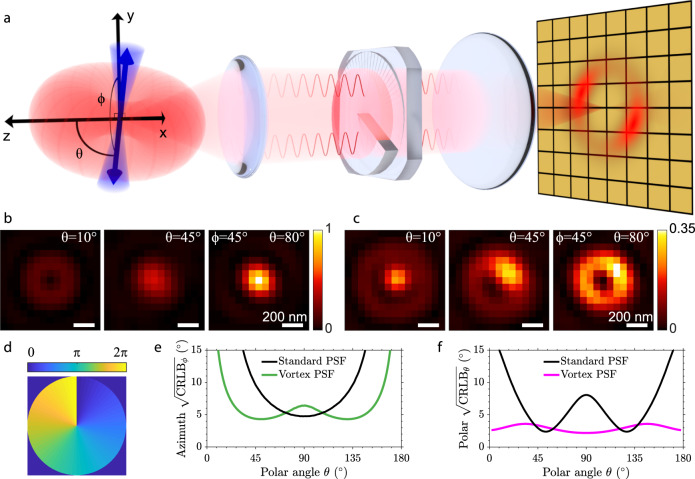
Fig. 1
Vortex PSF concept.
a A constrained dipole emitter is defined by the polar angle u03b8 and azimuthal angle u03d5 . The blue cone represents the degree of rotational constraint ( g 2 ) of the dipole emitter and the red to...
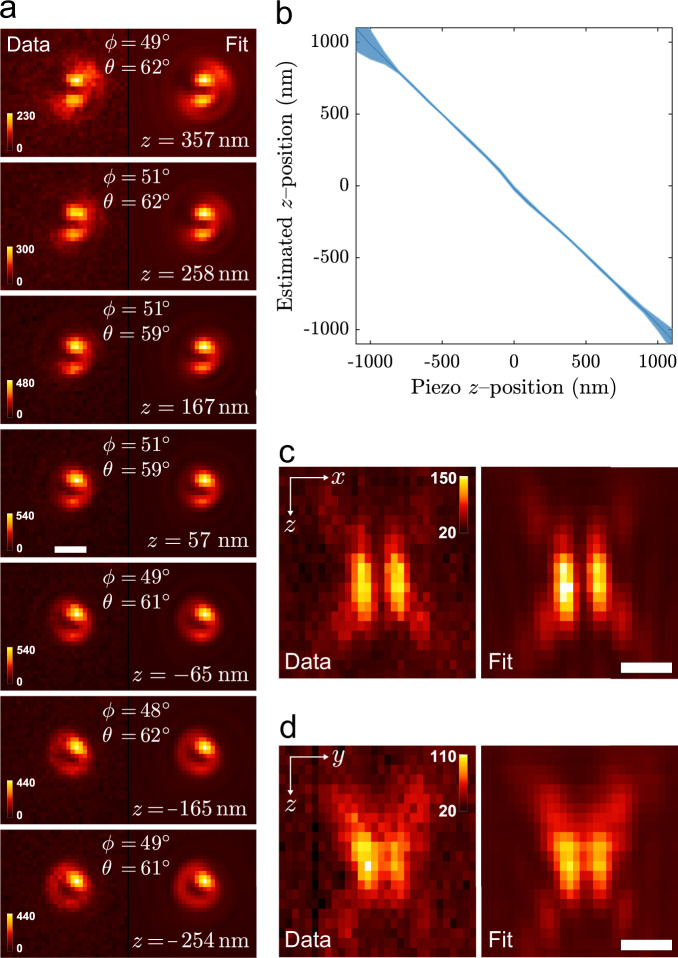
Fig. 2
Vortex PSF validation.
a Vortex PSF model fitted to an experimental z -stack of one single molecule with its estimated parameters listed in each frame. All sub-image pairs are contrast stretched with the same factor for bet...
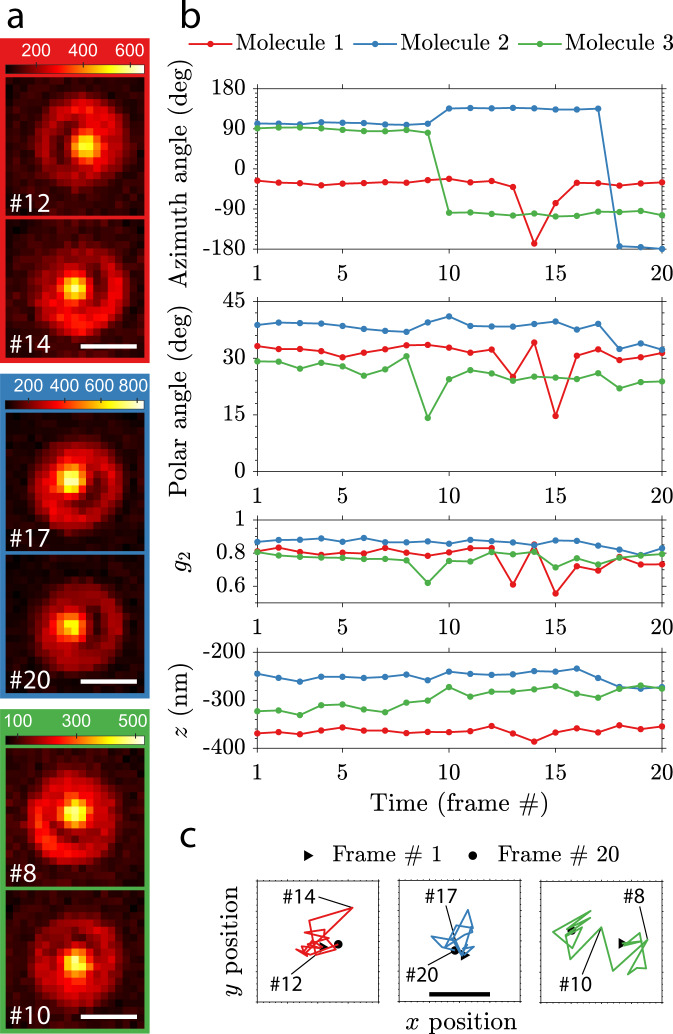
Fig. 3
Re-orientation dynamics of single molecules imaged with the Vortex PSF.
a Raw Vortex PSF images of 3 different molecules undergoing orientational transitions with frame numbers indicated in the bottom left (900u2009ms exposure, scale bar 500u2009nm and color bar units: ph...
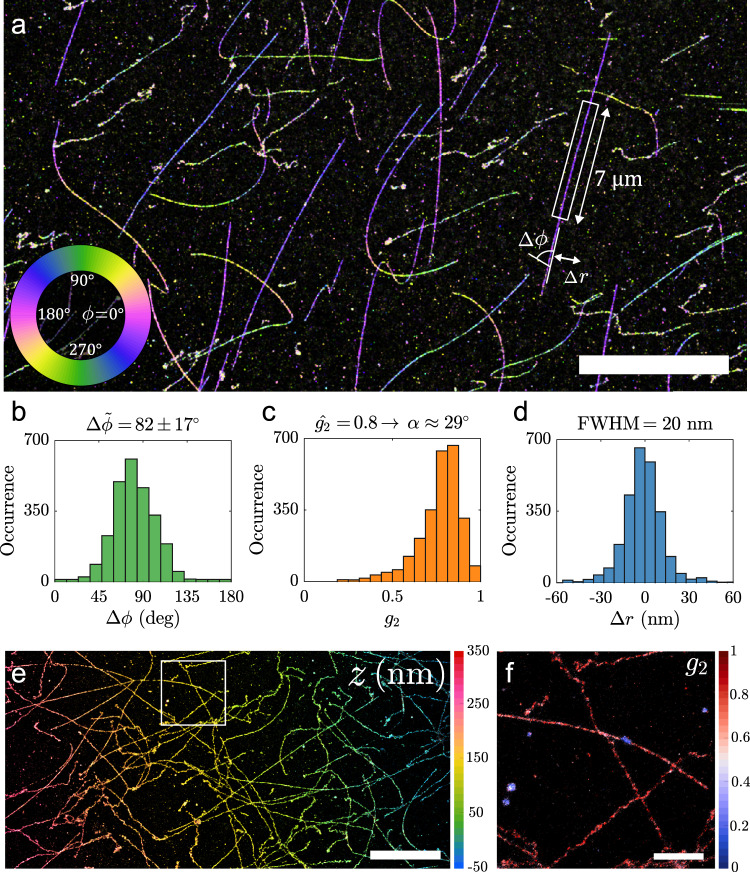
Fig. 4
Super-resolution image of u03bb -DNA.
a u03bb -DNA colorized as a function of the azimuthal angle. b Relative azimuthal angle histogram (u0394 u03d5 ) with respect to the DNA axis from the strand highlighted in a (u0394 u03d5 =u200982u00b...
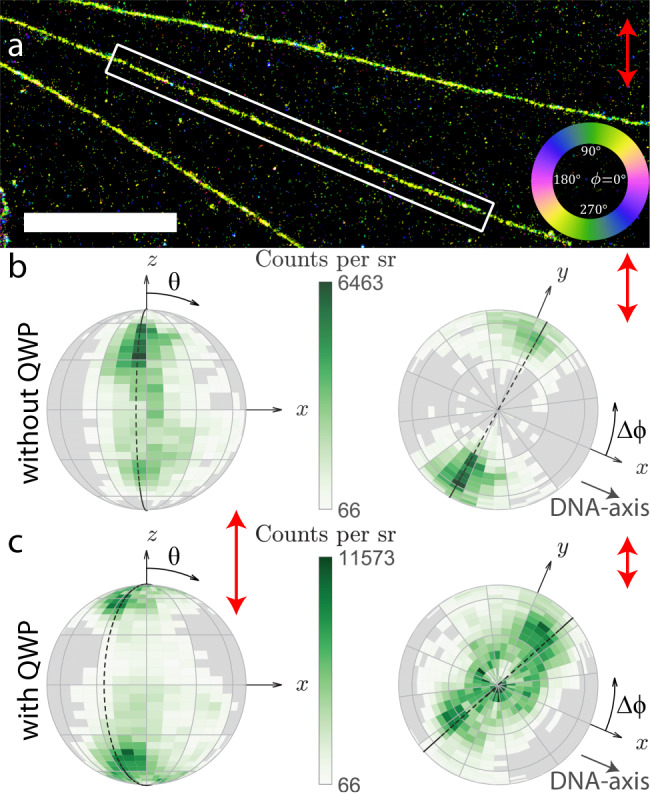
Fig. 5
Correlation between orientation parameters of u03bb -DNA under different excitation polarization.
a Super-resolution image of u03bb -DNA strands color coded with the same azimuthal map as Fig. 4a (scale bar is 3u2009u03bcm). b Relative dipole orientations with respect to the DNA axis aligned along...
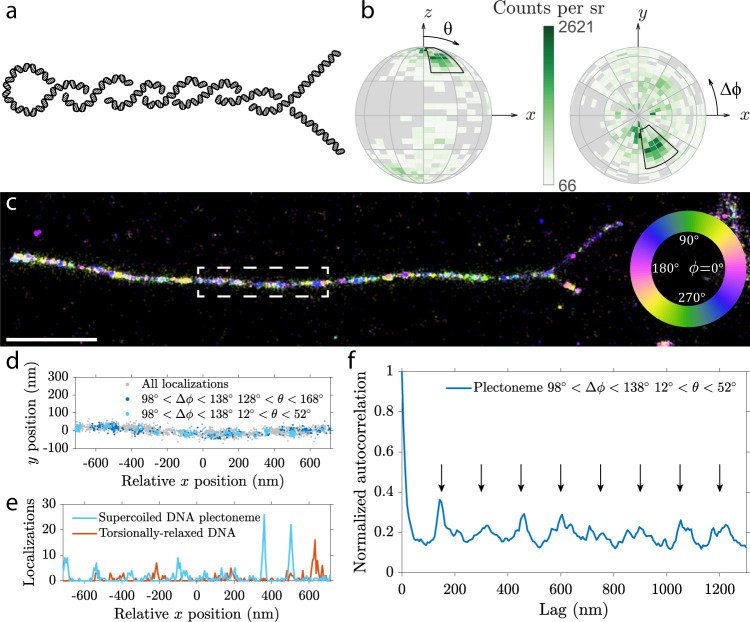
Fig. 6
Orientation and spatial correlation in a supercoiled DNA plectoneme.
a Diagram of a plectoneme formed by a single supercoiled DNA molecule where two strands are intertwined upon applied torsion. b Orientation distribution of a typical individual strand before overlap, ...
Figure images are served from the NIH/NLM PubMed Central Open Access Subset or Europe PMC; copyright remains with the publishers and authors.
💬 Discussion
0 commentsNo comments yet. Be the first to start a discussion!
Leave a Comment