Abstract
High-aspect-ratio nanostructures have emerged as versatile platforms for intracellular sensing and biomolecule delivery. Here, we present a microfabrication approach in which a combination of reactive ion etching protocols were used to produce high-aspect-ratio, nondegradable silicon nanoneedle arrays with tip diameters that could be finely tuned between 20 and 700 nm. We used these arrays to guide the long-term culture of human mesenchymal stem cells (hMSCs). Notably, we used changes in the nanoneedle tip diameter to control the morphology, nuclear size, and F-actin alignment of interfaced hMSCs and to regulate the expression of nuclear lamina genes, Yes-associated protein (YAP) target genes, and focal adhesion genes. These topography-driven changes were attributed to signaling by Rho-family GTPase pathways, differences in the effective stiffness of the nanoneedle arrays, and the degree of nuclear membrane impingement, with the latter clearly visualized using focused ion beam scanning electron microscopy (FIB-SEM). Our approach to design high-aspect-ratio nanostructures will be broadly applicable to design biomaterials and biomedical devices used for long-term cell stimulation and monitoring.
🔬 Techniques
🔭 Microscopes
✨ Fluorophores
🧪 Sample Preparation
🔬 Cell Lines
🏭 Microscope Brands
🧪 Reagent Suppliers
💻 Software Details
🏛️ Research Organizations (ROR)
Affiliated research institutions:
📋 Methods
Fabrication of Vertically Aligned Nonporous Nanoneedle Arrays Nanoneedle arrays were fabricated on a 4-in.-diameter p-type doped Si wafer with 0.01 Ω cm resistivity (University Wafers, USA). A hard mask layer of low-stress silicon nitride was deposited onto the wafer to a thickness of 1200 Å using low-pressure chemical vapor deposition (Scottish Microelectronic Centre, The University of Edinburgh, UK). Dot arrays of 0.6 μm diameter and 2 μm pitch spacing were transferred to the hard mask via photolithography using an NR9-250P photoresist, RD6 developer (Futurrex, USA), and a MA6 mask aligner (Suss Microtech, Germany). RIE was performed on the wafer using an Oxford NGP80 (Oxford Instrument, UK) using 50 sccm of CF 3 gas and 5 sccm of O 2 gas with a process pressure of 55 mTorr and power of 140 W for 150 s. The patterned wafer was mounted on a 6-in.-diameter carrier wafer using a Crystalbond 555 adhesive stick for DRIE using a deep reactive ion etcher (Surface Technology Systems, UK). Each DRIE cycle consisted of (i) 130 sccm of SF 6 gas and 6 sccm of O 2 gas with a process pressure of 15 mTorr and power of 800 W for an 8 s etch phase and (ii) 85 sccm of C 4 F 8 gas with a process pressure of 14 mTorr and power of 600 W for a deposition phase of 6.5 s. To produce structures of 5–6 μm height, between 30 and 35 cycles were conducted. The processed wafer was then released from the carrier wafer and diced into 8 × 8 mm squares for further use (DISCO Technologies, Japan) or sharpened into conical nanoneedle structures using a further RIE step. The parameters for this RIE step comprised 10 sccm of SF 6 gas with a process pressure of 100 mTorr and power of 300 W. The nanoneedle tip sharpness could be controlled by adjusting the RIE run time between 0 and 9 min, as indicated in Figure 1 b.
Show full methods section
Fabrication of Vertically Aligned Nonporous Nanoneedle Arrays Nanoneedle arrays were fabricated on a 4-in.-diameter p-type doped Si wafer with 0.01 Ω cm resistivity (University Wafers, USA). A hard mask layer of low-stress silicon nitride was deposited onto the wafer to a thickness of 1200 Å using low-pressure chemical vapor deposition (Scottish Microelectronic Centre, The University of Edinburgh, UK). Dot arrays of 0.6 μm diameter and 2 μm pitch spacing were transferred to the hard mask via photolithography using an NR9-250P photoresist, RD6 developer (Futurrex, USA), and a MA6 mask aligner (Suss Microtech, Germany). RIE was performed on the wafer using an Oxford NGP80 (Oxford Instrument, UK) using 50 sccm of CF 3 gas and 5 sccm of O 2 gas with a process pressure of 55 mTorr and power of 140 W for 150 s. The patterned wafer was mounted on a 6-in.-diameter carrier wafer using a Crystalbond 555 adhesive stick for DRIE using a deep reactive ion etcher (Surface Technology Systems, UK). Each DRIE cycle consisted of (i) 130 sccm of SF 6 gas and 6 sccm of O 2 gas with a process pressure of 15 mTorr and power of 800 W for an 8 s etch phase and (ii) 85 sccm of C 4 F 8 gas with a process pressure of 14 mTorr and power of 600 W for a deposition phase of 6.5 s. To produce structures of 5–6 μm height, between 30 and 35 cycles were conducted. The processed wafer was then released from the carrier wafer and diced into 8 × 8 mm squares for further use (DISCO Technologies, Japan) or sharpened into conical nanoneedle structures using a further RIE step. The parameters for this RIE step comprised 10 sccm of SF 6 gas with a process pressure of 100 mTorr and power of 300 W. The nanoneedle tip sharpness could be controlled by adjusting the RIE run time between 0 and 9 min, as indicated in Figure 1 b.
Cell Culture
Human mesenchymal stem cells (Lonza Ltd., Basel, Switzerland) were expanded in MesenPRO RS medium (Gibco, ThermoFisher Scientific, UK) and passaged using 0.05% v/v trypsin–EDTA at approximately 80% confluence. Prior to cell seeding, all nanoneedle and flat substrates were sterilized using two 10 min washes with 70% v/v ethanol (Sigma-Aldrich), rinsed with sterile phosphate-buffered saline (PBS), and then further sterilized under ultraviolet light for at least 10 min. hMSCs were seeded between passage 3 and 6 at a density of 10 000–15 000 viable cells/cm 2 onto substrates using minimum essential medium alpha modification (Gibco, ThermoFisher Scientific, UK) with 10% v/v MSC-qualified fetal bovine serum (Gibco, ThermoFisher Scientific, UK) and 1% v/v penicillin/streptomycin (Gibco, ThermoFisher Scientific, UK). LIVE/DEAD Assay hMSCs were seeded at a density of 20 000 viable cells per substrate and cultured for 35 d. LIVE/DEAD staining was then performed by immersing each substrate into calcein-AM/ethidium homodimer-1 (Invitrogen) solution (each at 1 × 10 –6 M in PBS) for 20 min, followed by gentle washing with PBS. Fluorescence microscopy (Invitrogen EVOS FL auto imaging system, Thermo Fisher Scientific) was used to capture images of viable and nonviable cells. Differentiation of hMSCs hMSCs were seeded at a density of 40 000 viable cells per substrate and cultured for 1 d in basal media, before switching to adipogenic or osteogenic media prepared with StemXVivo adipogenic supplement (100×, from R&D Systems) and StemXVivo Osteogenic Supplement (10×, from R&D Systems). The media was changed twice weekly. After 21 d of differentiation (three replicates), each of the substrates was fixed with 4% w/v methanol-free formaldehyde (Pierce 16% formaldehyde (w/v), methanol-free, ThermoFisher Scientific, UK) for 30 min at room temperature, and then Oil Red O or Alizarin Red S staining followed. For Oil Red O staining, 5 mg/mL of Oil Red O stock solution was prepared in 100 % isopropanol as solvent, and then diluted once more to make Oil Red O solution in deionized water at a 3:2 (stock to water ratio). Each sample was stained with 500 μL of Oil Red O solution at room temperature for 30 min. After the staining, samples were imaged with fluorescence microscopy. For quantification, the stain was extracted in 500 μL of isopropanol and transferred into a 96-well plate (100 μL per well) to measure the absorbance at 492 nm using a plate reader, with 100% isopropanol used for the background subtraction. For Alizarin Red S staining, each sample was stained with 2% w/v Alizarin Red S (Sigma) for 30 min. Samples were viewed using a digital camera, and then dye extraction was followed for quantification. The stain was extracted in 200 μL of 10% v/v acetic acid followed by adding 75 μL of 10% v/v ammonium hydroxide to neutralize the acid. The solution was aliquoted and transferred into a 96-well plate (100 μL per well) to measure the absorbance at 405 nm using a plate reader.
Immunocytochemistry and Imaging
The hMSCs cultured on the different substrates were fixed for 15 min at room temperature using 4% w/v methanol-free formaldehyde (Pierce 16% formaldehyde (w/v), ThermoFisher Scientific, UK) and then washed twice with PBS. The fixed hMSCs were permeabilized for 10 min with 0.25% v/v Triton X-100 (Sigma-Aldrich), blocked for 1 h with 5% v/v donkey serum (heat-inactivated, Gibco, ThermoFisher Scientific, UK), then incubated overnight at 4 °C with primary antibodies diluted in 0.1% w/v bovine serum albumin (BSA, Sigma-Aldrich) in PBS. The blocked hMSCs were washed three times in PBS for 5 min, then incubated for 1 h at room temperature with secondary antibody (1:500 in 0.1% w/v BSA/PBS). The hMSCs were washed three more times with PBS for 5 min, and where applicable, samples were incubated with AlexaFluor-conjugated Phalloidin (1:100 in 0.1% w/v BSA/PBS) for 1 h. All samples were counterstained with DAPI (1:1000 in PBS) for 5 min. Full information on antibodies is listed in Table S7 . Samples were mounted on glass-bottomed chamber slides using Fluoromount-GTM (Invitrogen, ThermoFisher Scientific, UK) and imaged using a Zeiss Axio Observer wide-field microscope (Zeiss, Germany).
Transfection of siRNA
Transfection was conducted using cationic liposome reagent, Lipofectamine RNAiMAX (Invitrogen, ThermoFisher Scientific, UK). RhoA and Rac siRNA were purchased from Santa Cruz Biotechnology, USA. For transfection, hMSCs were expanded in MesenPRO RS medium (Gibco, ThermoFisher Scientific, UK) in a six-well plate. When the cells were around 70% confluent, transfection was performed by adding RhoA siRNA (75 pmol)–Lipofectamine RNAiMAX (9 μL) or Rac siRNA (75 pmol)–Lipofectamine RNAiMAX (9 μL) complex formed in Opti-MEM medium (Gibco, ThermoFisher Scientific, UK) directly to the media. Lipofectamine RNAiMAX without siRNA was used as a control. Cells were incubated for 3 d, then the transfection was confirmed by checking gene downregulation via qRT-PCR.
Inhibitor Treatment
Y27632, blebbistatin, and NSC23766 (Sigma-Aldrich) were each diluted in dimethyl sulfoxide (DMSO, Sigma-Aldrich), and each mixture was added at a 1:1000 dilution to the hMSC suspension immediately prior to seeding on the substrates. A final concentration of 5–20 μM was used, and as a control, DMSO was added at the same ratio without any inhibitors. Cells were cultured for 24 h, prior to analysis. Quantifying the Orientation of hMSCs Population orientation of hMSCs under different conditions (substrates, inhibitors) was analyzed using ImageJ and the OrientationJ plug-in. 38 , 39 Images of actin-stained hMSCs were converted to 8-bit and the minimum brightness was raised to remove any background signal intensity. OrientationJ was run with a factor of 5 (corresponding to 6.55 μm when after pixel conversion) to produce a weighted angle distribution between −90° and 90°.
Quantitative Real-Time Polymerase Chain
Reaction (qRT-PCR) hMSCs cultured on nanoneedles and flat substrates were incubated with Trizol (Life Technologies) for 5 min, mixed with chloroform (5:1 Trizol/chloroform), and separated by centrifugation (12000 g , 15 min, 4 °C). RNA contained within the clear aqueous phase was isolated and collected using a Direct-zol RNA MiniPrep kit (ZYMO Research, USA), according to the manufacturer’s instructions. The RNA was used to synthesize cDNA using high-capacity cDNA reverse transcription kits (Applied Biosystems, Life Technologies), assuming a 1:1 conversion from RNA to cDNA. qRT-PCR was performed with a PowerUP SYBR Green Master Mix (Applied Biosystems, Life Technologies) and QuantStudio6/StepOnePlus (Applied Biosystems) with 0.5 ng of cDNA and 500 nM of the forward and reverse primers per reaction. After each run, a melt curve was performed to ensure that a single amplicon was generated for each target gene. Cycles-to-threshold (Ct) values were used to generate fold change expression values. The expression of each gene of interest was normalized to the expression of housekeeping genes, PPIA , RPL13a , or HPRT , to generate ΔCt values. Expression of 2 –ΔΔCt relative to the flat control was reported for at least three experimental replicates. Custom-designed primers were purchased from Invitrogen and tested for specificity prior to use, with sequences listed in Table S8 . Scanning Electron Microscopy and Focused Ion Beam Scanning Electron Microscopy hMSCs on nanoneedles or flat substrates were washed in PBS, fixed for 15 min with 4% w/v methanol-free formaldehyde (Pierce 16% formaldehyde (w/v), methanol-free, ThermoFisher Scientific, UK), and washed a further three times in PBS. Next, the samples were washed twice for 5 min in 0.1 M sodium cacodylate buffer (Electron Microscopy Sciences, PA, USA, 0.2 M stock diluted in Milli-Q water) and further fixed for 1 h in 2.5% v/v glutaraldehyde solution (Electron Microscopy Sciences) in 0.1 M sodium cacodylate buffer. hMSCs were washed twice for 5 min in pure deionized water, stained for 1 h with 1% v/v osmium tetroxide in 0.1 M sodium cacodylate buffer, and then washed with pure deionized water twice for 5 min. For SEM, the samples were dehydrated in a series of ethanol dilutions (20, 30, 50, 70, 80, 90% v/v ethanol in pure water) twice for 5 min, treated with 100% ethanol four times for 5 min, incubated for 5 min with hexamethyldisilazane (HMDS, 97%, Sigma-Aldrich), and then air-dried. Samples were mounted and sputtered with a 10 nm layer of chromium (Q150, Quorum) and imaged using a LEO Gemini 1525 FEGSEM (Zeiss, Germany) with an accelerating voltage of 5 keV. For FIB-SEM, the protocol varied after osmium tetroxide staining: the samples were stained further after washing twice for 5 min in pure deionized water for 1 h with 1% (w/v) tannic acid (Sigma-Aldrich) in pure deionized water, freshly made and filtered through a 0.2 μm syringe filter (Milli-Pore), washed twice with pure deionized water, stained for 2.5–3 h with 1% (v/v) uranyl acetate in deionized water, filtered through a 0.2 μm syringe filter, and then dehydrated as described above for the SEM samples. Samples were then infiltrated with serially diluted resin (1:3, 1:2, 1:1, 2:1 resin:ethanol), 3 h each and then kept overnight in the 2:1. All resins were prepared according to the manufacturer’s instructions (epoxy embedding medium kit, Sigma). The 2:1 resin was replaced by pure resin twice for 3 h each, after which the excess resin was removed by washing with ethanol for minimal resin embedding and cured for 72 h at 60 °C. Samples were mounted and sputtered with a 20 nm layer of chromium. FIB-SEM imaging was performed on an Auriga Crossbeam FEG-SEM (Zeiss, Germany) at 1.6 keV electron beam imaging current and milled using a 30 keV gallium ion beam at 4 nA for coarse milling and 1 nA for fine milling. Images were acquired using a backscattered electron detector, and for 3D reconstruction (serial milling) the interval was set to 90 nm. Images were analyzed using ImageJ, and 3D reconstructions were made using Amira 5.3.2. (FEI) following manual image alignment and segmentation.
Statistical Analysis
Statistics on biochemical data were performed with SPSS software (IBM Corporation, USA) and OriginPro (OriginLab Corporation, USA). All raw data were checked for normality (Kolmogorov–Smirnov’s test and Shapiro–Wilk’s test) and homogeneity of variance (Levene’s test). Normal and homogeneous data were analyzed with one-way ANOVAs. If significant effects were detected, Tukey’s method was used to identify significantly different groups. In normal but heterogeneous data, Welch’s ANOVA was chosen with a Games–Howell post hoc test for significantly different groups. Significance was set at p < 0.05 for all statistical tests. For the qRT-PCR analysis, three to four experimental replicates were performed, with at least two biological replicates within each experiment. For each experimental replicate, the expression of the gene of interest (GOI) was normalized to the geometric mean of at least two housekeeping genes (HKGs), which generated the ΔCt value. For each cell type, the average was calculated for the normalized GOI expression on flat samples, and expression of all groups was then normalized to these values. This resulted in an expression value equal to 1 for flat samples but carried a nonzero standard deviation that reflected the intraexperimental heterogeneity of biological replicates. In order to propagate this error, the relative standard deviation (RSD) was calculated for all groups of interest, where where N is the number of experimental replicates ( N = 3) and SD_expRep represents the standard deviation of the normalized expression for each group within each experimental replicate. For all box plots, the 25th and 75th quartiles are represented, the line is the median, and the whiskers extend to the minimum and maximum data points.
Supplementary Material nn9b08689_si_001.pdf nn9b08689_si_002.mp4 nn9b08689_si_003.mp4
📊 Figures
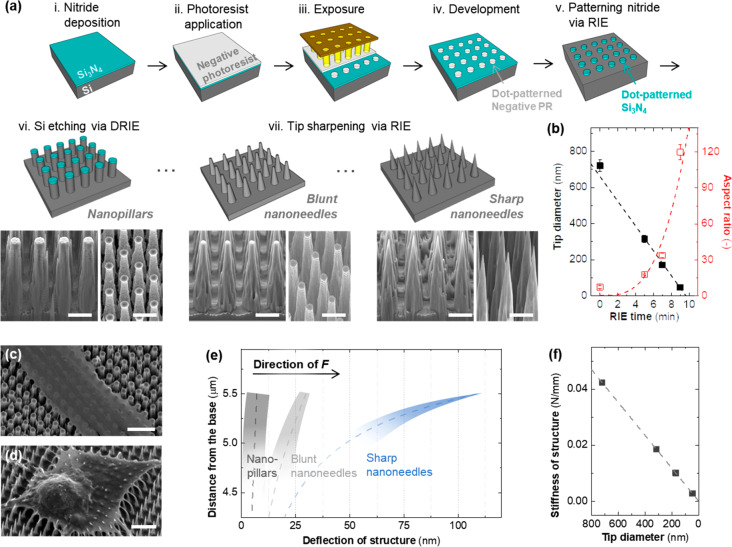
Figure 1
(a, b) Fabrication ofnvertically aligned nonporous nanoneedle arraysnwith systematic control over tip sharpness: (a) Schematic of the photolithographynand dry silicon etching processes: (i) silicon ni...
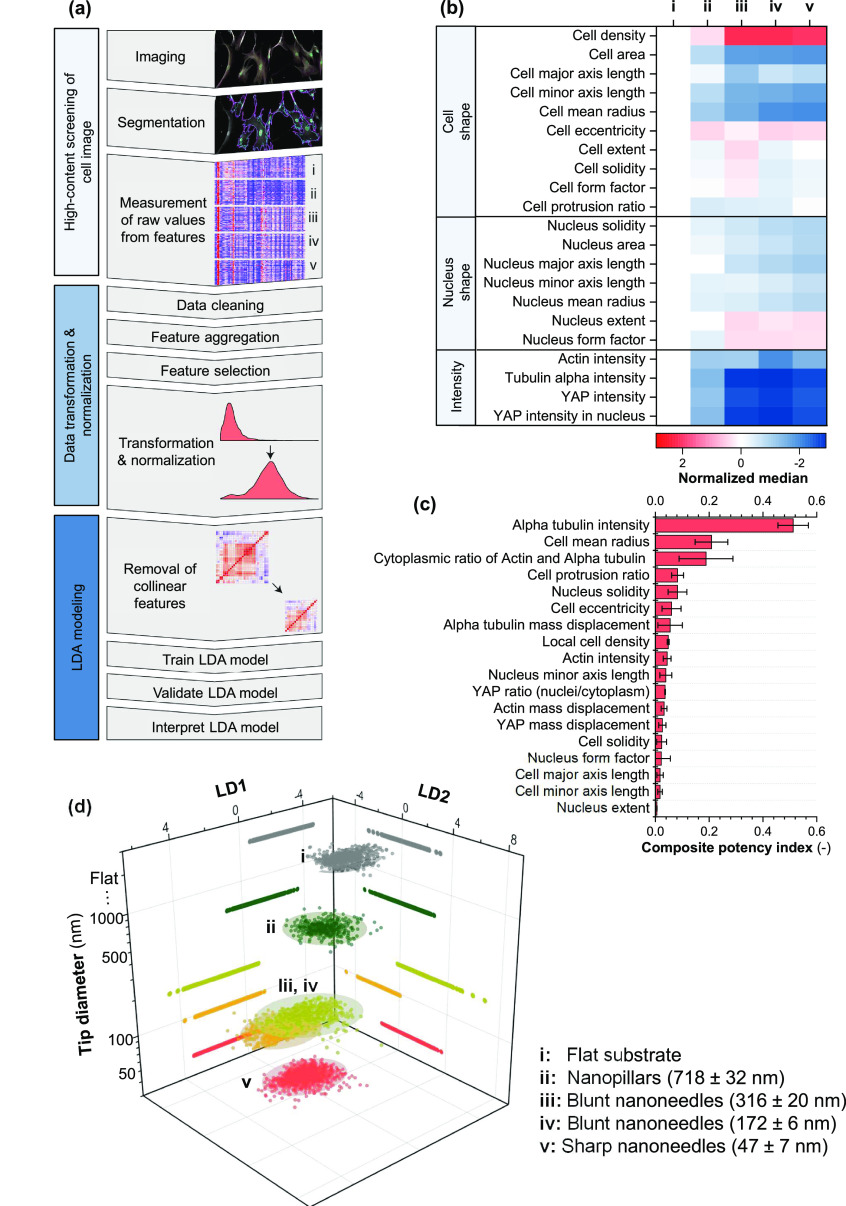
Figure 2
High-contentnscreening of hMSCs cultured on flat controls (i),nnanopillars (ii = 718 u00b1 32 nm), blunt nanoneedles (iii = 316nu00b1 20 nm, iv = 172 u00b1 6 nm), and sharp nanoneedles (v = 47nu00b1 7...
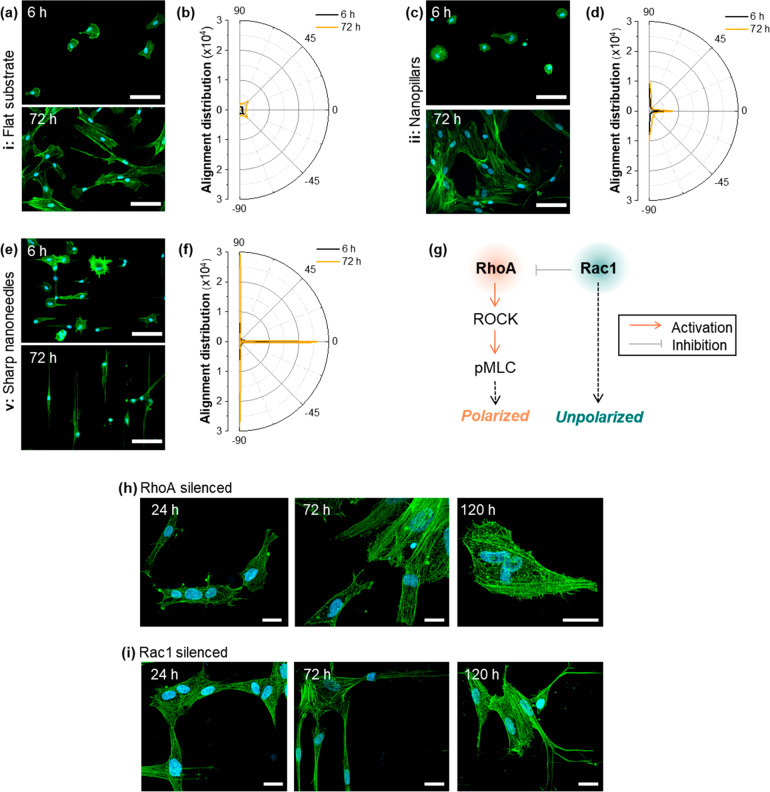
Figure 3
(au2013f) Cytoskeletal alignment of hMSCs on nanostructurednsurfaces: (a, c, e) Representative immunofluorescence images of hMSCsnafter 6 and 72 h of culture on flat controls, nanopillars ( D tip = 71...
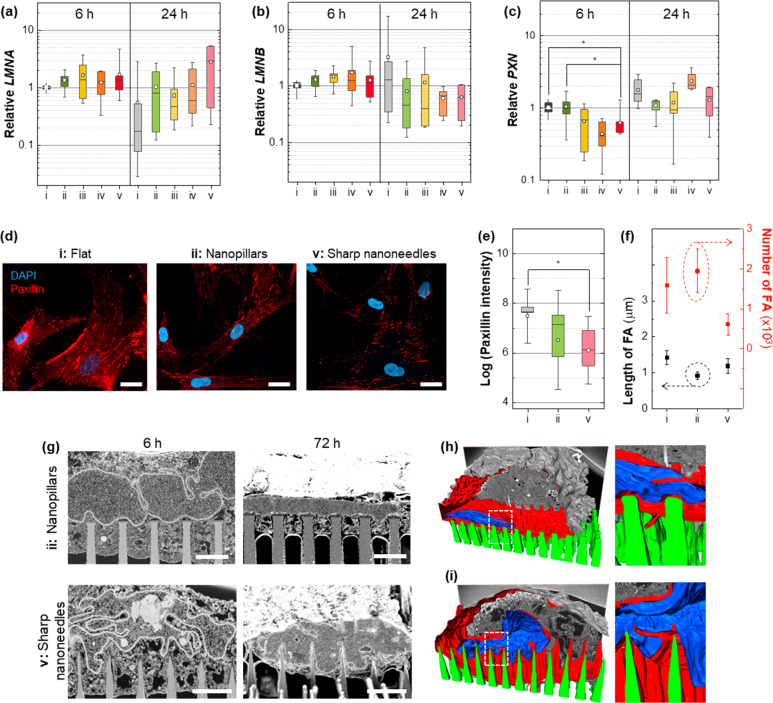
Figure 4
Relative expression ofnnuclear lamina genes: (a, b) Relative genenexpression of LMNA and LMNB aftern6 and 24 h. (cu2013f) Relative expression and distribution of focalnadhesion proteins: (c) Relative ...
Figure images are served from the NIH/NLM PubMed Central Open Access Subset or Europe PMC; copyright remains with the publishers and authors.
💬 Discussion
0 commentsNo comments yet. Be the first to start a discussion!
Leave a Comment