Abstract
AbstractThe plasma membrane (PM) of Saccharomyces cerevisiae contains membrane compartments, MCC/eisosomes and MCPs, named after the protein residents Can1 and Pma1, respectively. Using high-resolution fluorescence microscopy techniques we show that Can1 and the homologous transporter Lyp1 are able to diffuse into the MCC/eisosomes, where a limited number of proteins are conditionally trapped at the (outer) edge of the compartment. Upon addition of substrate, the immobilized proteins diffuse away from the MCC/eisosomes, presumably after taking a different conformation in the substrate-bound state. Our data indicate that the mobile fraction of all integral plasma membrane proteins tested shows extremely slow Brownian diffusion through most of the PM. We also show that proteins with large cytoplasmic domains, such as Pma1 and synthetic chimera of Can1 and Lyp1, are excluded from the MCC/eisosomes. We hypothesize that the distinct localization patterns found for these integral membrane proteins in S. cerevisiae arises from a combination of slow lateral diffusion, steric exclusion, and conditional trapping in membrane compartments.
🔬 Techniques
🔭 Microscopes
🧬 Organisms
✨ Fluorophores
🧪 Sample Preparation
🏭 Microscope Brands
🧪 Reagent Suppliers
🔴 Lasers
📷 Detectors
🎨 Filters
💻 Software Details
🏛️ Research Organizations (ROR)
Affiliated research institutions:
📋 Methods
Growth conditions, plasmids, and strains Yeast cells were grown for at least 72 h at 30 °C at 200 rpm. We used synthetic dropout media containing 2% [w/v] of carbon source: D-raffinose in strains containing constructs under the gal promoter and glucose in the other cases. For FRAP experiments, cells grown in glucose medium were transferred to medium containing both D-raffinose (2% [w/v]) and glucose (0.1% [w/v]). The cultures were diluted in the morning and afternoon to sustain growth in the exponential phase. Strains with fluorescent constructs of Can1, or Lyp1, were grown without arginine and lysine in the media, instead a lysine di-peptide was added to allow growth. All strains are based on S. cerevisiae strain BY4742 (Supplementary Table 1 ). Genomic DNA isolation of S. cerevisiae BY4742 was carried out according to Sherman et al. 38 . For the amplification of DNA, using uracil containing primers, the polymerase chain reactions (PCRs) were performed with PfuX7 39 . Amplified fragments were assembled into full plasmids (Supplementary Table 2 ) by treatment with DNA glycosidase and DNA glycosylase-lyase endo VIII, commercially available as USER, following the manufacturer’s instruction (New England Biolabs, Ipswich, MA, USA). Ligation products were transformed into chemically competent E. coli MC1061 cells 40 . All constructs assembled from PCR fragments were verified by DNA sequencing. Genomic tagging and deletion of genes were done with standard PCR-based homologous recombination, using the primers listed in (Supplementary Table 3 ). Transformation of plasmids and linear constructs into S. cerevisiae was performed as described by Drew et al. 41 The plasmids pFB001, pFB002, pFB003, pFB004, pfB005, and pFB006 were constructed by four-way ligations of PCR fragments, in which the backbone of the pRS426GAL1-GFP vector was amplified with primer pairs Pr1/Pr2 and Pr3/Pr4, two fragments that exclude the GFP coding region. The fragment coding for the YPet gene was amplified from a synthetically generated coding sequence ordered from (GeneArt, Regensburg, Germany), using primer pair Pr5/Pr6. The insert was amplified from S. cerevisiae BY4742 chromosomal DNA with primer pair: Pr7/Pr8. Similarly plasmids were constructed for can1 , nha1, and vba1 using primer pairs Pr9/Pr10, Pr11/Pr12, and Pr13/Pr14, respectively. The pLS006 plasmid was created by amplification of pUG73 vector with primer pair Pr62/63, and the gap1C fragment was amplified with Pr64/65 using pDP001-GFP-Gap1C as template. For the pLS003 and pLS004 plasmids, the backbone and the ura3 marker were both separately amplified from the pFB001 plasmid using primer pairs Pr1/Pr3 and Pr2/Pr4, respectively. The inserts were amplified from the respective strain using primer pairs Pr51/53 and Pr52/53, respectively. All these plasmids were assembled by the uracil-excision method subsequently pieces were combined treated with USER enzyme, transformed in E. coli , and isolated. The pFB007, pFB008, and pFB009 plasmids are based on three PCR fragments, using the uracil excision-based cloning method. The backbone and the ura3 marker were both separately amplified from the pug72 plasmid using primer pairs Pr19/Pr22 and Pr20/Pr21, respectively. mEos3.1 , YPet , or mKate2 was amplified using primer pair Pr23/Pr24, Pr25/Pr26, or Pr27/28 from a synthetically generated coding sequence, ordered from (GeneArt, Regensburg, Germany). The fragments were treated with USER and transformed into E. coli MC1061 as described previously. For the construction of C-terminal fusion proteins on the chromosome, we made use of the ura3 selection marker and the ability for its counter selection on 5 fluoro-orotic acid (5FOA) as described by Alani et al. 42 . For genomic tagging of lyp1 , can1 , sur7 and pil1 with either mEos3.1 or YPet , or mKate2 , we amplified mEos3.1 , YPet or mKate2 -ura3 cassette from pFB007, pFB008, and pFB009, respectively. For the tagging of can1, lyp1, nha1, pil1 , and sur7 with/without linker or deletion of the sequence coding for the last 10 amino acids of Can1 and Lyp1, we used primer pairs Pr29/30, Pr34/35, Pr38/39–40, Pr41/Pr42, Pr43/Pr44, Pr29/33, and Pr34/37, respectively. The amplified cassettes were transformed into S. cerevisiae BY4742 and homologous recombination of the cassette into the genome was selected for by growth on a uracil-depleted medium. The Ura3 marker was removed from the chromosome by recombination of its homologous flanking regions, for which we selected for growth on a medium containing 5FOA. For the labeling of a second gene product in the same strain with a different fluorophore the above steps were repeated, except for the counter selection on 5FOA. pLS001 is a derivative of pRS316 with Pma1-YPet integrated. Pma1 with 848 bases upstream and YPet were PCR amplified using primer pair Pr45/46 and Pr47/Pr48, respectively. The pRS316 vector was digested with a blunt end cut using Sma I via manufacturers protocol (New England Biolabs). The complete vector was created via a three way homologous recombination in S. cerevisiae . pLS002 is a derivative of pLS001 in which Pma1 was truncated by PCR amplification of pLS001 and using primer pair Pr49/Pr50 a circular vector was formed by homologous recombination of both ends. To introduce an additional protein domain at the C-terminal end of YPet, we used the primer pair Pr58/59 for gapC (C terminus of Gap1) and pR60/61 for malE . The amplified cassettes were transformed into S. cerevisiae BY4742, and homologous recombination of the cassette into the genome was selected by growth on leucine- (in case of gap1C ), or histidine- (in case of MBPs) depleted medium. The pLS005 vector was constructed by amplifying the backbone of pLS003 with the primer pair Pr54/55. The fragment coding mCardinal was amplified with primer pair Pr56/57, using a synthetic codon-optimized mCardinal gene as template (GeneArt, Regensburg, Germany). The pLS007 was constructed by amplifying the backbone of pLS005 with two pairs of primers: Pr66/67 and Pr68/69. The DNA fragment coding for Nha1 was amplified from the genome of S. cerevisiae using primer pair Pr70/71 a circular vector was formed by homologous recombination of overlapping ends in S.cerevisiae . Similarly plasmid pLS008 was constructed by amplifying the backbone of pLS005 with two pairs of primers: Pr66/67 and Pr68/69. The DNA fragment coding for Pma1 was amplified from the genome of S. cerevisiae using primer pair Pr72/73. Microscopy equipment For super-resolution microscopy measurements, a fully automated home-built microscope was used 43 . We constructed a wide-field single-molecule fluorescence microscope by coupling high-power laser excitation into a commercially available inverted fluorescence microscope body (IX-81, Olympus), equipped with a 1.49 NA ×100 objective and a 512 × 512 pixel EM-CCD camera (C9100-13, Hamamatsu). Excitation light was provided by continuous wave optically pumped semi-diode lasers (Sapphire LP, Coherent) of wavelength 514 nm (150 mW max. output) and 568 nm (200 mW max. output). For imaging mKate2 and mEos3.1 fusions, we used 568 nm excitation light and collected light emitted between 610 and 680 nm (ET 645/75 m filter, Chroma). For imaging YPet fusions, we used 514 nm laser excitation and collected light between 525 and 555 nm (ET540/30 m filter, Chroma). For FRAP measurements, a commercial laser-scanning confocal microscope, LSM 710 (Carl Zeiss MicroImaging, Jena, Germany) was used. The microscope was equipped with a C-Apochromat ×40/1.2 NA objective and a blue argon ion laser (488 nm). For the SPT experiments, a home-built Olympus IX-81-ZDC inverted TIRF microscope was used. The microscope was equipped with a UAPON 1.49 NA ×100 TIRF objective (Olympus, Inc), a manual open-frame microscope stage (M-545) (Physik instruments, Inc), a 512 × 512 Electron Multiplying Charge-Coupled Device (EMCCD) C9100-13 camera (pixel size 80 nm, EM gain 1200×) (Hamamatsu, Inc) and Xcellence ® software (Olympus, Inc). Fluorescent proteins were excited with continuous wave (CW) lasers (Coherent Sapphire, Inc). During the microscopy experiments, Z-drift was compensated by z-axis control, which is an option built into the IX81. Emission was filtered using bandpass filters obtained from AHF ® (AHF, Inc). For imaging Ypet, the bandpass filter HC535/22 (Semrock, Inc) was used, whereas for imaging mCardinal the bandpass filter HC630/92 (Semrock, Inc) was used.
Show full methods section
Growth conditions, plasmids, and strains Yeast cells were grown for at least 72 h at 30 °C at 200 rpm. We used synthetic dropout media containing 2% [w/v] of carbon source: D-raffinose in strains containing constructs under the gal promoter and glucose in the other cases. For FRAP experiments, cells grown in glucose medium were transferred to medium containing both D-raffinose (2% [w/v]) and glucose (0.1% [w/v]). The cultures were diluted in the morning and afternoon to sustain growth in the exponential phase. Strains with fluorescent constructs of Can1, or Lyp1, were grown without arginine and lysine in the media, instead a lysine di-peptide was added to allow growth. All strains are based on S. cerevisiae strain BY4742 (Supplementary Table 1 ). Genomic DNA isolation of S. cerevisiae BY4742 was carried out according to Sherman et al. 38 . For the amplification of DNA, using uracil containing primers, the polymerase chain reactions (PCRs) were performed with PfuX7 39 . Amplified fragments were assembled into full plasmids (Supplementary Table 2 ) by treatment with DNA glycosidase and DNA glycosylase-lyase endo VIII, commercially available as USER, following the manufacturer’s instruction (New England Biolabs, Ipswich, MA, USA). Ligation products were transformed into chemically competent E. coli MC1061 cells 40 . All constructs assembled from PCR fragments were verified by DNA sequencing. Genomic tagging and deletion of genes were done with standard PCR-based homologous recombination, using the primers listed in (Supplementary Table 3 ). Transformation of plasmids and linear constructs into S. cerevisiae was performed as described by Drew et al. 41 The plasmids pFB001, pFB002, pFB003, pFB004, pfB005, and pFB006 were constructed by four-way ligations of PCR fragments, in which the backbone of the pRS426GAL1-GFP vector was amplified with primer pairs Pr1/Pr2 and Pr3/Pr4, two fragments that exclude the GFP coding region. The fragment coding for the YPet gene was amplified from a synthetically generated coding sequence ordered from (GeneArt, Regensburg, Germany), using primer pair Pr5/Pr6. The insert was amplified from S. cerevisiae BY4742 chromosomal DNA with primer pair: Pr7/Pr8. Similarly plasmids were constructed for can1 , nha1, and vba1 using primer pairs Pr9/Pr10, Pr11/Pr12, and Pr13/Pr14, respectively. The pLS006 plasmid was created by amplification of pUG73 vector with primer pair Pr62/63, and the gap1C fragment was amplified with Pr64/65 using pDP001-GFP-Gap1C as template. For the pLS003 and pLS004 plasmids, the backbone and the ura3 marker were both separately amplified from the pFB001 plasmid using primer pairs Pr1/Pr3 and Pr2/Pr4, respectively. The inserts were amplified from the respective strain using primer pairs Pr51/53 and Pr52/53, respectively. All these plasmids were assembled by the uracil-excision method subsequently pieces were combined treated with USER enzyme, transformed in E. coli , and isolated. The pFB007, pFB008, and pFB009 plasmids are based on three PCR fragments, using the uracil excision-based cloning method. The backbone and the ura3 marker were both separately amplified from the pug72 plasmid using primer pairs Pr19/Pr22 and Pr20/Pr21, respectively. mEos3.1 , YPet , or mKate2 was amplified using primer pair Pr23/Pr24, Pr25/Pr26, or Pr27/28 from a synthetically generated coding sequence, ordered from (GeneArt, Regensburg, Germany). The fragments were treated with USER and transformed into E. coli MC1061 as described previously. For the construction of C-terminal fusion proteins on the chromosome, we made use of the ura3 selection marker and the ability for its counter selection on 5 fluoro-orotic acid (5FOA) as described by Alani et al. 42 . For genomic tagging of lyp1 , can1 , sur7 and pil1 with either mEos3.1 or YPet , or mKate2 , we amplified mEos3.1 , YPet or mKate2 -ura3 cassette from pFB007, pFB008, and pFB009, respectively. For the tagging of can1, lyp1, nha1, pil1 , and sur7 with/without linker or deletion of the sequence coding for the last 10 amino acids of Can1 and Lyp1, we used primer pairs Pr29/30, Pr34/35, Pr38/39–40, Pr41/Pr42, Pr43/Pr44, Pr29/33, and Pr34/37, respectively. The amplified cassettes were transformed into S. cerevisiae BY4742 and homologous recombination of the cassette into the genome was selected for by growth on a uracil-depleted medium. The Ura3 marker was removed from the chromosome by recombination of its homologous flanking regions, for which we selected for growth on a medium containing 5FOA. For the labeling of a second gene product in the same strain with a different fluorophore the above steps were repeated, except for the counter selection on 5FOA. pLS001 is a derivative of pRS316 with Pma1-YPet integrated. Pma1 with 848 bases upstream and YPet were PCR amplified using primer pair Pr45/46 and Pr47/Pr48, respectively. The pRS316 vector was digested with a blunt end cut using Sma I via manufacturers protocol (New England Biolabs). The complete vector was created via a three way homologous recombination in S. cerevisiae . pLS002 is a derivative of pLS001 in which Pma1 was truncated by PCR amplification of pLS001 and using primer pair Pr49/Pr50 a circular vector was formed by homologous recombination of both ends. To introduce an additional protein domain at the C-terminal end of YPet, we used the primer pair Pr58/59 for gapC (C terminus of Gap1) and pR60/61 for malE . The amplified cassettes were transformed into S. cerevisiae BY4742, and homologous recombination of the cassette into the genome was selected by growth on leucine- (in case of gap1C ), or histidine- (in case of MBPs) depleted medium. The pLS005 vector was constructed by amplifying the backbone of pLS003 with the primer pair Pr54/55. The fragment coding mCardinal was amplified with primer pair Pr56/57, using a synthetic codon-optimized mCardinal gene as template (GeneArt, Regensburg, Germany). The pLS007 was constructed by amplifying the backbone of pLS005 with two pairs of primers: Pr66/67 and Pr68/69. The DNA fragment coding for Nha1 was amplified from the genome of S. cerevisiae using primer pair Pr70/71 a circular vector was formed by homologous recombination of overlapping ends in S.cerevisiae . Similarly plasmid pLS008 was constructed by amplifying the backbone of pLS005 with two pairs of primers: Pr66/67 and Pr68/69. The DNA fragment coding for Pma1 was amplified from the genome of S. cerevisiae using primer pair Pr72/73. Microscopy equipment For super-resolution microscopy measurements, a fully automated home-built microscope was used 43 . We constructed a wide-field single-molecule fluorescence microscope by coupling high-power laser excitation into a commercially available inverted fluorescence microscope body (IX-81, Olympus), equipped with a 1.49 NA ×100 objective and a 512 × 512 pixel EM-CCD camera (C9100-13, Hamamatsu). Excitation light was provided by continuous wave optically pumped semi-diode lasers (Sapphire LP, Coherent) of wavelength 514 nm (150 mW max. output) and 568 nm (200 mW max. output). For imaging mKate2 and mEos3.1 fusions, we used 568 nm excitation light and collected light emitted between 610 and 680 nm (ET 645/75 m filter, Chroma). For imaging YPet fusions, we used 514 nm laser excitation and collected light between 525 and 555 nm (ET540/30 m filter, Chroma). For FRAP measurements, a commercial laser-scanning confocal microscope, LSM 710 (Carl Zeiss MicroImaging, Jena, Germany) was used. The microscope was equipped with a C-Apochromat ×40/1.2 NA objective and a blue argon ion laser (488 nm). For the SPT experiments, a home-built Olympus IX-81-ZDC inverted TIRF microscope was used. The microscope was equipped with a UAPON 1.49 NA ×100 TIRF objective (Olympus, Inc), a manual open-frame microscope stage (M-545) (Physik instruments, Inc), a 512 × 512 Electron Multiplying Charge-Coupled Device (EMCCD) C9100-13 camera (pixel size 80 nm, EM gain 1200×) (Hamamatsu, Inc) and Xcellence ® software (Olympus, Inc). Fluorescent proteins were excited with continuous wave (CW) lasers (Coherent Sapphire, Inc). During the microscopy experiments, Z-drift was compensated by z-axis control, which is an option built into the IX81. Emission was filtered using bandpass filters obtained from AHF ® (AHF, Inc). For imaging Ypet, the bandpass filter HC535/22 (Semrock, Inc) was used, whereas for imaging mCardinal the bandpass filter HC630/92 (Semrock, Inc) was used.
Fluorescence recovery after photobleaching measurements
All fluorescence recovery after photobleaching (FRAP) measurements were performed on cells expressing the target protein from plasmids pFB001, pFB002, pFB003, and pFB004 in their respective endogenous knockout strain. Cells were induced with 0.2% [w/v] galactose for 2.5 h prior to the FRAP measurement and subsequently suspended in glucose medium to avoid further transcription. Cells were immobilized in between two microscope slides and the focal plane positioned to the mid-section of the cells. Subsequently, an area, corresponding to the PM or vacuolar membrane (VM), with a radius of ~1.0 µm was photo-bleached with a short (26 µs) focused high-power light pulse. Immediately afterwards, several images of the fluorescence recovery were collected every 20 s or 110 ms for the plasma or vacuolar membrane, respectively, over a total time period of 2400 s and 5 s, using a laser output power of 517 W/cm 2 . During the entire experiment, the stage was heated to 30 °C, using a Pecon climate chamber. Data analysis was carried out in imageJ 44 . Images were corrected for x – y drift using cross-correlation fitting. The fluorescence intensity over time of the PM was corrected for photobleaching effects by fitting the decay to a single exponential. The bleaching area was selected and the recovery was fitted with Eq. ( 1 ) to find the half-time of recovery. 1 documentclass[12pt]{minimal} usepackage{amsmath} usepackage{wasysym} usepackage{amsfonts} usepackage{amssymb} usepackage{amsbsy} usepackage{mathrsfs} usepackage{upgreek} setlength{oddsidemargin}{-69pt} begin{document}$$fleft( t right) = Aleft( {1 - mathrm{e}^{frac{{ - ln left( 2 right)}}{{tau _{0.5}}}t}} right)$$end{document} f t = A 1 - e - ln 2 τ 0.5 t The diffusion coefficient ( D ) was estimated according to Eq. ( 2 ), derived from Axelrod et al. 45 : 2 documentclass[12pt]{minimal} usepackage{amsmath} usepackage{wasysym} usepackage{amsfonts} usepackage{amssymb} usepackage{amsbsy} usepackage{mathrsfs} usepackage{upgreek} setlength{oddsidemargin}{-69pt} begin{document}$$D = gamma frac{{w^2}}{{4tau_{0.5}}}$$end{document} D = γ w 2 4 τ 0.5 where D is the diffusion coefficient, w the radius of the bleaching spot, τ 0.5 the half-time of recovery and γ a correction factor which is 0.88 for circular beams. The radius of the bleaching spot was 1.0 ± 0.1 μm as determined by Meinema et al. 23 . The analysis methods for FRAP are designed to determine the diffusion of molecules in a plane. Here, we were looking at the middle of yeast cells with molecules diffusing on a curved plane that we observe from the side. We thus investigated the accuracy of the analysis methods by simulating the various experiments and comparing input with “observed” diffusion coefficients. All simulations were performed in Smoldyn 46 , which simulates particles undergoing random walks on specified geometries. Further analysis of simulated trajectories was performed in Mathematica. For the FRAP simulations we used a sphere with a radius of 2.5 µm. For each simulation, 5000 particles were distributed randomly over most of the surface, leaving a “bleached” area free of particles. Two bleach area sizes were used: (1) a (nearly) rectangular region of 2 µm in width and 1 µm in height and (2) a (nearly) square region of 2 µm in width and 2 µm in height. The width used here is similar to the width of the bleaching area in the experimental FRAP measurements. Five simulations were performed with the small rectangular bleach area. All with an input diffusion coefficient of 10 −4 µm 2 /s, a simulation time step of 0.2 s and a total simulation time of 10 5 s. Ten simulations were performed with the big square bleach area with five different diffusion coefficients, 10 −4 –1 µm 2 /s. The simulation time steps and total simulation times were 0.2–2 × 10 −5 s and 10 5 –10 s, respectively (in steps of 10-fold). For each simulation, the number of particles in the bleached area was recorded over time. The recovery profile was fitted with Eq. ( 1 ). The obtained time constant, τ 0.5 , was used in Eq. ( 2 ) to calculate D .
Single-particle localization analysis
Single-particle localization was performed by using custom-written plug-ins for ImageJ. Photon detection using the EMCCD camera results in point spread functions (PSFs), which can be modeled by a two-dimensional Gaussian function (Eq. 3 ). Here, b is the background pixel intensity, coefficient A is the amplitude, x 0 and y 0 correspond to the center position, σ x and σ y are the x and y spread of the PSF. 3 documentclass[12pt]{minimal} usepackage{amsmath} usepackage{wasysym} usepackage{amsfonts} usepackage{amssymb} usepackage{amsbsy} usepackage{mathrsfs} usepackage{upgreek} setlength{oddsidemargin}{-69pt} begin{document}$$fleft( {x,y} right) = b + A * mathrm{e}^{ - left( {frac{{left( {x - x_0} right)^2}}{{2sigma _x^2}} + frac{{left( {y - y_0} right)^2}}{{2sigma _y^2}}} right)}$$end{document} f x , y = b + A * e - x - x 0 2 2 σ x 2 + y - y 0 2 2 σ y 2 To detect all foci per frame, we applied a discoidal filter 47 to reduce noise. Two images are generated, one by applying a discoidal-averaging filter with a diameter of 3 pixels, another one by applying an annular averaging filter with a width of 1 pixel and a diameter of 7 pixels on the original image. The difference between the two images is subsequently used to find local maxima. Pixels with a value 4–5 times the standard deviation above the mean pixel value were regarded as peaks. We fitted a two-dimensional Gaussian function (Eq. 3 ) to all peaks on the original non-filtered image using the Levenberg–Marquardt method 48 , 49 . The resulting Gaussian profiles gave the sub-pixel coordinates of the peak positions (corresponding to x 0 , y 0 of Eq. 3 ) for each frame. Size determination of MCC/eisosomes Cells expressing Sur7-YPet and/or Pil1-mKate2 were premixed with fluorescent microspheres (TransFluoSpheres (488/560)), then embedded in 0.5% (w/v) low-melting agarose and placed in between two microscope slides. Single fusion strains showed no bleed-through between channels. YPet and mKate2 are not known to be photo-switchable, but we successfully used the proteins for high-resolution imaging by first forcing the molecules into a dark state with an intense laser pulse (1800 W/cm 2 ) at the excitation maximum of the fluorophore (514 or 568 nm) and, subsequently, re-activating individual molecules with a 405 nm laser and imaging with the excitation lasers. Typically, 1000 frames were recorded in each fluorescence channel, collected at room temperature (20 °C). Super-resolution image reconstructions were generated after processing of the data with home-written software for dual-color PALM. Single particles were localized with a localization accuracy of ~ 30 nm. We corrected for chromatic aberration using the fluorescent microspheres. The dimensions of the MCC/eisosome compartment were determined from the reconstructions and measured as shown (Fig. 1c, d and Supplementary Figure 1 ). All data was averaged, and it was taken into account that MCC/eisosomes were imaged randomly from different angles. We calculated width and length values that would match the averaged sampling value, under the assumption that all pictures were made with a random MCC/eisosome orientation.
Super-resolution imaging of Can1 and Lyp1 molecules
Cells expressing Can1-mEos3.1, or Lyp1-mEos3.1 were premixed with fluorescent microspheres. For mEos3.1 imaging excitation light ( λ EX = 568 nm) was introduced at 180 W/cm 2 for all the samples. A second laser ( λ EX = 405 nm) was used to photo-switch individual mEos3.1 molecules from a green to a red fluorescent state. The laser power was adjusted to activate only a small sub-set of molecules at a time and was kept the same for all the experiments. Typically, 5000 frames were collected per measurement, with the microscope at ~20 °C. For the super-resolution dual-color imaging of Lyp1-Ypet and Can1-Ypet vs. Pil-mKate2 the same method was applied as described in the paragraph above. Reconstructions were made as shown in Fig. 2a, b . The total number of localizations of Can1-Ypet and Lyp1-Ypet at the middle of the cell was counted and averaged per cell in each medium condition shown in Fig. 2d .
Cross-correlation microscopy
Cells expressing Pil1-mKate and one of the following constructs: Sur7-YPet, Lyp1-YPet, Lyp1-L-YPet, Lyp1(∆C)-L-YPet, Can1-YPet, Can1-L-YPet, Can1(∆C)-L-YPet, Can1-L-YPet-MBP, Can1-L-YPet-gapC, Can1-YPet-MBP, Can1-YPet-gapC, Nha1-YPet, Nha1-L-YPet, or with pLS001, or pLS002 plasmids were grown to early exponential phase (OD of 0.1–0.3) and condensed by centrifugation at 3000× g for 5 min. In the experiment testing effect of substrate on localization of the protein, arginine and lysine (1.25 mM) was added 40, or 120 min before the centrifugation. Cells were immobilized in between two microscope slides and the focal plane positioned to the mid-section of the cells. We imaged mKate2 with excitation from the 568 nm laser (75 W/cm 2 ) with 30.5 ms exposure time and YPet with excitation of 514 nm laser (75–180 W/cm 2 , depending on protein imaged) with 30.5 ms exposure time. Co-localization analysis of line-scan data was performed using van Steensel’s approach 19 . To generate line scans, a 500 nm wide line selection was drawn around the periphery of each cell in ImageJ 44 , and the fluorescence intensity in each of the two-color channels recorded as a function of position along the line. For each pair of YPet and mKate2 line scans, the Pearson correlation coefficient between the color channels was calculated using a home-written Python program, the intensity information of one line scan was shifted by one pixel unit (100 nm) and the correlation coefficient recalculated. This process of pixel shifting and correlation was repeated to produce plots of correlation coefficient vs. shift distance for each cell. The plots were then averaged to obtain a measure of intensity correlation vs. distance along the cell periphery. To measure the response of uncorrelated line scans, we paired each YPet line scan with a spatially unrelated mKate2 line scan, selected randomly from a different cell of the same strain. The random selection and analysis steps were repeated 100 times and the correlation coefficient vs. shift distance series of all cells were averaged.
Super-resolution microscopy in TIRF mode and size of eisosomes
Prior to silanization with APTES, coverslips were cleaned from fluorescence impurities. First, high precision coverslips, 75 × 25 mm (0.17 mm thickness), were sonicated for 30 min at 30 °C in acetone (99.5%), and, subsequently, sonicated for 45 min at 30 °C in 5 M KOH. After sonication, the coverslips were washed several times with double-distilled H 2 O (ddH 2 0). Residual solvents were dried out using pressurized N 2 and 30 min incubation at 110 °C. Next, the coverslips were plasma cleaned (PE-50, Plasma Etch, Inc) for 10 min. Directly after plasma cleaning, 2% APTES (v/v) in acetone was added to the coverslips. After 10 s, coverslips were washed several times with acetone and were dried out by using pressurized N 2. The APTES coated coverslips were then stored under vacuum. Prior to the microscopy experiment, a bottomless µ-Slide (Ibidi, Inc) was placed on an APTES coated coverslip. In order to attach glutaraldehyde to the APTES, 5% glutaraldehyde was added to each well. After 10–15 min incubation, each well was washed several times with ddH 2 O before addition of cells. The procedure resulted in a covalent bond between the free aldehyde groups of the glutaraldehyde and the amino acid groups present on the cell wall surface of yeast cells 50 . Cells expressing Pil-mKate2, and Sur7-Ypet were grown to mid-exponential growth phase (OD 600 0.5–0.7) were centrifuged at 3000× g for 4 min. The pellets were resuspended in ddH 2 O and mixed with TransFluoSpheres beads (488/560). Cells were subsequently added to wells of a bottomless µ-Slide (Ibidi, Inc) stuck onto an APTES-glutaraldehyde-coated coverslip (see above). Prior to imaging, low fluorescence medium lacking lysine and arginine was added to maintain cells in a healthy state during the microscopy experiments. Imaging of YPet was accomplished by 514-nm excitation with a power density of 1.4 kW/cm 2 . Movies of 600 frames were taken for each fluorescent channel. In order to excite mKate2, light of 561 nm was provided with a power density of 0.7 kW/cm 2 . Both for imaging YPet and mKate2 molecules an exposure time of 30.5 ms was used. The dimensions of the eisosomes were determined by calculating the major and minor axis from all fitted peak positions. First, the positions of all eisosomes are determined by thresholding a super-resolution reconstruction of all fitted peaks. For each eisosome we consider all fitted peaks that have a distance of less than one pixel from its center. From the fitted peaks, that belong to the eisosome, we determine its orientation by using linear regression. The fitted peaks are subsequently rotated such that the major axis is along the x -axis and the minor axis along the y -axis. The length of the major and minor axis is determined by fitting an ellipse that contains 75% of all peaks. By taking a fraction of all peaks we filter out outliers. Including all fitted peaks would result in an overestimate of the major and minor axis. SPT in TIRF mode and distance correlation to MCC/eisosomes Cells expressing Sur7-YPet and Can1-mCardinal, or carrying pLS005, pLS007, and pLS008, grown to mid-exponential growth phase (OD 600 0.5–0.7), were centrifuged at 3000× g for 4 min. Cells with plasmids were induced for 40 min by 0.1% D-galactose prior to centrifugation. Slides were coated and samples were prepared as described in section (Preparation of APTES-glutaraldehyde-coated coverslips for SPT experiments). A TIRF time-lapse movie was obtained by exciting with a 561 nm laser (0.5 kW/cm 2 ), using an exposure time of 30.5 ms every 10 s for 150–200 frames. Subsequently, imaging of YPet molecules was accomplished by 514 nm excitation (1.4 kW/cm 2 ), using an exposure time of 30.5 ms. In this way, YPet was forced into a short-lived photo-darkened state. After data collection, the time-lapse movies were drift-corrected by fitting the fluorescent beads with a two-dimensional Gaussian function; the beads were tracked throughout the movie. The offset between the two different channels was measured by the difference in fitted-position of all the fluorescent beads on the first frame of the two corresponding movies. By using the fitted coordinates of Sur7-YPet, we constructed a high-resolution image of the eisosomes. The resulting peaks in the reconstructed image were then clustered by iteratively applying a mean-filter with decreasing radii (400–120 nm). The precise center-coordinates of the eisosomes were determined by averaging all the centroids of the peaks that were located within radial distance of 240 nm from the maxima in the filtered high-resolution image. SPT trajectories of Can1-mCardinal, Nha1-mCardinal, and Pma1-mCardinal were obtained from the TIRF time-lapse movies. These trajectories were constructed by linking together peaks that appear within a pre-defined radius of 240 nm in subsequent frames. The distance from the starting point of each trajectory to the center-coordinate of its closest eisosome was then calculated and plotted in an histogram using Eq. ( 4 ) for the optimal bin width 51 . Besides, for each eisosome, the closest distance to a neighboring eisosome was calculated. 4 documentclass[12pt]{minimal} usepackage{amsmath} usepackage{wasysym} usepackage{amsfonts} usepackage{amssymb} usepackage{amsbsy} usepackage{mathrsfs} usepackage{upgreek} setlength{oddsidemargin}{-69pt} begin{document}$${mathrm{Bin}},{mathrm{width}} = 3.49sigma n^{ - frac{1}{3}}$$end{document} Bin width = 3.49 σ n - 1 3 Data analysis was exclusively performed within certain regions of interests (ROIs) that excluded edges of cells, to avoid membrane curvature. Heterogeneity in the diffusion behavior of the proteins was analyzed by the cumulative probability distribution (CPD) of the obtained step sizes. The CPD function gives the probability of finding the particle within a circle with radius r at a given time lag τ 52 . First a probability density function (PDF) was created in MATLAB ® from the experimental step sizes, and, given the localization accuracy of our measurements, excluding step sizes smaller than 16 nm. The PDF was normalized resulting in the CPD, to which the cumulative probability distribution function (CPF) (Eq. 5 ) was fitted. The CPF is given in Eq. ( 5 5 ), where D is the lateral diffusion coefficient and σ the localization accuracy. 5 documentclass[12pt]{minimal} usepackage{amsmath} usepackage{wasysym} usepackage{amsfonts} usepackage{amssymb} usepackage{amsbsy} usepackage{mathrsfs} usepackage{upgreek} setlength{oddsidemargin}{-69pt} begin{document}$$mathrm{CPF}left( {r^2,tau } right) = 1 - mathrm{e}^{left( {frac{{ - r^2}}{{4{{D}}tau + 4sigma ^2}}} right)}$$end{document} CPF r 2 , τ = 1 - e - r 2 4 D τ + 4 σ 2 The localization accuracy σ was determined from the mean error in the x and y parameters of the Gaussian fit. For a homogeneous population of diffusing particles, the cumulative probability function will result in a single exponential decay, while for a heterogeneous diffusive population, the corresponding CPF is expected to resemble the sum of multiple exponentials, depending on the number of populations with a distinct diffusion coefficient. The CPF goodness-of-fit was determined by calculating the residual sum of squares (RSS); the multi-component model that fitted best, i.e., RSS closed to 0, was used to calculate the diffusion coefficient for each population.
Data availability
Source data for this study are available from the authors upon request.
Electronic supplementary material Supplementary Information
📊 Figures
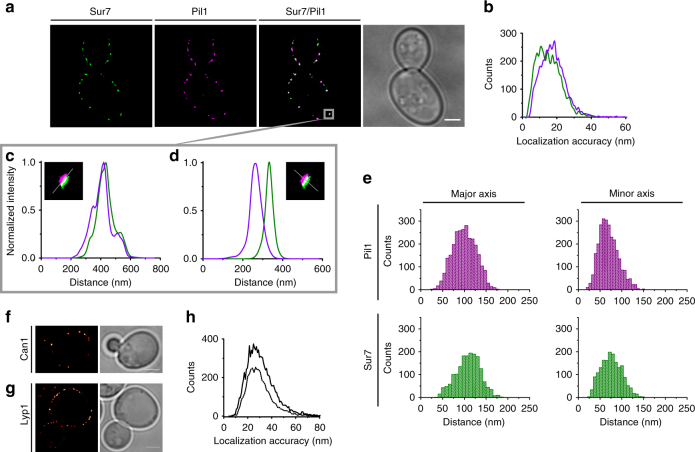
Fig. 1
High-resolution plasma membrane protein localization. a Dual-color super-resolution reconstructions of Sur7-YPet in green and Pil1-mKate2 in magenta. Co-localizations appear in white. b The localizati...
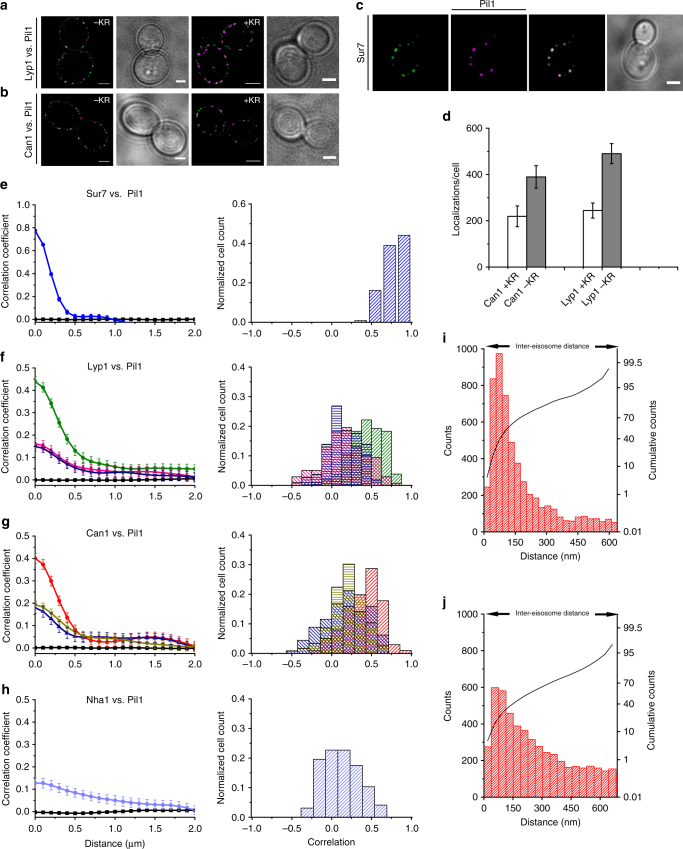
Fig. 2
Substrate-dependent localization of proteins. Dual-color reconstructions of a Lyp1-L-YPet/Pil1-mKate2 and b Can1-L-YPet/Pil-mKate2 with and without lysine plus arginine in the growth medium, indicated...
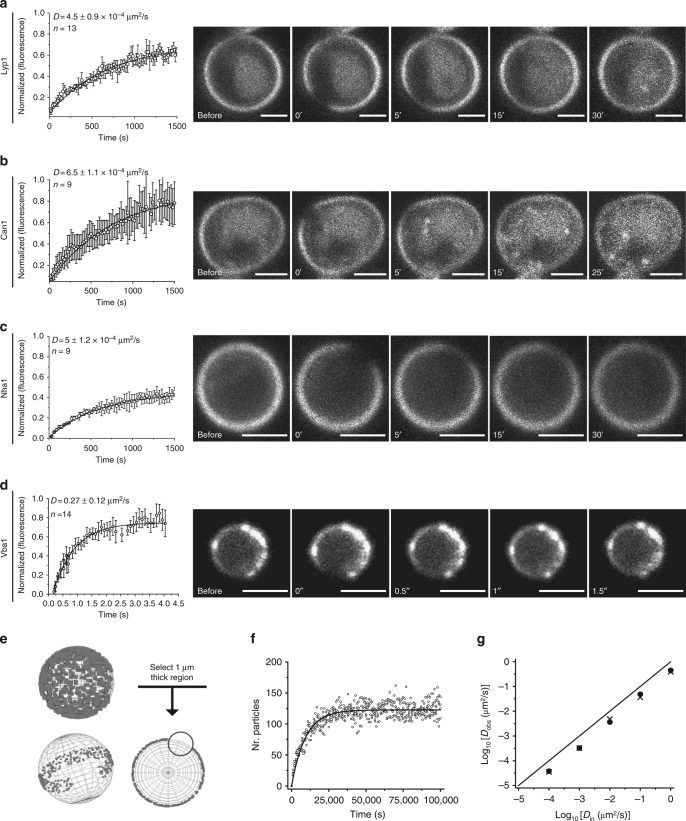
Fig. 3
FRAP measurements to probe long-range diffusion. Normalized fluorescence recovery of YPet-tagged transporters expressed from a plasmid in the respective endogenous knockout strain: Lyp1-YPet (immobile...
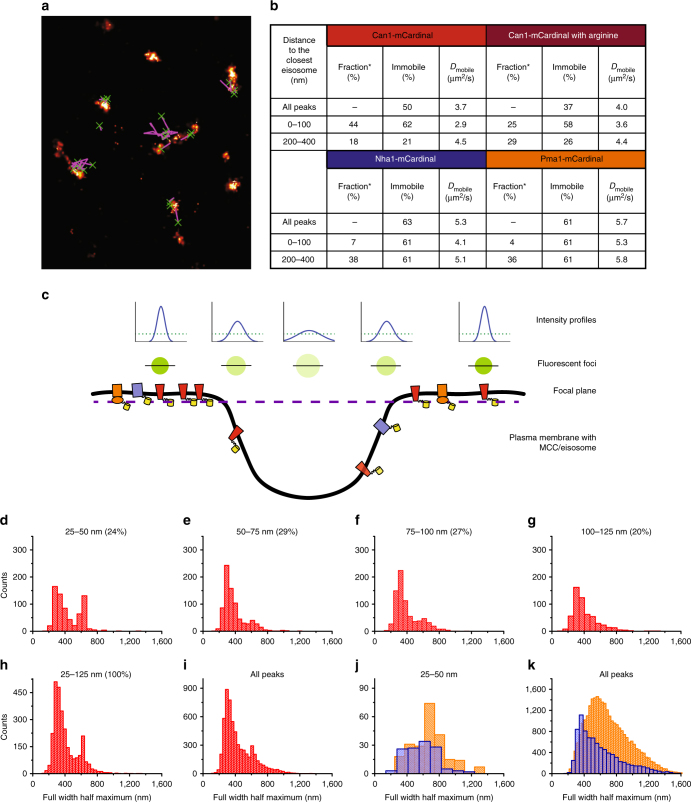
Fig. 4
Lateral diffusion and distance dependence of membrane proteins relative to MCC/eisosomes. a Reconstruction of the trajectories: bright areas correspond to eisosomes, green Xs mark starting point of Ca...
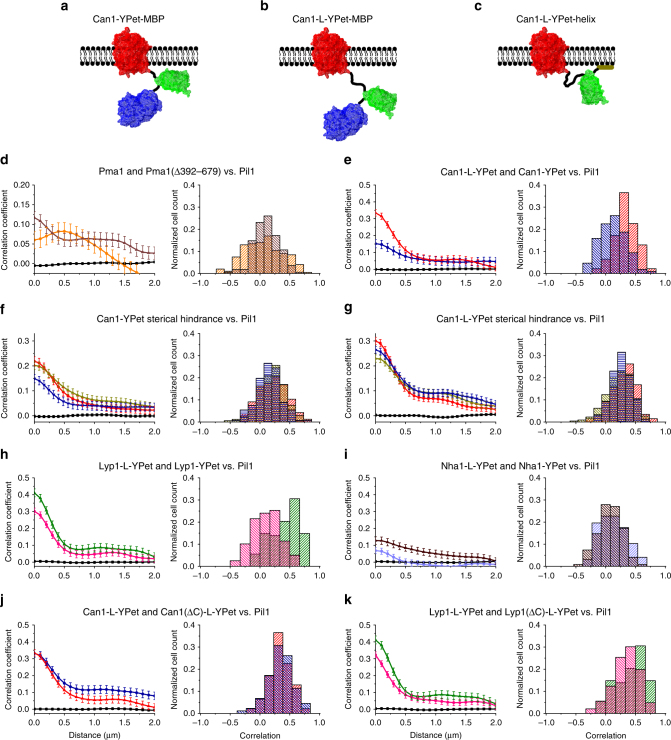
Fig. 5
Steric occlusion from MCC/eisosomes. Schematic of transporter constructs ( a u2013 c ) to investigate the possible hindrance for MCC/eisosome entry by engineering cytoplasmic domains onto Can1. Maltos...
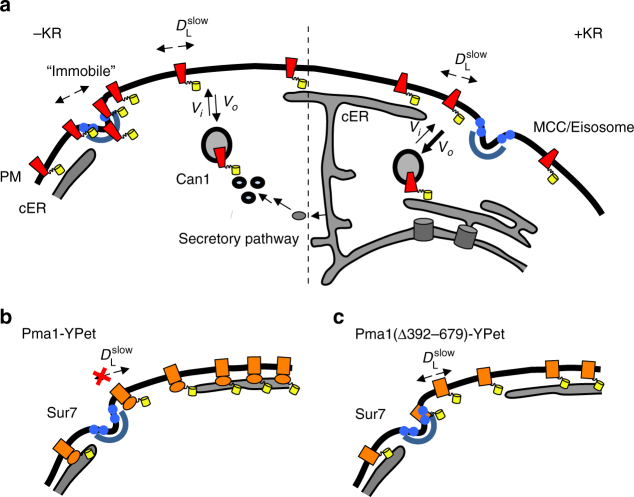
Fig. 6
Cartoon summarizing the main findings on diffusion and localization of plasma membrane proteins. a The plasma membrane (PM), cortical ER (cER) and two MCC/eisosomes (Sur7 in the membrane and Pil1 scaf...
Figure images are served from the NIH/NLM PubMed Central Open Access Subset or Europe PMC; copyright remains with the publishers and authors.
💬 Discussion
0 commentsNo comments yet. Be the first to start a discussion!
Leave a Comment