Abstract
HIV-1 buds form infected cells in an immature, non-infectious form. Maturation into an infectious virion requires proteolytic cleavage of the Gag polyprotein at five positions, leading to a dramatic change in virus morphology. Immature virions contain an incomplete spherical shell where Gag is arranged with the N-terminal MA domain adjacent to the membrane, the CA domain adopting a hexameric lattice below the membrane, and beneath this, the NC domain and viral RNA forming a disordered layer. After maturation, NC and RNA are condensed within the particle surrounded by a conical CA core. Little is known about the sequence of structural changes that take place during maturation, however. Here we have used cryo-electron tomography and subtomogram averaging to resolve the structure of the Gag lattice in a panel of viruses containing point mutations abolishing cleavage at individual or multiple Gag cleavage sites. These studies describe the structural intermediates correlating with the ordered processing events that occur during the HIV-1 maturation process. After the first cleavage between SP1 and NC, the condensed NC-RNA may retain a link to the remaining Gag lattice. Initiation of disassembly of the immature Gag lattice requires cleavage to occur on both sides of CA-SP1, while assembly of the mature core also requires cleavage of SP1 from CA.
🔬 Techniques
🔭 Microscopes
🧪 Sample Preparation
🔬 Cell Lines
🏭 Microscope Brands
🧪 Reagent Suppliers
📷 Detectors
💻 Software Details
🏛️ Research Organizations (ROR)
Affiliated research institutions:
📋 Methods
Constructs and virus preparation
Derivatives of proviral plasmid pNL4-3 carrying mutations at specific PR cleavage sites within Gag, as well as the PR defective variant NL4-3D25A have been described previously [26] , [38] . 293T cells were maintained in DMEM with 10% fetal calf serum and antibiotics. Transfections with the indicated proviral derivatives were performed using the calcium phosphate method. Culture media were harvested at 42 h post transfection cleared by low speed centrifugation (5 min, 1500 g) followed by filtration through 0.45 µM nitrocellulose filters. Particles were purified by centrifugation through a 20% (w/w) sucrose cushion and subsequent centrifugation on an Iodixanol gradient as described [39] . Purified virus was inactivated with 1% paraformaldehyde for 1 h on ice. Successful inactivation was confirmed by infection of C8166 cells and scoring for syncytia formation up to 10 days after inoculation. At least 3 independent particle preparations were analyzed for each variant shown with no variability in the structures with the exception of the CA-SP1.
Sample preparation and data acquisition
Purified viruses were mixed with 10 nm colloidal gold particles, deposited on C-flat holey Carbon grids, and vitrified by plunge-freezing in liquid ethane. Tilt series were collected on an FEI Tecnai F30 “Polara” transmission electron microscope with Gatan GIF 2002 post column energy filter and 2 k×2 k Multiscan CCD camera. Data collection was performed at 300 kV using the SerialEM Software. Tilt series were collected between 60° and −60° with 3° angular increment; the total electron dose applied to the tomograms was approximately 90 e/Å 2 . Tomograms were acquired at defocuses between 2.6 and 6.0 µm, with a magnification of 34000X resulting in a pixel size at the specimen level of 4.0 Å.
Show full methods section
Constructs and virus preparation
Derivatives of proviral plasmid pNL4-3 carrying mutations at specific PR cleavage sites within Gag, as well as the PR defective variant NL4-3D25A have been described previously [26] , [38] . 293T cells were maintained in DMEM with 10% fetal calf serum and antibiotics. Transfections with the indicated proviral derivatives were performed using the calcium phosphate method. Culture media were harvested at 42 h post transfection cleared by low speed centrifugation (5 min, 1500 g) followed by filtration through 0.45 µM nitrocellulose filters. Particles were purified by centrifugation through a 20% (w/w) sucrose cushion and subsequent centrifugation on an Iodixanol gradient as described [39] . Purified virus was inactivated with 1% paraformaldehyde for 1 h on ice. Successful inactivation was confirmed by infection of C8166 cells and scoring for syncytia formation up to 10 days after inoculation. At least 3 independent particle preparations were analyzed for each variant shown with no variability in the structures with the exception of the CA-SP1.
Sample preparation and data acquisition
Purified viruses were mixed with 10 nm colloidal gold particles, deposited on C-flat holey Carbon grids, and vitrified by plunge-freezing in liquid ethane. Tilt series were collected on an FEI Tecnai F30 “Polara” transmission electron microscope with Gatan GIF 2002 post column energy filter and 2 k×2 k Multiscan CCD camera. Data collection was performed at 300 kV using the SerialEM Software. Tilt series were collected between 60° and −60° with 3° angular increment; the total electron dose applied to the tomograms was approximately 90 e/Å 2 . Tomograms were acquired at defocuses between 2.6 and 6.0 µm, with a magnification of 34000X resulting in a pixel size at the specimen level of 4.0 Å.
Image processing
Tomograms were reconstructed using IMOD [40] . Subtomogram averaging was carried out as described in [10] and below using MATLAB (Mathworks). Lattice map representations were generated using Amira (Visage Imaging), together with the EM Package [41] . A hexagon is placed at the final aligned position of each tomogram, and coloured according to the cross-correlation value between the sub-tomogram and the average. Tomograms aligned to an inappropriate radial position were excluded based on the radii distribution of the set of 20 nearest subtomograms surrounding each subtomogram. If the radius of the selected subtomogram was in the first or in the fourth quartile of the distribution the subtomogram was excluded. Only hexagons with a cross-correlation over a defined threshold are displayed. The threshold was appropriately set such that hexagons were not displayed where density corresponding to Gag was absent in the tomogram. Density maps were displayed using Amira, surface rendering was done using UCSF Chimera [42] .
Subtomogram averaging
For subtomogram averaging, tomograms collected at defocuses between 2.6 and 2.9 µm were used. Sub-volumes of (38.3 nm) 3 were extracted from tomograms along the surface of a sphere centred in the centre of the virus and with a radius equal to the mean radius at CA level. The sub-volumes were iteratively aligned. The initial reference used for the alignment was the average of the subtomograms in the extraction position. All variants subjected to sub-tomogram averaging show 6-fold symmetry, as evidenced using radius-angle-frequency plots (see Text S1 and Figure S2 ). 6-fold symmetry was therefore applied to the average after all iterations. The threshold for the subtomograms to be averaged was set to the mean cross-correlation value between all subtomograms and the reference. The final reconstructions had a resolution according to the Fourier shell correlation with a 0.5 criterion of approximately 26.5 Å in the CA region ( Figure S3A ) and are filtered to this resolution. The resolution varies with radius, with the highest resolution in the CA region ( Figure S3B ).
Supporting Information Text S1 Supplementary methods. (0.05 MB PDF) Click here for additional data file. Figure S1 The morphology of virus variants. Central sections of tomographic reconstructions of the HIV-1 variants analyzed acquired at different defocuses (df), and coming from 3 different preparations, to illustrate consistency of virus morphology between preparations. A gaussian filter was applied the tomograms (8 kernel, 0.4 sigma). The scale bar is 50 nm. (5.19 MB TIF) Click here for additional data file. Figure S2 Radius-angle-frequency plots. A) 3D view of the radius-angle-frequency plot calculated from the immature HIV data, illustrating the relationship between the three axes. Three perpendicular sections are shown intersecting at the point: 53 nm radius, 60° angle and 7 nm frequency. The colour bar represents the value of autocorrelation and is common to all the panels in the figure. The presence of a peak at a particular point in radius, frequency and angle indicates that at that radius in the virus, the 2D power spectrum of the protein layer has peaks at that frequency which are arranged rotationally symmetrically repeating at that angle (see supplementary methods). B–F) Data from 5 variants. The top panel is a section at the radius where the C-CA domain is found showing two peaks at 60° and 120°, with 7 nm frequency, as expected from a hexagonal unit cell with 8 nm spacing (see supplementary methods). The peaks at 0 and 180° are seen in all 2D power spectra since power spectra have intrinsic 2-fold symmetry. The middle panel is a section at 60° angle that shows that the 7 nm peak is extended across the CA region. The third panel is the radial density profile of the virus in the regions containing Gag. Starting outside the virus (high radius) the first two peaks, typically between 55 and 65 nm, represent the two leaflets of the bilayer and the associated MA, the next two peaks, typically between 45 and 55 nm, represent CA, and the peak below 45 nm, where present, represents the NC - RNA. (2.11 MB TIF) Click here for additional data file. Figure S3 Fourier shell correlation. A) Fourier shell correlation plots for all the variants. The resolution was determined as the frequency at which the FSC curve drops below 0.5 correlation which is highlighted with the dashed line. B) Plot showing the variation in resolution according to radius. At each radius the resolution was determined by Fourier shell correlation at 0.5, with a mask centred at that radius (see supplementary methods). The positions of NC -RNA, CA, MA and membrane are indicated. (0.89 MB TIF) Click here for additional data file.
📊 Figures
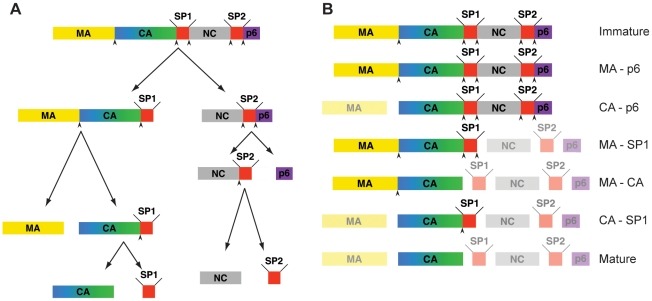
Figure 1
Steps in HIV-1 proteolytic maturation, and variants analysed.
A) Schematic outline of the proteolytic cleavages which take place in Gag during the HIV-1 maturation process. Arrowheads indicate proteolytic sites before cleavage. The order of cleavage events shown...
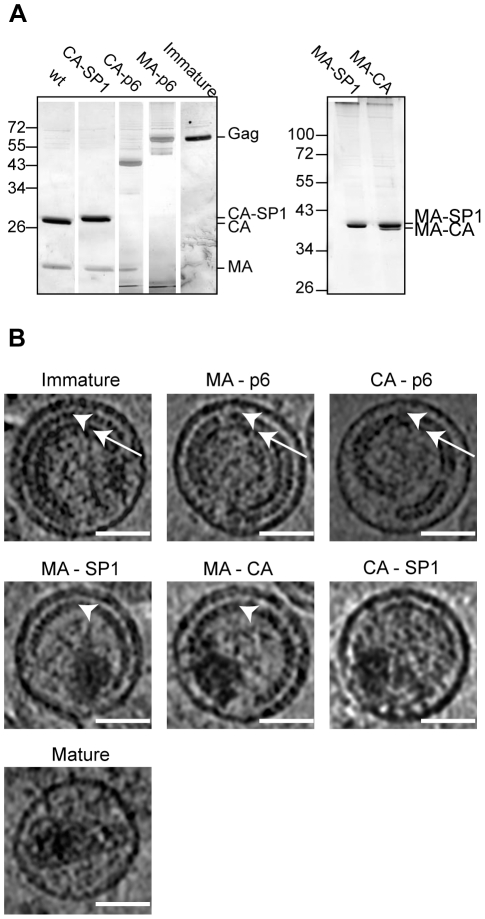
Figure 2
Characterisation of HIV-1 variants.
A) Partially processed Gag-derived products detected by SDS-PAGE. Iodixanol gradient purified particle preparations of the indicated HIV-1 variants were separated on 12.5% SDS gels. Virion-associated ...
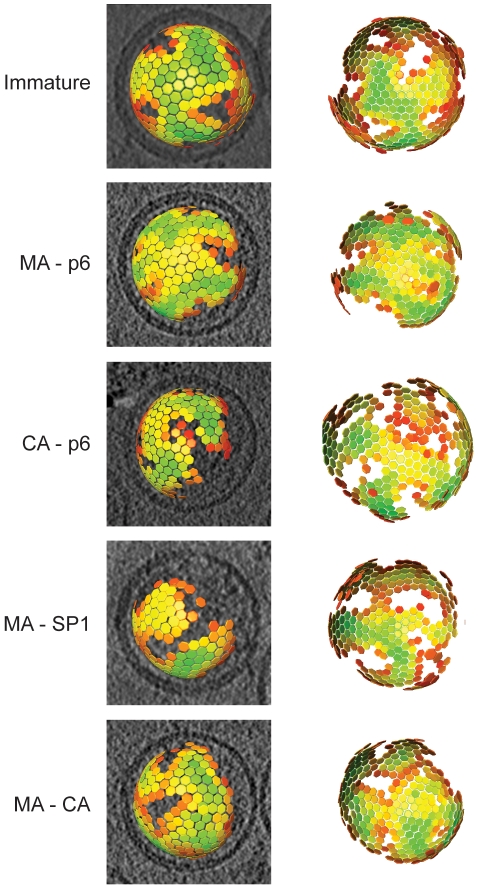
Figure 3
The global arrangement of the Gag layer.
Global lattice maps for each variant superimposed on central sections of the tomographic reconstruction of the virus (left panels), or viewed from the direction of the largest gap in the lattice (righ...
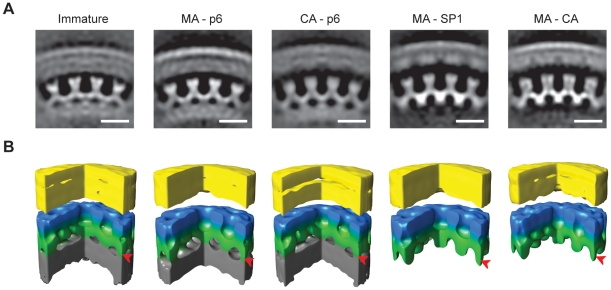
Figure 4
The local structure of the Gag layer.
A) Radial sections from the subtomogram average reconstructions coming from each variant. Density is white. The scale bar is 10 nm. B) Surface rendering of the subtomogram average reconstructions. A s...
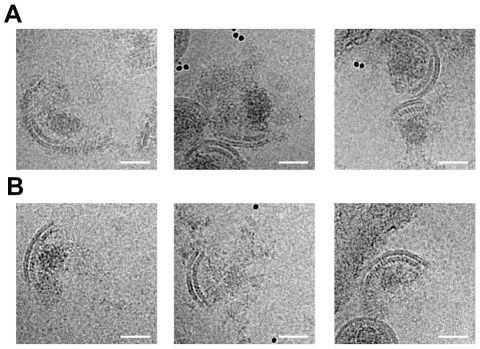
Figure 5
Analysis of disrupted virus particles.
Micrographs of MA u2013 SP1 (A) and MA u2013 CA (B) virus particles after disruption by vortexing in the presence of gold beads show patches of viral membrane with underlying CA lattice. The condensed...
Figure images are served from the NIH/NLM PubMed Central Open Access Subset or Europe PMC; copyright remains with the publishers and authors.
💬 Discussion
0 commentsNo comments yet. Be the first to start a discussion!
Leave a Comment