Abstract
AbstractTraditional photon localization microscopy analyses only the spatial distributions of photons emitted by individual molecules to reconstruct super-resolution optical images. Unfortunately, however, the highly valuable spectroscopic information from these photons have been overlooked. Here we report a spectroscopic photon localization microscopy that is capable of capturing the inherent spectroscopic signatures of photons from individual stochastic radiation events. Spectroscopic photon localization microscopy achieved higher spatial resolution than traditional photon localization microscopy through spectral discrimination to identify the photons emitted from individual molecules. As a result, we resolved two fluorescent molecules, which were 15 nm apart, with the corresponding spatial resolution of 10 nm—a four-fold improvement over photon localization microscopy. Using spectroscopic photon localization microscopy, we further demonstrated simultaneous multi-colour super-resolution imaging of microtubules and mitochondria in COS-7 cells and showed that background autofluorescence can be identified through its distinct emission spectra.
🔬 Techniques
🔭 Microscopes
💻 Software
✨ Fluorophores
🧪 Sample Preparation
🔬 Cell Lines
🏭 Microscope Brands
🧪 Reagent Suppliers
📷 Detectors
💻 Software Details
🏛️ Research Organizations (ROR)
Affiliated research institutions:
📋 Methods
Optical set-up The excitation source was a 532-nm diode-pumped solid-state laser with 300-mW maximum output. After passing through a laser clean-up filter (LL01-532-12.5, Semrock) and further attenuated by a set of ND filters, it was coupled to an inverted microscope body (Nikon, Eclipse Ti-U), reflected off a dichroic beam splitter (LPD02-532RU-25, Semrock), and introduced to the sample through the back focal plane of a Nikon CFI apochromat TIRF objective lens (× 100, 1.49 numerical aperture). By shifting the laser beam towards the edge of the TIRF objective with a translation stage, the emerging light reached the sample at near-critical angle of the glass-water interface, thereby illuminating only the fluorophores within a controlled range (usually a micrometer) above the coverslip surface. A 532-nm notch filter (OD>6, NF01-532U-25, Semrock) was placed at the emission port to reject the reflected laser beam. The fluorescence image was coupled into a Czerny–Turner-type monochromator (SP2150, Princeton Instruments) featuring a blazed dispersive grating (150 grooves per mm). The image further divided into a non-dispersed zero-order image and a spectrally dispersed first-order spectral image. By reflecting the zero-order image back to the output port with a silver mirror, both the zero-order and the first-order images can be collected by an EMCCD camera (proEM, Princeton Instruments) simultaneously. We measured the system's spectral resolution using a Mercury–Argon calibration lamp (SPL-HGAR, Photonics Technologies) with an entrance slit width of 10 μm, as shown in Supplementary Fig. 3 . By measuring the full-width half maximum of the 546.08-nm peak, the spectral resolution was calculated to be 0.63 nm. This indicates the system's spectral resolution is limited by the pixel size of the camera being used.
Show full methods section
Optical set-up The excitation source was a 532-nm diode-pumped solid-state laser with 300-mW maximum output. After passing through a laser clean-up filter (LL01-532-12.5, Semrock) and further attenuated by a set of ND filters, it was coupled to an inverted microscope body (Nikon, Eclipse Ti-U), reflected off a dichroic beam splitter (LPD02-532RU-25, Semrock), and introduced to the sample through the back focal plane of a Nikon CFI apochromat TIRF objective lens (× 100, 1.49 numerical aperture). By shifting the laser beam towards the edge of the TIRF objective with a translation stage, the emerging light reached the sample at near-critical angle of the glass-water interface, thereby illuminating only the fluorophores within a controlled range (usually a micrometer) above the coverslip surface. A 532-nm notch filter (OD>6, NF01-532U-25, Semrock) was placed at the emission port to reject the reflected laser beam. The fluorescence image was coupled into a Czerny–Turner-type monochromator (SP2150, Princeton Instruments) featuring a blazed dispersive grating (150 grooves per mm). The image further divided into a non-dispersed zero-order image and a spectrally dispersed first-order spectral image. By reflecting the zero-order image back to the output port with a silver mirror, both the zero-order and the first-order images can be collected by an EMCCD camera (proEM, Princeton Instruments) simultaneously. We measured the system's spectral resolution using a Mercury–Argon calibration lamp (SPL-HGAR, Photonics Technologies) with an entrance slit width of 10 μm, as shown in Supplementary Fig. 3 . By measuring the full-width half maximum of the 546.08-nm peak, the spectral resolution was calculated to be 0.63 nm. This indicates the system's spectral resolution is limited by the pixel size of the camera being used.
SPLM imaging procedure
The samples were placed on the microscope stage and imaged under a TIRF objective (Nikon CFI apochromat × 100, 1.49 numerical aperture). The 532-nm laser was used to excite fluorescence from Rhodamine, Alexa Fluor 568, and Mito-EOS 4b. Before acquiring SPLM images, we used relatively low-intensity 532-nm light (∼0.05 W cm −2 ) to illuminate the sample and we recorded the conventional fluorescence image before switching a substantial fraction of the dye molecules to ‘off' states. We then increased the 532-nm light intensity (to ∼2 kW cm −2 ) to rapidly switch off the dyes for SPLM imaging. The 405-nm laser was used to reactivate the fluorophores from the dark state back to the emitting state. The power of the 405-nm laser was adjusted to 0.5 W cm −2 to maintain an appropriate fraction of the emitting fluorophores. The EMCCD camera acquired images from the monochromator at a frame rate of 50 Hz with field of view of 10 × 10 μm 2 . Unless specifically noted, 10,000 frames were recorded to generate the super-resolution spectroscopic image. Imaging buffer A standard imaging buffer was freshly made and added to the sample prior to imaging. It contained TN buffer (50 mM Tris (pH 8.0) and 10 mM NaCl), an oxygen scavenging system (0.5 mg ml −1 glucose oxidase (Sigma-Aldrich)), 40 μg ml −1 catalase (Sigma-Aldrich) and 10% (w/v) glucose (Sigma-Aldrich), and 143 mM βME (Sigma-Aldrich).
Preparation of dye-labelled actin monomers
Rabbit muscle actin (Cytoskeleton, Denver, CO) was suspended to 0.4 mg ml −1 in general actin buffer (GAB, 5 mM Tris-HCl pH 8.0, 0.2 mM CaCl 2 ) supplemented with 0.2 mM ATP and 0.5 mM DTT, and then incubated on ice for 60 min to depolymerize actin oligomers. The solution was centrifuged in a 4 °C microfuge at 14 k r.p.m. for 15 min. Then, 100 μl of the actin solution was transferred from the supernatant to ultracentrifuge tubes. Alexa Fluor 532 Phalloidin solution and Alexa Fluor 568 Phalloidin solution (Life Technologies, 5 μg ml −1 in PBS with 3% BSA) were added into the actin solutions, respectively. After incubating at 37 °C for 20 min, the solutions were centrifuged at 100,000 g for 1 h. The top of the supernatant was transferred and diluted to 10 −9 M with GAB. For the single-stained imaging sample, the solution containing Alexa Fluor 568-stained actin monomers was deposited onto poly- L -lysine-coated #1.5 coverslips and washed by capillary action with GAB supplemented with 0.2 mM ATP and 0.5 mM DTT. For the dual-colour sample, two solutions containing different stained actin monomers were first mixed and then deposited onto coverslips.
Preparation of rhodamine-labelled microtubules
Rhodamine-labelled microtubules were assembled in vitro by using lyophilized rhodamine-conjugated tubulin (Cytoskeleton, Denver, CO) incubated at 37 °C for 20 min in general tubulin buffer (GTB, 80 mM PIPES pH 6.9, 2 mM MgCl 2 , and 0.5 mM EGTA) supplemented with 10% glycerol and 1 mM GTP (Cytoskeleton, Denver, CO) at a final concentration of 4 mg ml −1 . The microtubules were stabilized by incubating 25 μM taxol (Enzo Life Sciences, Farmingdale, NY) for an additional 5 min at 37 °C. For imaging, the microtubules were deposited onto poly- L -lysine-coated #1 coverslips and washed by capillary action with 100 μM GTB supplemented with 20 μM paclitaxel (taxol) and 1 mM GTP.
Preparation for cellular imaging COS-7 cells
(ATCC) were grown in DMEM (Gibco/Life Technologies) supplemented with 2 mM L -glutamine (Gibco/Life Technologies), 10% fetal bovine serum (Gibco/Life Technologies), and 1% penicillin (10,000 IU ml −1 )/streptomycin (10,000 μg ml −1 ) (Gibco/Life Technologies) at 37 °C with 5% CO 2 . The cells were transiently transfected with mEOS 4b-Tomm20 (Michael Davidson) using Bio-Rad Gene Pulser XCell, and were plated on 18-mm diameter #1.5 glass coverslips. After 48 h, the cells were fixed in 0.8% formaldehyde and 0.1% gluteraldehyde in PBS for 5 min at room temperature, reduced with 1% sodium borohydride for 7 min, and then further reduced in 1 mM lysine. Followed by extraction in 0.2% tween-20 in PBS for 5 min, the cells were rinsed with PBS and incubated in a blocking buffer (3% BSA (Sigma) and 1% normal goat serum in PBS) for 30 min at room temperature. The buffer was aspirated and the cells were incubated with mouse anti-α-tubulin antibody (Sigma, 1:1,000 dilution in PBS, 3% BSA) at 37 °C for 20 min. The cells were soaked in PBS five times in 10-min intervals to rinse off the primary antibody solution. Goat-anti mouse Alexa Fluor 568 solution (Life Technologies, 5 μg ml −1 in PBS with 3% BSA) was added to the coverslips and the cells were incubated at 37 °C for 20 min. Afterwards, the samples were rinsed in PBS for 1 h (6–7 changes) and stored in PBS at 4 °C until imaging. Prior to imaging, the sample was briefly washed once with PBS and then immediately mounted for SPLM imaging. Imaging buffer (∼4 μl) was dropped at the centre of a freshly cleaned glass slide, and the sample on the coverslip was mounted on the glass slide and sealed with dental cement.
Data availability
The data that support the findings of this study are available from the corresponding author upon request.
SPLM imaging procedure
The samples were placed on the microscope stage and imaged under a TIRF objective (Nikon CFI apochromat × 100, 1.49 numerical aperture). The 532-nm laser was used to excite fluorescence from Rhodamine, Alexa Fluor 568, and Mito-EOS 4b. Before acquiring SPLM images, we used relatively low-intensity 532-nm light (∼0.05 W cm −2 ) to illuminate the sample and we recorded the conventional fluorescence image before switching a substantial fraction of the dye molecules to ‘off' states. We then increased the 532-nm light intensity (to ∼2 kW cm −2 ) to rapidly switch off the dyes for SPLM imaging. The 405-nm laser was used to reactivate the fluorophores from the dark state back to the emitting state. The power of the 405-nm laser was adjusted to 0.5 W cm −2 to maintain an appropriate fraction of the emitting fluorophores. The EMCCD camera acquired images from the monochromator at a frame rate of 50 Hz with field of view of 10 × 10 μm 2 . Unless specifically noted, 10,000 frames were recorded to generate the super-resolution spectroscopic image.
Supplementary Material Supplementary Information Supplementary figures 1-13, Supplementary notes 1-2, Supplementary References Peer review file
📊 Figures
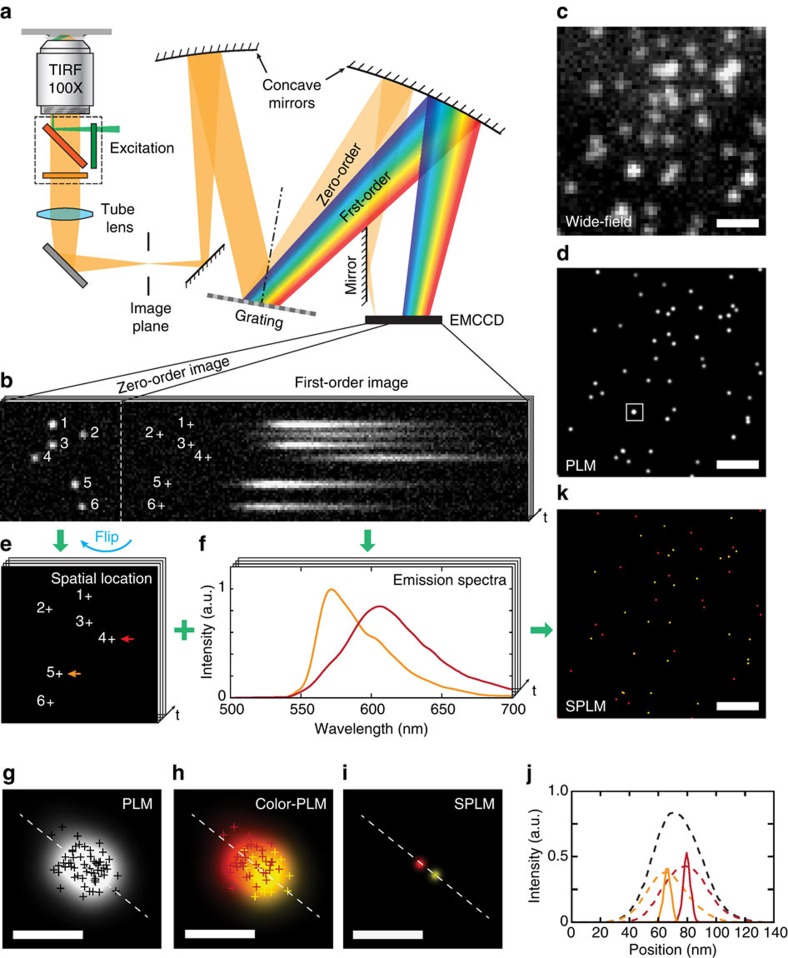
Figure 1
The working principle of SPLM.
( a ) Schematic of the SPLM system. Upon laser excitation, the fluorescent image was collected by a high-numerical aperture objective lens and subsequently coupled into a Czernyu2013Turner monochromat...
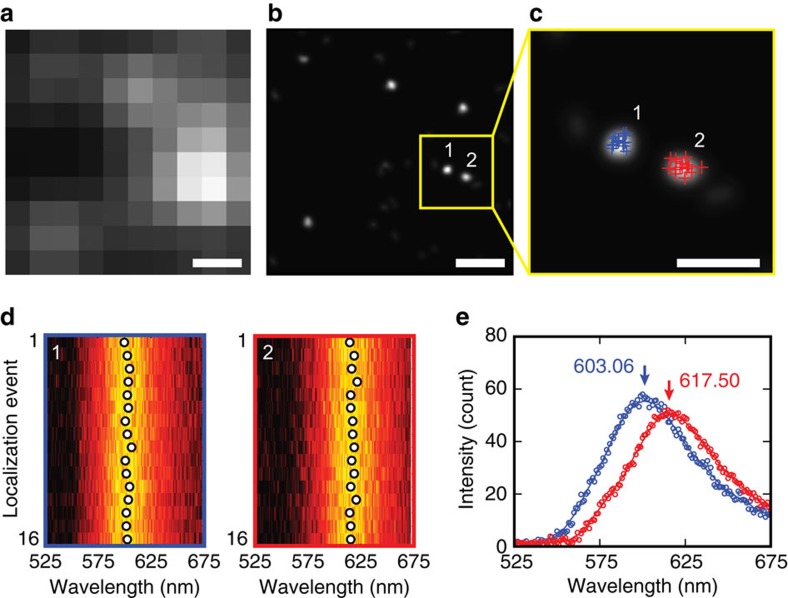
Figure 2
Differentiating individual molecules by exploiting their heterogeneous fluorescence.
( a ) Wide-field optical image and ( b ) PLM image of actin monomers labelled by Alexa Fluor 568. PLM image was reconstructed from localization coordinates using localization precision as the full-wid...
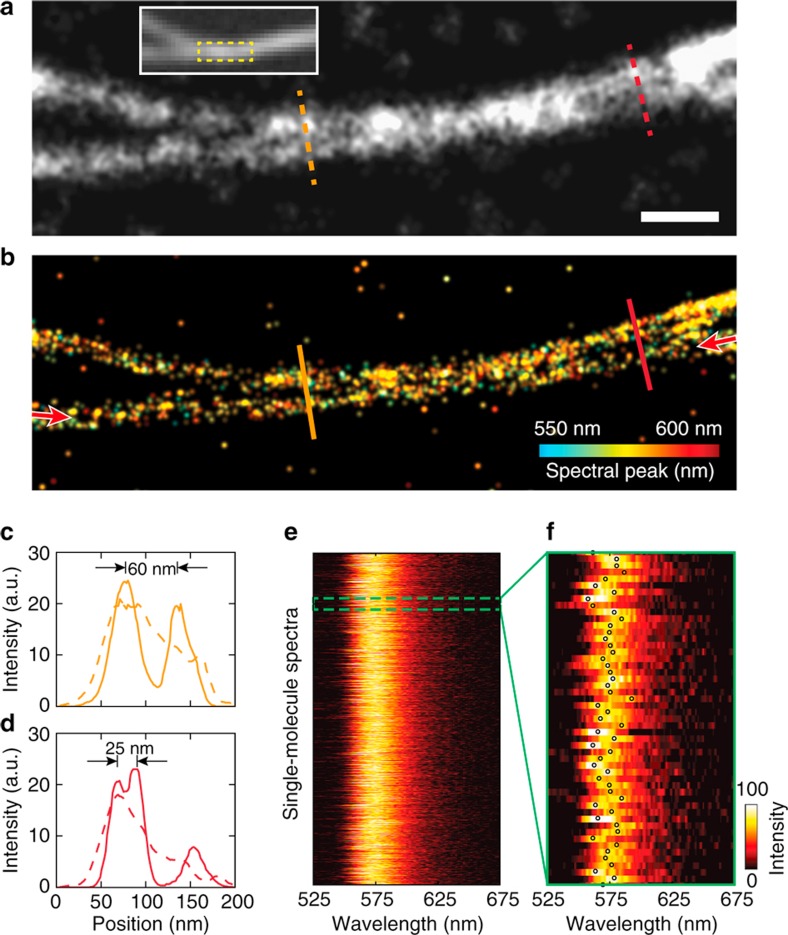
Figure 3
Imaging ex vivo microtubules using SPLM.
( a ) Conventional PLM image of two closely spaced microtubules of the square region in the wide-field fluorescence image, as shown in the inset. Scale bar, 200u2009nm. ( b ) SPLM image with spectral ...
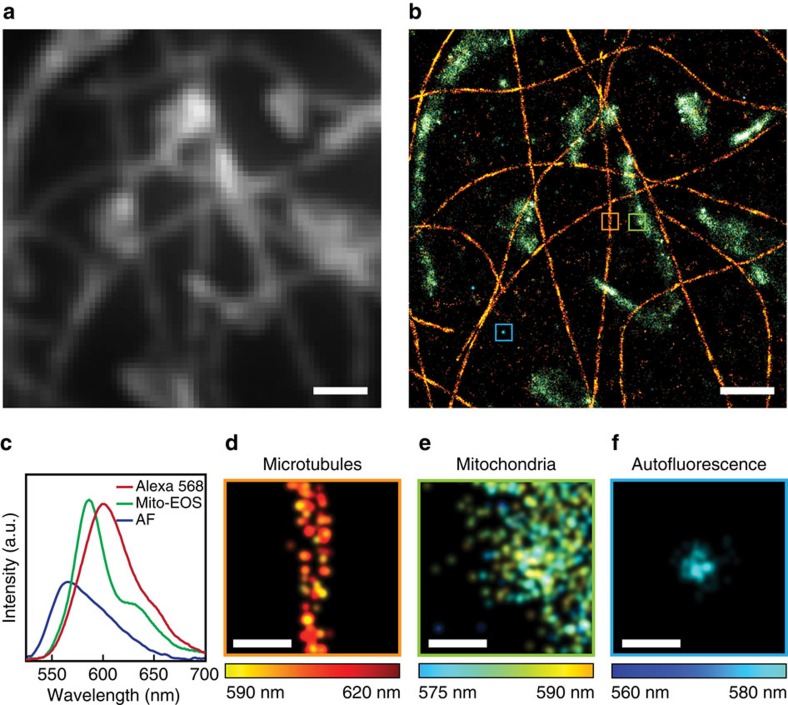
Figure 4
Multi-labelled SPLM imaging.
( a ) Wide-field fluorescence image of a dual-stained COS-7 cell. ( b ) The corresponding SPLM image. Scale bars, 1u2009u03bcm ( a , b ). ( c ) Fluorescence emission spectra of Alexa Fluor 568, Mito-E...
Figure images are served from the NIH/NLM PubMed Central Open Access Subset or Europe PMC; copyright remains with the publishers and authors.
💬 Discussion
0 commentsNo comments yet. Be the first to start a discussion!
Leave a Comment