Abstract
Neurexins are well-characterized presynaptic cell adhesion molecules that engage multifarious postsynaptic ligands and organize diverse synapse properties. However, the precise synaptic localization of neurexins remains enigmatic. Using super-resolution microscopy, we demonstrate that neurexin-1 forms discrete nanoclusters at excitatory synapses, revealing a novel organizational feature of synaptic architecture. Synapses generally contain a single nanocluster that comprises more than four neurexin-1 molecules and that also includes neurexin-2 and/or neurexin-3 isoforms. Moreover, we find that neurexin-1 is physiologically cleaved by ADAM10 similar to its ligand neuroligin-1, with ∼4-6% of neurexin-1 and ∼2-3% of neuroligin-1 present in the adult brain as soluble ectodomain proteins. Blocking ADAM10-mediated neurexin-1 cleavage dramatically increased the synaptic neurexin-1 content, thereby elevating the percentage of Homer1(+) excitatory synapses containing neurexin-1 nanoclusters from 40-50% to ∼80%, and doubling the number of neurexin-1 molecules per nanocluster. Taken together, our results reveal an unexpected nanodomain organization of synapses in which neurexin-1 is assembled into discrete presynaptic nanoclusters that are dynamically regulated via ectodomain cleavage.
🔬 Techniques
🔭 Microscopes
🧬 Organisms
💻 Software
✨ Fluorophores
🧪 Sample Preparation
🔬 Cell Lines
🏭 Microscope Brands
🧪 Reagent Suppliers
🔴 Lasers
📷 Detectors
🎨 Filters
💻 Software Details
💾 Data Repositories
🏛️ Research Organizations (ROR)
Affiliated research institutions:
📋 Methods
Generation of HA-Nrxn1 cKI mice
In generating HA-tagged neurexin-1 cKI mice, we aimed to (1) introduce a double HA tag (2xHA-tag) to allow the detection of the HA-epitope–tagged Nrxn1 including α-, β-, and -γ isoforms, and (2) to introduce a single loxP site into the reading frame to allow for Cre-mediated in-frame recombination resulting in truncated Nrxn1 proteins ( Fig. 1 A ). Transgenic mice were generated by homologous recombination in R1 embryonic stem (ES) cells ( Tabuchi et al., 2007 ) using the strategy outlined in Fig. S1 A that targets the last exon of Nrxn1 , exon-26 ( Tabuchi and Südhof, 2002 ; Treutlein et al., 2014 ). Briefly, immediately after the first two bases of Nrxn1 exon-26, in maintaining frame order, we introduced the coding sequence of two hemagglutinin motifs (amino acid sequence: YPYDVPDYAYPYDVPDYA) as well as the 34-bp sequence of a WT loxP site complemented by two additional bases to avoid a frame shift and a Spe I restriction site for cloning purposes. The amino acid sequence of the translated loxP site including the two additional bases and the SpeI site within the mutated full exon 26 reads as follows: ITSYSIHYTKLSTS. The second loxP site was introduced immediately downstream of the endogenous stop codon. Upon Cre/loxP-mediated recombination, the coding region now terminates in a stop codon shortening the translated loxP site into the sequence ITSYSIHYTKL. Since the transmembrane region is encoded by the sequence downstream of the introduced loxP site, Cre/loxP-mediated recombination will result in a truncated Nrxn1 protein lacking its membrane anchoring sequence and intracellular C-terminus. The 3′ loxP site is followed by a frt site–flanked neomycin resistance gene under control of the phosphoglycerate-kinase promoter, PGK-neo R , to allow for the selection of homologously recombined ES cells. The mutated Nrxn1 exon 26 and the selection cassette were both flanked by ∼6-kb homology regions, respectively. Additionally, upstream of the 5′ homology region, a diphtheria toxin minigene was inserted for negative selection. Electroporation into (129X1/SvJ x 129S1/Sv)F1- Kitl + -derived R1 ES cells, drug selection, and clone isolation were performed as previously described ( Nagy et al., 2006 ; University of Texas Southwestern Transgenic Facility, Dallas, TX). Positive ES clones were identified by Southern blotting and PCR genotyping. Blastocyst injection was performed by the Stanford Transgenic Facility, Stanford, CA. Chimeric offspring were bred to C57BL/6 mice to select for the recombined allele. Mutated mice were subsequently bred to Flp-deleter mice ( Rodríguez et al., 2000 ) for the removal of the frt-flanked selection cassette, Nrxn1 KI allele, and Cre-deleter mice ( Schwenk et al., 1995 ) generating the Nrxn1 truncated allele, Nrxn1 tr . Both deleter mouse lines were maintained on a C57BL/6 background (JAX stock #003800 [Flp-deleter] and #006054 [Cre-deleter]), and Nrxn1 cKI mice have been bred several rounds to C57BL/6 mice with the intention to remove the transgenic Flp- and Cre-alleles so that all experiments were performed on congenic backgrounds of at least 95% C57BL/6 unless noted differently. The HA-Nrxn1 cKI mouse line was deposited with the Jackson Laboratory Mouse Repository for distribution (B6.129- Nrxn1 tm3Sud /J, stock #021777). All mouse work was performed as prescribed by approved protocols at Stanford University. Mice were weaned at 20 d of age and housed in groups of up to five on a 12-h light/dark cycle with food and water ad libitum. Animals were kept in the Stanford Animal Housing Facility with all procedures conforming to the standards set by the National Institutes of Health Guidelines for the Care and Use of Laboratory Mice and approved by the Stanford University Administrative Panel on Laboratory Animal Care. The following primers were used for genotyping to discriminate between different alleles: MX10434, 5′-GCCTTGAGAGGGTGAACACTTTATTTGG-3′; MX10435, 5′-CCATTGGACTGTGCTGAGTTACTGATG-3′; and MX10472, 5′-TTTGCTTTATGAATGCGTGCGGTCCTCACC-3′. Oligonucleotide combinations MX10434/MX10435 were used to identify the presence of Nrxn1 wt (382 bp) and Nrxn1 KI (472 bp) alleles; MX10434/MX10472 identified the Nrxn1 tr (682 bp) allele. Survival analyses were performed by comparing the genotype distribution observed in litters resulting from Nrxn1 wt/tr x Nrxn1 wt/tr (het x het) crosses at either P1 or P21. Observed genotype distribution was compared with expected distribution based on Mendelian inheritance ( Kaeser et al., 2008 ). A chi-square test was used to determine whether the observed offspring ratio differed significantly from the expected ratio.
Show full methods section
Generation of HA-Nrxn1 cKI mice
In generating HA-tagged neurexin-1 cKI mice, we aimed to (1) introduce a double HA tag (2xHA-tag) to allow the detection of the HA-epitope–tagged Nrxn1 including α-, β-, and -γ isoforms, and (2) to introduce a single loxP site into the reading frame to allow for Cre-mediated in-frame recombination resulting in truncated Nrxn1 proteins ( Fig. 1 A ). Transgenic mice were generated by homologous recombination in R1 embryonic stem (ES) cells ( Tabuchi et al., 2007 ) using the strategy outlined in Fig. S1 A that targets the last exon of Nrxn1 , exon-26 ( Tabuchi and Südhof, 2002 ; Treutlein et al., 2014 ). Briefly, immediately after the first two bases of Nrxn1 exon-26, in maintaining frame order, we introduced the coding sequence of two hemagglutinin motifs (amino acid sequence: YPYDVPDYAYPYDVPDYA) as well as the 34-bp sequence of a WT loxP site complemented by two additional bases to avoid a frame shift and a Spe I restriction site for cloning purposes. The amino acid sequence of the translated loxP site including the two additional bases and the SpeI site within the mutated full exon 26 reads as follows: ITSYSIHYTKLSTS. The second loxP site was introduced immediately downstream of the endogenous stop codon. Upon Cre/loxP-mediated recombination, the coding region now terminates in a stop codon shortening the translated loxP site into the sequence ITSYSIHYTKL. Since the transmembrane region is encoded by the sequence downstream of the introduced loxP site, Cre/loxP-mediated recombination will result in a truncated Nrxn1 protein lacking its membrane anchoring sequence and intracellular C-terminus. The 3′ loxP site is followed by a frt site–flanked neomycin resistance gene under control of the phosphoglycerate-kinase promoter, PGK-neo R , to allow for the selection of homologously recombined ES cells. The mutated Nrxn1 exon 26 and the selection cassette were both flanked by ∼6-kb homology regions, respectively. Additionally, upstream of the 5′ homology region, a diphtheria toxin minigene was inserted for negative selection. Electroporation into (129X1/SvJ x 129S1/Sv)F1- Kitl + -derived R1 ES cells, drug selection, and clone isolation were performed as previously described ( Nagy et al., 2006 ; University of Texas Southwestern Transgenic Facility, Dallas, TX). Positive ES clones were identified by Southern blotting and PCR genotyping. Blastocyst injection was performed by the Stanford Transgenic Facility, Stanford, CA. Chimeric offspring were bred to C57BL/6 mice to select for the recombined allele. Mutated mice were subsequently bred to Flp-deleter mice ( Rodríguez et al., 2000 ) for the removal of the frt-flanked selection cassette, Nrxn1 KI allele, and Cre-deleter mice ( Schwenk et al., 1995 ) generating the Nrxn1 truncated allele, Nrxn1 tr . Both deleter mouse lines were maintained on a C57BL/6 background (JAX stock #003800 [Flp-deleter] and #006054 [Cre-deleter]), and Nrxn1 cKI mice have been bred several rounds to C57BL/6 mice with the intention to remove the transgenic Flp- and Cre-alleles so that all experiments were performed on congenic backgrounds of at least 95% C57BL/6 unless noted differently. The HA-Nrxn1 cKI mouse line was deposited with the Jackson Laboratory Mouse Repository for distribution (B6.129- Nrxn1 tm3Sud /J, stock #021777). All mouse work was performed as prescribed by approved protocols at Stanford University. Mice were weaned at 20 d of age and housed in groups of up to five on a 12-h light/dark cycle with food and water ad libitum. Animals were kept in the Stanford Animal Housing Facility with all procedures conforming to the standards set by the National Institutes of Health Guidelines for the Care and Use of Laboratory Mice and approved by the Stanford University Administrative Panel on Laboratory Animal Care. The following primers were used for genotyping to discriminate between different alleles: MX10434, 5′-GCCTTGAGAGGGTGAACACTTTATTTGG-3′; MX10435, 5′-CCATTGGACTGTGCTGAGTTACTGATG-3′; and MX10472, 5′-TTTGCTTTATGAATGCGTGCGGTCCTCACC-3′. Oligonucleotide combinations MX10434/MX10435 were used to identify the presence of Nrxn1 wt (382 bp) and Nrxn1 KI (472 bp) alleles; MX10434/MX10472 identified the Nrxn1 tr (682 bp) allele. Survival analyses were performed by comparing the genotype distribution observed in litters resulting from Nrxn1 wt/tr x Nrxn1 wt/tr (het x het) crosses at either P1 or P21. Observed genotype distribution was compared with expected distribution based on Mendelian inheritance ( Kaeser et al., 2008 ). A chi-square test was used to determine whether the observed offspring ratio differed significantly from the expected ratio.
Cell culture Primary neuronal culture
Hippocampal, olfactory bulb, and cortical neurons were cultured from newborn mice as described previously ( Maximov et al., 2007 ) with some modifications. Dissected hippocampi, olfactory bulbs, or cortices were digested for 20 min with 10 U/ml papain in Hank's buffered saline (HBS) in an incubator, washed with HBS, dissociated in plating media (MEM supplemented with 0.5% glucose, 0.02% NaHCO 3 , 0.1 mg/ml transferrin, 10% FBS, 2 mM L-glutamine, and 0.025 mg/ml insulin), and seeded on Matrigel (BD Biosciences) precoated coverslips placed inside 24-well dishes. The day of plating was considered as DIV0. After 24 h (DIV1), 95% of the plating medium was replaced with neuronal growth medium (Neurobasal-A medium supplemented with 2% B27 supplement and 0.5 mM L-glutamine). At DIV2–3 (for hippocampal and olfactory bulb cultures) or DIV3–4 (for cortical cultures), 50% of the medium was exchanged with fresh growth medium additionally supplemented with 4 µM AraC (Sigma-Aldrich) to restrict glial overgrowth. When applicable, lentivirus supernatants were always added on DIV3–4 following exchange of media. For long-term culture of neurons, 25% fresh media was added every 4–5 d starting from DIV7. Most imaging experiments used P0 pups from HA-Nrxn1 cKI mice. For biochemistry experiments, HA-Nrxn1 cKI cultures were prepared simultaneously from newborn HA-Nrxn1 cKI mice, and WT cultures were prepared from newborn CD1 mice. For select control experiments, cultures were also prepared from Nrxn1 cKO mice and Nrxn1/2/3 cKO mice ( Chen et al., 2017 ). For generation of cultures from P0 pups, gender was not taken into account. In general, pooling tissue from three to six mice in a given preparation was used to generate cultures. HEK293T cells WT HEK293T cells were maintained in DMEM supplemented with 10% FBS, penicillin, and streptomycin. For producing lentivirus, cells were transfected using the calcium phosphate method (as described below). Real-time quantitative RT-PCR (qRT-PCR) Brain tissue For qRT-PCR analysis, age-matched adult (10 wk old) males from the same litters were used and were either homozygous for the Nrxn1 WT locus (WT mice) or carried a single truncated allele, Nrxn1 wt/tr ( n = 4 per genotype). Mice were euthanized using isoflurane, and the entire was brain dissected and then collected in TRIzol reagent. RNA was isolated according to the manufacturer’s protocol (Invitrogen). RNA concentration was measured using an ND-1000 spectrophotometer (Thermo Fisher Scientific). Briefly, reactions were loaded onto an ABI7900 fast RT-PCR machine (Applied Biosystems) and run in triplicates with 100 ng RNA per run using VeriQuest Probe one-step qRT-PCR master mix with ROX (Affymetrix). Gene-specific qPCR assays were purchased from Integrated DNA Technologies, and mouse ACTB assay (4352933E) was purchased from Applied Biosystems. The following PrimeTime qPCR Assays (IDT) were used (shown as gene, primer1, probe, primer2): Nrxn1α, 5′-TCCTCTTAGACATGGGATCAGG-3′, 5′-CAACGGGATGGACGGTCAGGTA-3′, 5′-GTGTAGGGAGTGCGTAGTG-3′; Nrxn1β, 5′-TGGCCCTGATCTGGATAGTC-3′, 5′-ACCACATCCACCATTTCCAT-3′, 5′-AATCTGTCCACCACCTTTGC-3′; Nrxn2α/β, 5′-ATCATCACTTGGACACTCAGC-3′, 5′-CAGGAGGTCATCTGTGTTCTGGGTG-3′, 5′-ACAATGAGGGACAGCACC-3′; Nrxn2α, 5′-GTCAGCAACAACTTCATGGG-3′, 5′-CTTCATCTTCGGGTCCCCTTCCT-3′, 5′-AGCCACATCCTCACAACG-3′; Nrxn2β, 5′-CCACCACTTCCACAGCAAG-3′, 5′-GGACCACATACATCTTCGGG-3′, 5′-CTGGTGTGTGCTGAAGCCTA-3′; Nrxn3α/β, 5′-CCTTTGTCCTTTCCTCCGATG-3′, 5′-TTTTCCTGCAGCCACTCCTCTACG-3′, 5′-CACTGATAATGAACGCCTCCA-3′; Nrxn3α, 5′-GGGAGAACCTGCGAAAGAG-3′, 5′-CTGCCGTCATAGCTCAGGATAGATGC-3′, 5′-ATGAAGCGGAAGGACACATC-3′; Nrxn3β, 5′-CACCACTCTGTGCCTATTTC-3′, 5′-TCTATCGCTCCCCTGTTTCC-3′, 5′-GGCCAGGTATAGAGGATGA-3′; Nlgn1, 5′-GGTTGGGTTTGGTATGGATGA-3′, 5′-TGAGGAACTGGTTGATTTGGGTCACC-3′, 5′-GATGTTGAGTGCAGTAGTAATGAC-3′; Nlgn2, 5′-CCGTGTAGAAACAGCATGACC-3′, 5′-TCAATCCGCCAGACACAGATATCCG-3′, 5′-TGCCTGTACCTCAACCTCTA-3′; Nlgn3, 5′-CACTGTCTCGGATGTCTTCA-3′, 5′-CCTGTTTCTTAGCGCCGGATCCAT-3′, 5′-CCTCTATCTGAATGTGTATGTGC-3′; LRRTM2, 5′-GGCCACTTGAAATGTAAGCC-3′, 5′-TGCAGCCTCCAATGTGCTCAGAA-3′, 5′-CACTGCGTTGAGTCTGACAA-3′; LRRTM3, 5′-CATATGCCAGAAAGGTTGACAC-3′, 5′-AGGCTCCAGGGAATGTGAGATACCT-3′, 5′-GAGATGCTGCTGAACGGAA-3′; LRRTM4, 5′-GAAATAGCACCAGAAACACACTC-3′, 5′-ACGGAAACCCATCCTTTGTCATCCA-3′, 5′-GACCAAATAAGAAGAAAGCTGAGAG-3′; Lphn1, 5′-GACTGATGCTCTGACTCATGT-3′, 5′-TGGGCACACGAAGATGTAAGGGAC-3′, 5′-CTGGAACCTACAAATACCTGGA-3′; Lphn2, 5′-CTCGTGGTGGATATTGTGGTT-3′, 5′-TGACCCTGCCCAAGTGCCTAC-3′, 5′-TTACGGTATTCCCTGGAGTTTG-3′; and Lphn3, 5′-AGAAACATCCAGGTGAAGGC-3′, 5′-AAGAAATGCAAAAGAGCCGCGAACA-3′, 5′-GAATCAACAGAACCGACCAAC-3′. The Nrxn1-HA assay was designed to identify the presence of the mutated alleles ( Nrxn1 KI and Nrxn1 tr ). For this purpose, in the assay the sense oligo (5′-ACAGATGACATCCTTGTGGC-3′) and the probe (5′-ACATTGACCCCTGTGAGCCGAG-3′) are both located in the proceeding exon, while the antisense oligo (5′-GTTATAGCATAGTCAGGTACGTCG-3′) is located in the mutated sequence of exon 26 including parts of the HA coding sequence and the first five bases of the loxP site. The relative transcript level of the target mRNA in each sample was calculated by normalization of cycle threshold (CT) values to the reference mRNA (β-actin) using the following equation: V = 2 CT[reference] /2 CT[target] ; V is the relative value of target gene normalized to the reference. Primary neurons RNA was isolated from DIV12 neurons that had been previously infected with lentivirus on DIV3–4 to allow Cre-mediated gene deletion or knockdown of ADAM10 using shRNA (see below). RNA was isolated using the PrepEase RNA spin kit according to the manufacturer’s instructions (Affymetrix). Nrxn1, Nrxn3, Lphn1, and Nlgn1 probes are described above. A prevalidated mouse ADAM10 assay (assay ID: Mm.PT.58.14225600) was obtained from Integrated DNA Technologies. For each reaction, 1 μl of RNA was run in triplicate using VeriQuest Probe one-step qRT-PCR master mix with ROX (Affymetrix). Reactions were loaded onto a QuantStudio3 Real-Time PCR machine (Thermo Fisher Scientific). The relative transcript level of the target mRNA in each sample was calculated as described above.
Lentivirus production and infection
Recombinant lentiviral particles were produced in HEK293T cells by cotransfecting cells with long terminal repeat (LTR) containing vector and helper plasmids (pRSV-REV, pMDLg/gRRE, and pVSVG) using calcium phosphate. Media were exchanged 1 h before transfection and included 25 µM chloroquine diphosphate. Per 75 cm 2 of cells, 0.5 ml of 250 mM CaCl 2 containing molar equivalents of DNA (12 µg of LTR-containing vector, 3.9 µg pRSV-REV, 8.1 µg pMDLg/gRRE, and 6.0 µg pVSVG) was added dropwise to an equal volume of 2X-HBS (0.4 M NaCl, 10 mM KCl, 1.5 mM Na 2 HPO 4 , 0.2% glucose, and 38.4 mM HEPES, pH 7.05) under vigorous mixing, incubated for 20 min at room temperature, and added dropwise to the cells. 16–20 h following transfection, cells were washed with plain DMEM and replaced with neuronal growth media lacking AraC. After 24 h, media containing lentiviral particles were cleared by centrifugation (1,500 × g , 10 min), aliquoted, and snap-frozen. Neuronal cultures were infected with lentivirus on DIV3 or 4 by adding 25–30 µl of viral supernatant per well of a 24-well plate. For generating cKO cultures, matched sets of lentiviruses were produced using LTR-containing vectors that included Cre or mutant ΔCre (inactive) fused to EGFP and driven by the human synapsin-1 promoter ( Kaeser et al., 2011 ). For gene knockdown, lentiviruses were produced using lentiviral constructs containing shRNAs against mouse ADAM10 purchased from the MISSION shRNA Library (Sigma-Aldrich). Three different shRNAs were used for ADAM10 knockdown in the pLKO.1 lentivirus expression vector, including ADAM10 shRNA 1 (The RNAi Consortium [TRC] No.: TRCN0000031844; sequence: 5′-CCGGGCAGAGAGATACATTAAAGATCTCGAGATCTTTAATGTATCTCTCTGCTTTTTG-3′), ADAM10 shRNA 2 (TRC No.: TRCN0000031847; sequence: 5′-CCGGCAGCTCTATATCCAGACAGATCTCGAGATCTGTCTGGATATAGAGCTGTTTTTG-3′), and ADAM10 shRNA 3 (TRC No.: TRCN0000031848; sequence: 5′-CCGGCCAGGAGAGTCTAAGAACTTACTCGAGTAAGTTCTTAGACTCTCCTGGTTTTTG-3′). All other viruses were generated using a similar lentiviral backbone as Cre, which contains the human synapsin-1 promoter to drive gene expression in neurons (described further below). For ADAM10 WT and mutant overexpression, viruses were prepared either containing no insert (control), WT ADAM10 (A10-wt), ADAM10-E384A (A10-E384A), or ADAM10 lacking its prodomain and metalloprotease domain (A10-ΔPro/MP).
Electrophysiology
For electrophysiology recordings, hippocampal neurons were prepared from newborn Nrxn1 cKO or HA-Nrxn1 cKI mice. Cultures were infected with lentiviruses carrying Cre or mutant ΔCre (inactive) fused to EGFP on DIV3. Culture coverslips were superfused with artificial cerebrospinal fluid (ACSF) solution (in mM): 120 NaCl, 2.5 KCl, 1 NaH 2 PO 4 , 26.2 NaHCO 3 , 2.5 CaCl 2 , 1.3 MgSO 4 •7H 2 O, and 11 D-glucose, ∼290 mOsm. Miniature excitatory postsynaptic currents (mEPSCs) were recorded with an internal solution containing (in mM): 117 Cs-methanesulfonate, 15 CsCl, 8 NaCl, 10 TEA-Cl, 0.2 EGTA, 4 Na 2 -ATP, 0.3 Na 2 -GTP, and 10 HEPES, pH 7.3, with CsOH (∼300 mOsm). mEPSCs were recorded in ACSF containing 0.5 µM tetrodotoxin (TTX) and 100 µM picrotoxin. Miniature events were handpicked and analyzed in Clampfit 10 (Molecular Devices) using template matching. Synaptic currents were monitored with a Multiclamp 700B amplifier (Molecular Devices). Data were collected at 10 kHz and filtered with a low-pass filter at 2 kHz. For all experiments, the experimenter was blind to the recording condition.
Immunocytochemistry
For live surface-labeling experiments, primary neurons were first washed at room temperature once with a HEPES bath solution, which contained the following (in mM): 140–150 NaCl, 4–5 KCl, 2 CaCl 2 , 1 MgCl 2 , 10 glucose, and 10 HEPES, with pH adjusted to 7.4 with NaOH, and osmolarity of 300 mOsm. For conventional fluorescence imaging, cultures were then incubated at room temperature for 20 min with purified mouse anti-HA monoclonal antibody (1:250; anti-HA.11; BioLegend) diluted in HEPES bath solution. For STORM imaging experiments, cultures were incubated with the same antibody dye labeled with 405–647 (1:250) in HEPES bath solution at room temperature for 20 min. For double-labeling Nrxn1 nanoclusters with markers for synapse activity, dye-labeled anti-HA 405–647 was co-incubated with either anti-GluA1 (PC246; Calbiochem) at 1:10 or an antibody recognizing the luminal domain of synaptotagmin-1 (105103; Synaptic Systems) at 1:100 for 20 min at room temperature. Cultures were then gently washed three times with HEPES bath solution, followed by fixation for 20 min at room temperature with 4% (wt/vol) PFA. Following fixation, cultures were washed three times with Dulbecco's PBS (DPBS). For surface-labeling experiments to be used for conventional imaging, cultures were blocked for 1 h at room temperature with antibody dilution buffer (ADB) without Triton X-100(−), which contains 5% normal goat serum diluted in DPBS. Cells were then labeled with Alexa Fluor–conjugated secondary antibodies (1:1,000; Invitrogen) diluted in ADB(−) for 2 h at room temperature. Cells were washed and then permeabilized and blocked for 1 h with ADB with Triton X-100(+), which contains 0.2% Triton X-100 and 5% normal goat serum diluted in DPBS. Nonsurface primary antibodies were diluted in ADB(+), and cells were incubated overnight at 4°C. Cultures were washed three times and then incubated with either Alexa Fluor–conjugated secondary antibodies (1:1,000; Invitrogen) or STORM secondary antibodies (1:250; described below) in ABD(+) for 2 h. Following three washes, coverslips for conventional imaging were inverted onto glass microscope slides with Fluoromount-G mounting media (Southern Biotech). For STORM imaging, samples were stored in the dark at 4°C until further processing, for no longer than 1 wk until downstream processing. For non–surface-labeled stains, cultures were first washed once with DPBS followed by a 20-min fixation at room temperature with 4% (wt/vol) PFA. Following fixation, cultures were washed three times with DPBS. For stronger fixation (as used for Fig. S2, F–J), cultures were incubated with 3% PFA and 0.1% glutaraldehyde for 20 min, followed by treatment with sodium borohydride (1 mg/ml, 12-min incubation) to quench autofluorescence. Cultures were incubated for 1 h with ADB(+), followed by overnight incubation at 4°C with antibodies diluted in ADB(+). Coverslips were washed three times and then incubated for 2 h with either Alexa Fluor–conjugated secondary antibodies (1:1,000; Invitrogen) or STORM secondary antibodies (1:250) in ABD(+). Coverslips were further processed as described above for surface-labeled specimens. The antibodies used for conventional imaging included the following: rabbit anti-HA (1:250; #3724; Cell Signaling), mouse anti-HA monoclonal antibody (1:1,000 for prefixed; anti-HA.11; BioLegend), rabbit anti-Homer1 (1:500; 160003; Synaptic Systems), guinea pig anti-Homer1 (160004), rabbit anti-vGluT1 (1:1,000; YZ6089; TCS), rabbit anti-synapsin (1:500; E028; TCS), guinea pig anti-vGluT1 (1:500; AB5905; Millipore), rabbit anti-VGAT (1:500; AB5062P; Millipore), chicken anti-MAP2 (1:1,000; CPCA-MAP2; Encor), rabbit anti–Munc13-1 (1:500; 126103; Synaptic Systems), and rabbit anti-RIM1/2 (1:500; 140203; Synaptic Systems). The antibodies used for STORM imaging included the following: rabbit anti–pan-neurexin (1:250; Af870; Frontier Institute), rabbit anti-Piccolo (1:200; 142003; Synaptic Systems), rabbit anti-Bassoon (1:200; 141003; Synaptic Systems), mouse anti-Homer1 (1:500; 160011; Synaptic Systems), and rabbit anti-Homer1 (1:500; 160003; Synaptic Systems). For STORM imaging, neurexin-1–HA or pan-neurexins were directly labeled with mouse HA and rabbit anti–pan-neurexin (1:250; Af870; Frontier Institute) that had been preconjugated with 405–647 dye pairs (see below). Remaining antibodies used for STORM were recognized by dye-labeled secondary antibodies (described below). For conventional microscopy ( Figs. 2 , S1, S3, and S5), confocal images were acquired at room temperature using an inverted Nikon A1 Eclipse Ti confocal microscope (Nikon) equipped with a 60× objective (Apo, NA 1.4) and operated by NIS-Elements AR acquisition software. Images were taken at 1,024 × 1,024 pixels with a z-stack distance of 0.5 µm. Images were acquired sequentially in order to avoid bleed-through between channels. Imaging parameters (i.e., laser power, photomultiplier gain, scan speed, etc.) were optimized to prevent pixel saturation and kept constant for all conditions within the same experiment. Images were analyzed using NIS-Elements Advanced Research software (Nikon). Excitatory synapse quantification For Fig. S3, three or four independent cultures were prepared, and separate wells were infected with lentivirus carrying Cre or ΔCre. At DIV14, cultures were fixed and stained as described above for either vGluT1, total HA, Homer1, and MAP2 (for Nrxn1 cKI) or just MAP2 and vGluT1 (for Nrxn1 cKO). For Fig. S5, J–R, DIV10 HA-Nrxn1 cKI hippocampal neurons were incubated for 48 h with GI250423X followed by fixation and staining of vGluT1, MAP2, and Homer1 on DIV12. For all experiments, 9–10 neurons were blindly selected for both Cre and ΔCre groups per culture. Neurons were always confirmed to be healthy (i.e., continuous processes) and have pyramidal morphology by viewing the MAP2 staining. General Analysis was performed with NIS-Elements, and binaries were generated following background subtraction applied equally to groups being compared and imaged on the same day. Binary operations were used to distinguish Homer1 and vGluT1 puncta associated with MAP2. Two regions of interest were blindly drawn on secondary and tertiary dendrites of imaged pyramidal neurons. Quantification of puncta density, area, and intensity was averaged per culture before statistical analysis. Sample preparation, imaging, and analysis for STORM Tissue preparation Hippocampal tissue slices were prepared for STORM imaging following a modified protocol described previously ( Dani et al., 2010 ). Specifically, mouse brains that have been perfusion fixed with 4% PFA (Electron Microscopy Sciences) were cryo-protected by immersion in 30% sucrose (Sigma-Aldrich) overnight and embedded in a 2:1 mixture of 30% sucrose:TissueTek OCT Compound (Sakura). Frozen tissue blocks were cut into 10-µm sections on a cryostat and collected on glass slides (Thermo Fisher Scientific). Sections were blocked with 5% BSA (Jackson ImmunoResearch) in 1× DPBS and incubated with anti-HA tag (HA; BioLegend) antibody labeled with Alexa Fluor 405 and Alexa Fluor 647 (Thermo Fisher Scientific) dyes following previously described protocols ( Bates et al., 2007 ) for 30 min at room temperature in 5% BSA in 1× DPBS and washed three times for 15 min each with 1% BSA in DPBS. Sections were then permeabilized with 0.1% wt/vol saponin (Sigma-Aldrich) in 5% BSA in 1× DPBS for 30 min and stained overnight at 4°C in 5% BSA in 1× DPBS with antibodies against Homer1 (1:400; Synaptic Systems), Piccolo (1:400; Synaptic Systems), or Bassoon (1:400; Enzo Life Sciences). After washing three times with 1% BSA in PBS, samples were stained for 2 h at room temperature with appropriate secondary antibodies (Jackson ImmunoResearch) labeled with Alexa Fluor 647 and Cy3 (Invitrogen) in 5% BSA in 1× DPBS, and washed three times with 1% BSA in 1× DPBS. Sections were then immediately imaged. Imaging buffer and sample mounting The STORM imaging buffer was prepared with 100 mM cysteamine (Sigma-Aldrich), 5% wt/vol D-glucose (Sigma-Aldrich), 0.8 mg/ml glucose oxidase (Sigma-Aldrich), and 40 µg/ml catalase (Sigma-Aldrich) in 1× DPBS. For tissue sections, 100 µl imaging buffer was dropped onto glass slides holding the cryosection, and covered with a #1.5 rectangular glass coverslip (22 mm × 30 mm; Thermo Fisher Scientific). Excess imaging buffer was wicked away, and the sample was sealed using nail polish. For cultured neuron sections, 150 µl imaging buffer was first deposited into an imaging chamber before the sample coverslip was inverted over the chamber and pressed down firmly before sealing with nail polish.
STORM setup
STORM imaging experiments were conducted on a custom-built Nikon Eclipse-Ti inverted microscope with illumination channels at 405 nm (OBIS 405-LX; Coherent), 460 nm (Sapphire 460–10; Coherent), 488 nm (Genesis MX488-1000 STM; Coherent), 561 nm (Sapphire 561–200 CW CDRH; Coherent), and 647 nm (F-04306–113; MPB Communications). Lasers were introduced through the backport of the microscope, passing through a ZT405/488/561/647/752RPC (Chroma) dichroic mirror and a ZET405/488/561/647–656/752 penta-band notch (Chroma) emission filter. A translation stage allowed the incident beams to be directed at low incidence angles to illuminate only fluorophores near the coverglass (i.e., within ∼1–2 µm of the coverglass). For 3D imaging, a Roper Scientific Dual View system was inserted between the microscope body and the EMCCD camera (iXon; DU-897E-CSO-#BV; Andor), where a 1-m focal length cylindrical lens was inserted in place of a beam-splitter. Focus was maintained via a custom-built feedback system in which an 850-nm infrared laser was directed into the objective back aperture, and its reflection from the glass/liquid interface was imaged onto a quadrant photodiode, driving a piezo objective nanopositioner (Nano F-100; Madcity Labs).
STORM imaging and analysis
For two-color STORM imaging, the 405- and 561-nm lasers were used to activate the corresponding Alexa Fluor 405–Alexa Fluor 647 or Cy3–Alexa Fluor 647 dye pair, and the 647-nm laser was used to both excite Alexa Fluor 647 fluorophores and switch them into the dark state. STORM movies were acquired at 60 Hz until most dyes were photobleached within the field of view. During acquisition, the power of the activation lasers (405 nm and 561 nm) was gradually adjusted so that only a small subset of fluorophores was activated in any frame, allowing individual activated molecules to be imaged and localized, and the two-color channels were roughly even in their activation. The 647-nm laser was maintained at ∼80 mW throughout the experiment, while the 405-nm and 561-nm lasers were ramped up to a maximum of 2 mW and 1 mW, respectively. The illumination lasers were either mechanically or digitally shuttered in four-frame events consisting of one frame of activation laser (405 or 561 nm) and three frames of imaging laser (647 nm), and alternating in the activation channels (i.e., between 405 nm and 561 nm) for four frames in each channel. STORM movies were automatically analyzed using custom-written software implementing 3D-DAOSTORM ( Babcock et al., 2012 ), generating molecule lists for each STORM image that could be used for subsequent analyses. In brief, the x and y positions of the fluorophores are determined from the centroid positions of their images, and the z position of the fluorophores is determined from the ellipticity of their images, as previously described ( Rust et al., 2006 ; Huang et al., 2008 ). Cross-talk between color channels was subtracted using methods previously described for activator-based multi-color STORM ( Dani et al., 2010 ). For three-color imaging, a conventional image was acquired using the 488-nm laser to excite Alexa Fluor 488, labeling Homer1, in addition to the two-color STORM image. Synapse selection To select synapses in two-color STORM images, homer localizations were first clustered through an implementation of DBSCAN with a distance of 80 nm and a minimum of 5 points per assigned cluster. To be designated as a synapse, a homer cluster must contain at least 100 localizations, and the spatial distribution of localizations in the cluster must have two dimensions as least twice as large as the third dimension. Synapses were then defined as the homer cluster, as well as all neurexin localizations within 500 nm of the edge of the homer cluster. STORM localizations from synapses were plotted based on their coordinates to create STORM images of individual synapses, which were rotated such that the trans-synaptic axis aligned along the x axis, with the synaptic protein signal, e.g., homer, toward the negative side. By defining the origin as the centroid of the homer signal, both trans-synaptic and radial distances (defined as R = y 2 + z 2 ) could be calculated. To determine the normalized radial distance R Norm , a radius was determined for each synapse, R 95 , which defined a ring encompassing 95% of homer localizations. R Norm could then be calculated as a simple ratio of the two values: R N o r m = R / R 95 . Neurexin and homer levels were calculated from cross-talk–subtracted localization counts for each synapse. The number of neurexin clusters per synapse was determined by applying an implementation of DBSCAN to identify and count the number of neurexin clusters in each synapses. HA antibodies per cluster were estimated by first determining the average number of localizations per isolated antibody, L A B , and then dividing the number of localizations per neurexin cluster, L N x n , by the value of L A B . Neurexin and homer areas were calculated via a coarse convex hull method, where 2D bins of 35 × 35 nm were first defined on the geometric plane parallel to the synaptic face, and centered around the centroid of the homer cluster. The cluster area was then defined as the sum of the area of bins containing at least two STORM localizations (to eliminate spurious outliers) after cross-talk subtraction. Two alternative methods of area measurements (i.e., convex hull area and radius of gyration based on the localizations) were also compared, and produced results with similar trends to those obtained from the coarse convex hull quantification. Although the same trends were observed from all three methods, quantitative numbers differed (Fig. S1 P), likely because these methods have different sensitivities to outliers and holes (convex hull is more sensitive to outliers than coarse convex hull and radius gyration, and convex hull and radius gyration do not detect holes unlike coarse convex hull). For three-color imaging experiments, synapses were defined by the area of homer puncta in the conventional image. The degree of cluster volume overlap was calculated for the two neurexin antibody labels using two methods. The first method is based on the coarse convex hull method described above but extended to 3D to determine cluster volume. The overlap fraction is calculated as the number voxels containing STORM localizations in both antibody channels divided by the total number of voxels that contain STORM localizations regardless of antibody channels. The second method is the convex hull method. The overlap fraction is calculated as the volume of overlapping region covered by the convex hulls of both antibody channels divided by the volume of the entire region covered by two convex hulls. The STORM resolution was determined by measuring x/y/z localization SD for 100 isolated antibodies adhered to the surface of a coverslip and multiplying the average SD by 2.35 to obtain full width at half maximum (FWHM). We obtained FWHM values of 30 nm and 28 nm for x and y dimensions, respectively, and 67 nm for z (axial resolution).
Generation of expression vectors
Lentiviral vectors for expression of Cre and ΔCre (truncated, inactive) recombinase driven by the human synapsin-1 promoter have been described previously ( Kaeser et al., 2011 ). For all other experiments using the lentiviral backbone with a human synapsin-1 vector, an empty vector was used as a control. ADAM10 shRNA expression constructs were in the pLKO.1 lentivirus expression vector (Sigma-Aldrich), including ADAM10 shRNA 1 (TRC No.: TRCN0000031844), ADAM10 shRNA 2 (TRC No.: TRCN0000031847), and ADAM10 shRNA 3 (TRC No.: TRCN0000031848). To generate ADAM10 expression constructs, the mouse ADAM10 ORF was purchased from GE Dharmacon (OMM5895-202525673).
In-Fusion cloning
(Clontech) was used to clone WT ADAM10 and mutants (according to the manufacturer’s instructions). A catalytically inactive version of ADAM10 was generated by mutating Glu→Ala at position 384 ( Lammich et al., 1999 ). Another dominant-negative version of ADAM10 was generated by deleting the prodomain and metalloprotease domain as previously reported ( Seegar et al., 2017 ). A Flag epitope tag (DYKDDDDK) was included at the 3′ end of all ADAM10 constructs. Due to toxicity of the ADAM10 constructs when expressed in normal copy number Escherichia coli, we used Copy Cutter (Lucigen) low-copy number, inducible E. coli for successful cloning and generation of ADAM10 plasmids.
Immunoprecipitation
To remove debris, media from neurons were centrifuged at 3,000 rpm for 5 min. Media was carefully transferred to a new tube and a final concentration of 0.5× cOmplete ULTRA protease inhibitor cocktail (Sigma-Aldrich), and 2 mM EDTA was added. Then 30 µl of prewashed 1:1 HA agarose beads (Sigma-Aldrich) was added, and samples were rotated overnight at 4°C. Beads were washed one or two times with ice-cold DPBS before elution with 2× Laemmli buffer containing fresh DTT (100 mM) at 60°C for 10 min. Cell lysis Primary neurons plated in 24-well plates were isolated with 50–80 µl of complete radioimmunoprecipitation assay (RIPA) lysis buffer (cRIPA) per well with 350 µl modified cRIPA containing 150 mM NaCl, 5 mM EDTA, 1% Triton X-100, 0.1% SDS, and 25 mM Tris-HCl, pH 7.6. cRIPA also contained freshly added 1× cOmplete ULTRA protease inhibitor cocktail (Sigma-Aldrich). Lysates were incubated on ice for 20 min and then clarified by centrifugation for 20 min at 13,000 rpm at 4°C. The same volume of lysis buffer was always used for wells being compared within a given experiment. Lysates were stored at −80°C until further processing.
Immunoblotting
Proteins were separated by SDS-PAGE using 4–20% MIDI Criterion TGX precast gels (Bio-Rad). Proteins were transferred onto nitrocellulose membranes for 10 min at 2.5 V using the Trans-blot turbo transfer system (Bio-Rad). Membranes were blocked in 5% milk diluted in PBS or TBS for 1 h at room temperature. Membranes were then incubated with primary antibodies diluted in TBST (containing 0.1% Tween-20) overnight at 4°C. The following antibodies were used: HA monoclonal antibody (1:1,000; anti-HA.11; BioLegend), CASK (1:1,000; 75–000; Neuromab), PSD-95 (1:500; 73–028; Neuromab), synapsin (1:500; E028; TCS), CamKII (1:1,000 MAB8699; Millipore), synaptophysin (1:1,000; MAB5258; Millipore), Mint1 (1:500; P730; TCS), SNAP-25 (1:500; P913; TCS), Nlgn1 (1:1,000; 4C12; Synaptic Systems), GluA1 (1:1,000; Ab1504; Millipore), syntaxin-1 (1:500; 438B; TCS), Tau (1:1,000; MAB361; Millipore), ApoE (1:1,000; 701241; Thermo Fisher Scientific), HSC70 (1:1,000; 903A; TCS), Grp78 (1:1,000; Abcam), α-synuclein (1:1,000; Q698; TCS), pan-neurexin (1:500; Sudhof; A473), SynCAM4 (1:500; 75–247; Neuromab), GDI (1:2,000; 130001; Synaptic Systems), CASPR2 (1:500; 73–075; Neuromab), actin (1:2,000, A1978; Sigma-Aldrich), and Munc18 (1:1,000; 610337; BD Biosciences). Actin was used as a loading control for protein quantifications. Combinations of the following IRDye secondary antibodies were used (1:10,000 in TBST with 5% milk): IRDye 800CW donkey anti-mouse (926–32212), IRDye 680LT donkey anti-mouse (926–68022), IRDye 800CW donkey anti-rabbit (926–32213), and IRDye 680LT donkey anti-rabbit (926–68023), from LI-COR. Detection of the signal was obtained by Odyssey CLx imaging systems (LI-COR). Pseudo colors were applied to the signals, and quantification was performed using Image Studio 5.2 free software. Studying processing in neurons At DIV10, the media of hippocampal neurons or cortical neurons from HA-Nrxn1 cKI cultures were swapped with media from age-matched WT cultures supplemented with DMSO (0.1%), GM6001 (10 µM), TAPI-2 (10 µM), GW280264X (10 µM), GI254023X (20 µM), SB-3CT (30 µM), or C3 (1 µM). At 48 h after swap, media were clarified by centrifugation at 3,500 rpm for 5 min, supplemented with protease inhibitors, and incubated overnight with 30 µl of 1:1 HA-agarose beads. Cells were lysed using RIPA-containing protease inhibitor cocktail. Following two washes with cold DPBS, immunoprecipitates were eluted with 50 µl of 2× Laemmli buffer containing DTT. For ADAM knockdown and overexpression experiments, the media of HA-Nrxn1 cKI hippocampal neurons (DIV10) were replaced with media from age-matched WT cultures. Media and cells were harvested on DIV12 and processed similar to other experiments. For analysis of activity-dependent changes in processing, WT and HA-Nrxn1 cKI hippocampal neurons were prepared. On DIV10, media was swapped from WT neurons onto Nrxn1 cKI neurons and included 0.1% DMSO, picrotoxin (50 µM), or TTX (1 µM). Media and cell lysate were harvested 48 h later. Fractionation To maximize protein isolation, the average mass of dissected brain tissue (i.e., hippocampus, cortex, cerebellum, olfactory bulb, and brainstem) was predetermined for three male HA-Nrxn1 cKI mice (P56). Based on these masses, the volume used for tissue homogenization was at 40 mg/ml of buffer. For fractionation, six male HA-Nrxn1 cKI mice were euthanized using isoflurane, and fresh brain tissue was dissected on ice including the hippocampus, cortex, cerebellum, olfactory bulb, and brainstem. Until homogenization, tissue was stored in cold homogenization buffer containing 1× cOmplete ULTRA protease inhibitor cocktail (Sigma-Aldrich) and 2 mM EDTA. Tissue from one hemisphere was dounce homogenized in RIPA containing protease inhibitor cocktail (cRIPA). This tissue was incubated on ice for ≥20 min and then clarified at 14,000 rpm for 20 min at 4°C. The supernatant was saved as the total particular fraction (H). Tissue from the other hemisphere was dounce homogenized in the same volume of ice-cold ACSF (containing in mM: 126 NaCl, 2.5 KCl, 1 NaH 2 PO 4 , 26.2 NaHCO 3 , 2.5 CaCl 2 , 1.3 MgSO 4 •7H 2 O, 11 D-glucose, and ∼290 mOsm) with protease inhibitors (including 2 mM EDTA) for 10 strokes. Lysates were initially cleared at 13,000 rpm for 20 min (spin 1). The crude supernatant was saved, and the pellet was resuspended in equal volume as starting material of cRIPA and incubated on ice for ≥20 min. Lysates were clarified at 13,000 rpm for 20 min (spin 2), and the supernatant was saved as total particular fraction (P). The supernatant from spin 1 was further subjected to clarification for 2 h at 165,000 × g (spin 3). The supernatant from spin 3 was saved as total soluble fraction (S). For comparing the amount of Nrxn1α and Nlgn1 in particulate and soluble fractions, a bicinchoninic acid assay was performed (Thermo Fisher Scientific) according to the manufacturer’s instructions. The particulate fractions were adjusted to 2 µg/µl, and soluble fractions from paired samples were adjusted with similar volumes. Proteins detected in the S fraction were much less abundant than H/P fractions, and were therefore loaded at 10 ( Fig. 8 C ) or 20 times ( Fig. 8, D and E ) more than their corresponding H or P fractions. Therefore, final measurements for Nrxn1α and Nlgn1 in the soluble fraction were divided by 20 to estimate the percentage of soluble protein relative to particular protein.
Quantification and statistical analysis
Quantification has been described in the respective Materials and methods details sections, and statistical details are provided in the figure legends. Statistical significance between various conditions was assessed by determining P values (95% confidence interval). For animal survival analysis and quantitative immunoblotting experiments, statistical analysis was performed using GraphPad Prism 6 software. Blot intensity quantification was performed using Image Studio Lite. Graphs depict means ± SEM. Statistical analyses for STORM images, including rank-sum tests for radial displacement and two-sample t tests for other quantifications, were performed in MATLAB. Values were plotted as means ± SEM. Online supplemental material Fig. S1 shows the targeting strategy, qRT-PCR validation results, and control data for the HA-Nrxn1 cKI mouse, showing that the truncated mRNA does not undergo nonsense-mediated decay and that HA-tagged Nrxn1 traffics to synapses. Fig. S2 shows that the Nrxn1 nanoclusters are not artifacts due to the fixation method used or the knocked-in HA-epitope. Fig. S3 shows that either truncation or loss of Nrxn1 does not alter excitatory synapse number or basic properties of synaptic transmission. Fig. S4 shows that synaptic activity does not affect the content of Nrxn1 nanoclusters or ectodomain processing, but does shift the position of nanoclusters within the synaptic cleft. Fig. S5 shows that ADAM10 shRNA and overexpression of a dominant-negative ADAM10 mutant reduce Nrxn1 ectodomain cleavage. Moreover, Fig. S5 shows that ADAM10 is not a significant regulator of excitatory synapse number in developing hippocampal cultures.
Online supplemental material Fig. S1 shows the targeting strategy, qRT-PCR validation results, and control data for the HA-Nrxn1 cKI mouse, showing that the truncated mRNA does not undergo nonsense-mediated decay and that HA-tagged Nrxn1 traffics to synapses. Fig. S2 shows that the Nrxn1 nanoclusters are not artifacts due to the fixation method used or the knocked-in HA-epitope. Fig. S3 shows that either truncation or loss of Nrxn1 does not alter excitatory synapse number or basic properties of synaptic transmission. Fig. S4 shows that synaptic activity does not affect the content of Nrxn1 nanoclusters or ectodomain processing, but does shift the position of nanoclusters within the synaptic cleft. Fig. S5 shows that ADAM10 shRNA and overexpression of a dominant-negative ADAM10 mutant reduce Nrxn1 ectodomain cleavage. Moreover, Fig. S5 shows that ADAM10 is not a significant regulator of excitatory synapse number in developing hippocampal cultures.
Supplementary Material Supplemental Material (PDF)
📊 Figures

Figure 1.
Schematic of the Nrxn1 cKI mice and impaired survival following constitutive truncation of Nrxn1 . (A) Diagram of WT, HA-tagged full-length, and HA-tagged truncated Nrxn1u03b1, Nrxn1u03b2, and Nrxn1u0...

Figure 2.
Nrxn1 cKI mice express full-length HA-tagged Nrxn1 in the absence of Cre recombination, but truncated HA-tagged Nrxn1 after Cre recombination. (A) HA-tagged Nrxn1 exhibits a punctate surface-staining ...

Figure 3.
Super-resolution STORM imaging identifies synaptic Nrxn1 nanoclusters. (A) Representative image of cultured neurons at DIV18, showing multiple Homer1(+) synapses with a subset containing Nrxn1 nanoclu...
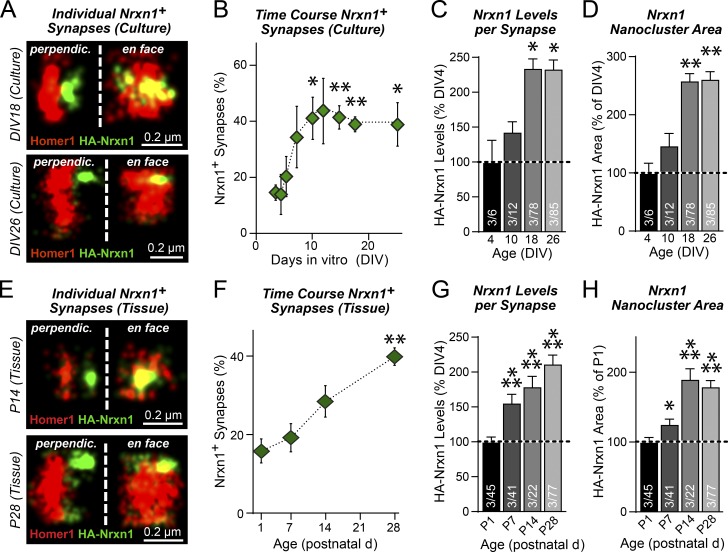
Figure 4.
Synaptic Nrxn1 nanoclusters are dynamic across development. (A) Example synapses illustrating the features of Nrxn1 nanoclusters in cultured neurons at DIV18 (top) and DIV26 (bottom), including centra...

Figure 5.
Synaptic Nrxn1 nanoclusters are independent of HA-epitope tagging and contain other neurexins. (A) Labeling with a pan-neurexin antibody shows neurexin nanoclusters in DIV12 hippocampal neurons from N...

Figure 6.
Excitatory synapses containing Nrxn1 nanoclusters exhibit higher surface GluA1 levels and more active presynaptic vesicle exocytosis. (A) Representative synapses from HA-Nrxn1 cKI hippocampal neurons ...

Figure 7.
Nrxn1 is extensively cleaved across synaptic development in cultured neurons. (A) Cultured hippocampal neurons from HA-Nrxn1 cKI mice for defined DIV5u201318 were analyzed by quantitative immunoblotti...

Figure 8.
Nrxn1 is cleaved physiologically by proteolysis at approximately twice the rate of neuroligin-1. (A) Brain subcellular fractionation protocol to obtain the total homogenate (H) and to separate soluble...

Figure 9.
ADAM10 is the major Nrxn1 sheddase in dissociated hippocampal and cortical cultures. (A) Experimental design of metalloprotease inhibition experiments. (B) Protease inhibitors used for experiments. (C...

Figure 10.
ADAM10 inhibition dramatically enhances Nrxn1 nanocluster presence and content at excitatory synapses. (A) Representative 3D STORM images of Homer1(+) synapses with surface HA-Nrxn1 clusters visualize...
Figure images are served from the NIH/NLM PubMed Central Open Access Subset or Europe PMC; copyright remains with the publishers and authors.
💬 Discussion
0 commentsNo comments yet. Be the first to start a discussion!
Leave a Comment