Abstract
AbstractIntussusceptive angiogenesis (IA) is a complementary method to sprouting angiogenesis (SA). The hallmark of IA is formation of trans-capillary tissue pillars, their fusion and remodeling of the vascular plexus. In this study, we investigate the formation of the zebrafish caudal vein plexus (CVP) in Tg(fli1a:eGFP)y7 and the synergistic interaction of IA and SA in crafting the archetypical angio-architecture of the CVP. Dynamic in vivo observations and quantitative analyses revealed that the primitive CVP during development was initiated through SA. Further vascular growth and remodeling occurred by IA. Intussusception contributed to the expansion of the CVP by formation of new pillars. Those pillars arose in front of the already existing ones; and in a subsequent step the serried pillars elongated and fused together. This resulted in segregation of larger vascular segments and remodelling of the disorganized vascular meshwork into hierarchical tree-like arrangement. Blood flow was the main driving force for IA, particularly shear stress geometry at the site of pillar formation and fusion. Computational simulations based on hemodynamics showed drop in shear stress levels at locations of new pillar formation, pillar elongation and fusion. Correlative 3D serial block face scanning electron microscopy confirmed the morphological substrate of the phenomena of the pillar formation observed in vivo. The data obtained demonstrates that after the sprouting phase and formation of the primitive capillary meshwork, the hemodynamic conditions enhance intussusceptive segregation of hierarchical vascular tree i.e. intussusceptive arborization resulting in complex vascular structures with specific angio-architecture.
🔬 Techniques
🧬 Organisms
✨ Fluorophores
🧪 Sample Preparation
🔬 Cell Lines
🏭 Microscope Brands
🧪 Reagent Suppliers
💻 Software Details
💾 Data Repositories
🏛️ Research Organizations (ROR)
Affiliated research institutions:
📋 Methods
Zebrafish Maintenance
Tg(fli1a:eGFP) y7 ; Tg(kdrl:EGFP) s843 transgenic zebrafish lines were used throughout this study. Genetically modified embryos were obtained from naturally spawning transgenic lines and staged according to Kimmel et al . 22 . Zebrafishes ( Danio rerio ) were raised in a dedicated zebrafish facility with the system water maintained at 28.5 °C with 14 h light 10 h darkness diurnal rhythm. Adult male and female zebrafishes were separated for a week prior to breeding. Subsequently they were put together at male to female ratio of 2:1. The embryos were maintained in standard embryo medium (1 × E3 medium) throughout the experiments. The transgenic lines were obtained from aquatic resource program (Children’s Hospital, Boston, USA). All the animal experiments were performed according to the guidelines of Swiss animal welfare act (license number is BE413). According to the Swiss government guidelines, experiments based on zebrafish embryos aged less than 48 hours of post fertilized embryos are exempted from animal permission.
Intravital microscopy and live confocal microscopy
Tg(fli1a:eGFP) y7 transgenic zebrafish embryos were incubated at 28.5 °C until 24 h post fertilization (hpf). Embryos were screened for GFP expression and the positive ones were treated with 0.003% 1-phenyl-2-thiourea (PTU) solution in E3 medium to prevent pigment formation at 24 hpf. The chorions were removed and mounted on low melting point agarose gel to enable imaging of CVP formation. Establishment of the vascular pattern and blood flow were monitored between 24 – 42 hpf by fluorescence stereomicroscopy (Leica stereomicroscope M205FA, Leica microsystems, Switzerland). Still images were captured and blood flow was recorded as video files using Leica camera (DFC365X) and software (Leica AF600). These videos were processed further for morphometric quantifications and simulations. Dechorionated embryos were mounted on 0.4% of low melting point agarose gel containing 0.01% of tricaine in embryos medium (standard E3 medium). Time-lapse images were recorded in Axiovert 200 M microscope with laser scanning module LSM 5 Duo live (Zeiss, Germany) using 20X objective between 24 and 40 hpf, and z-stacks were also performed. Z-stack image projections were processed using Imaris software (v7.7.2, Bitplane AG, Switzerland) for 3-dimensional (3D) visualization of pillars in the CVP. Morphometric analysis of the caudal vein plexus The prevalent angiogenic mode (sprouting vs. intussusception) was tightly monitored by in vivo observation with emphasis on the CVP starting from 24 hpf up to 42 hpf. The images acquired were used to quantify sprouts and pillars. Pillars were identified as dark holes in the green vascular plexus with diameters roughly ≤ 2.5 µm. All holes greater than 2.5 µm were considered to be meshes (large pillars). A borderline between perfused and the non-perfused area in the CVP was drawn with the help of blood flow videos captured along the still pictures. The following parameters were calculated between perfused and non-perfused areas using Cell^D software (Olympus soft imaging solutions GmbH, Germany) Vessel area Vessel area (VA) was obtained as the ratio of total number of points falling on the vascular (green) surfaces, [Pp(Vs)] and the point-associated area in µm 2 [Pp(A)]. Thus; VA = Pp(Vs) * Pp(A). Numerical pillar density Numerical density of the pillars [NP(Pr,Vs)] was estimated as the total number of pillars counted per µm 2 of vessel area, NA(Pr). Thus; NP(Pr,Vs) = NA(Pr)/VA. Numerical sprout density Numerical density of the sprouts [NS(Spr,Vs)] was calculated as the total number of sprouts counted per µm 2 of vessel area. NA(Spr). Thus; NS(Spr,Vs) = NA(Spr)/VA.
Show full methods section
Zebrafish Maintenance
Tg(fli1a:eGFP) y7 ; Tg(kdrl:EGFP) s843 transgenic zebrafish lines were used throughout this study. Genetically modified embryos were obtained from naturally spawning transgenic lines and staged according to Kimmel et al . 22 . Zebrafishes ( Danio rerio ) were raised in a dedicated zebrafish facility with the system water maintained at 28.5 °C with 14 h light 10 h darkness diurnal rhythm. Adult male and female zebrafishes were separated for a week prior to breeding. Subsequently they were put together at male to female ratio of 2:1. The embryos were maintained in standard embryo medium (1 × E3 medium) throughout the experiments. The transgenic lines were obtained from aquatic resource program (Children’s Hospital, Boston, USA). All the animal experiments were performed according to the guidelines of Swiss animal welfare act (license number is BE413). According to the Swiss government guidelines, experiments based on zebrafish embryos aged less than 48 hours of post fertilized embryos are exempted from animal permission.
Intravital microscopy and live confocal microscopy
Tg(fli1a:eGFP) y7 transgenic zebrafish embryos were incubated at 28.5 °C until 24 h post fertilization (hpf). Embryos were screened for GFP expression and the positive ones were treated with 0.003% 1-phenyl-2-thiourea (PTU) solution in E3 medium to prevent pigment formation at 24 hpf. The chorions were removed and mounted on low melting point agarose gel to enable imaging of CVP formation. Establishment of the vascular pattern and blood flow were monitored between 24 – 42 hpf by fluorescence stereomicroscopy (Leica stereomicroscope M205FA, Leica microsystems, Switzerland). Still images were captured and blood flow was recorded as video files using Leica camera (DFC365X) and software (Leica AF600). These videos were processed further for morphometric quantifications and simulations. Dechorionated embryos were mounted on 0.4% of low melting point agarose gel containing 0.01% of tricaine in embryos medium (standard E3 medium). Time-lapse images were recorded in Axiovert 200 M microscope with laser scanning module LSM 5 Duo live (Zeiss, Germany) using 20X objective between 24 and 40 hpf, and z-stacks were also performed. Z-stack image projections were processed using Imaris software (v7.7.2, Bitplane AG, Switzerland) for 3-dimensional (3D) visualization of pillars in the CVP. Morphometric analysis of the caudal vein plexus The prevalent angiogenic mode (sprouting vs. intussusception) was tightly monitored by in vivo observation with emphasis on the CVP starting from 24 hpf up to 42 hpf. The images acquired were used to quantify sprouts and pillars. Pillars were identified as dark holes in the green vascular plexus with diameters roughly ≤ 2.5 µm. All holes greater than 2.5 µm were considered to be meshes (large pillars). A borderline between perfused and the non-perfused area in the CVP was drawn with the help of blood flow videos captured along the still pictures. The following parameters were calculated between perfused and non-perfused areas using Cell^D software (Olympus soft imaging solutions GmbH, Germany) Vessel area Vessel area (VA) was obtained as the ratio of total number of points falling on the vascular (green) surfaces, [Pp(Vs)] and the point-associated area in µm 2 [Pp(A)]. Thus; VA = Pp(Vs) * Pp(A). Numerical pillar density Numerical density of the pillars [NP(Pr,Vs)] was estimated as the total number of pillars counted per µm 2 of vessel area, NA(Pr). Thus; NP(Pr,Vs) = NA(Pr)/VA. Numerical sprout density Numerical density of the sprouts [NS(Spr,Vs)] was calculated as the total number of sprouts counted per µm 2 of vessel area. NA(Spr). Thus; NS(Spr,Vs) = NA(Spr)/VA.
Computational simulation and software details
Experimental images were used to define the geometry of the domain. Pillar positions and dimensions were manually highlighted in these images. The obtained information about geometry was then used to create the finite element mesh of the model. Finite element mesh was generated using FEMAP software version 10 (Siemens PLM Software, Piano, TX, USA), and was paired with our in-house developed software tool written in C++. This software tool is used to adapt the finite elements mesh to the format that is appropriate for the numerical simulations. The in-house developed software package PakF 23 , 24 was already successfully applied to model blood flow through blood vessels in chick embryos and to analyze the creation of pillars 25 . This method is used in this paper to simulate blood flow through the caudal artery and caudal vein of the zebrafish. In numerical simulations the units for physical dimensions of the domain are micrometers, obtained velocity distribution is shown in micrometers/second, obtained pressure and wall shear stress distributions are shown in Pascal (N/m2). Characteristics of blood are defined as follows: density is set to 1.05 g/cm 3 and dynamic viscosity is set to 3.675·10 −3 Pa·s. For detailed description of the simulation calculation, please see supplementary data Materials and Methods. Drug treatments Tg(fli1a:eGFP)y 7 embryos were maintained in E3 medium until 26 hpf and the CVP was imaged using epifluorescent microscope. Control groups and treated groups were separated accordingly. Freshly prepared isoprenaline hydrochloride (50 µM, Sigma-Aldrich GmbH, Switzerland) and 2,3 BDM (6 mM, Sigma-Aldrich GmbH, Switzerland) was added to E3 medium of the treated embryos at 26 hpf and 24 hpf respectively. The embryos were incubated at 28.5 °C until 30 hpf. The control embryos in E3 medium were maintained in the same incubator until 30 hpf. The drug solution for the treated group was replaced every 45 min with freshly prepared drug solution and incubated at 28.5 °C until 36 hpf. Images of the CVP from both the control and treated groups were obtained. Injection of antisense morpholino oligonucleotide (MO) Control, troponin 2a , ( tnnt2a) 26 and gridlock (grl) 27 MOs were purchased from Gene Tools, LLC, USA. MOs were injected with phenol-red (0.05%) in zebrafish embryos at the 1~2 cell stage at a concentration of 3-5 ng/embryo. The MOs of the following sequences were used: Control MO; 5′-CCTCTTACCTCAGTTACAATTTATA-3′, tnnt2a MO; 5′-CATGTTTGCTCTGATCTGACACGCA-3′, grlMO ; 5′-CGCGCAGGTACAGACACCAAAAACT-3′, Embryos were treated with 0.003% PTU solution to prevent pigment formation at 24 hpf and then mounted using a 1% low-melting agarose on the glass bottom dish and laterally oriented. CVP in the tail region (within somite boundary 16 and 21) were imaged and processed using a Nikon confocal microscope (Nikon Instruments Europe B.V, Switzerland) and Velocity program (PerkinElmer, Inc., USA). ImageJ and Fiji programs were used to create maximum intensity projections and depth coding of Z-stack images. Three-dimensional serial block face scanning electron microscopy The Tg(fli1a:eGFP) y7 embryos were imaged and fixed in karnovsky solution (2.5% glutaraldehyde, 2.5% formaldehyde, 0.1 M cacodylate pH 7.4) overnight at 4 °C. Further, the embryos were washed 5 times for 3 min each in 0.15 M cacodylate buffer. Embryos were then incubated in 0.15 M cacodylate solution containing 1.5% potassium ferrocyanide and 2% aqueous osmium tetroxide (Electron microscopy sciences) for 1 hour at room temperature. The samples were washed in water and incubated in 1% filtered thiocarbohydrazide (Sigma-Aldrich GmbH, Switzerland) solution for 20 min at room temperature. Subsequently, they were washed gently 5 times for 3 min in milliQ water at room temperature and then incubated in 2% aqueous osmium tetroxide for 30 min at room temperature. Following this step, the embryos were washed again 5 times for 3 mins in milliQ water and then incubated in 1% uranyl acetate and left at 4 °C overnight. The following day the embryos were washed again 5 times for 3 min in milliQ water at room temperature and incubated in Walton’s lead aspartate solution 28 at 60 °C for 30 min. Then they were washed in milliQ water 5 times for 3 min and dehydrated by immersion in ascending concentrations of ethanol starting from 20%, then 50%, 70%, 90%, and 100%, 5 min each at room temperature. After the final incubation in ethanol, the embryos were transferred again to pure ethanol for 10 min at room temperature. Finally the embryos were placed in mixtures of Durcurpan (Sigma) and ethanol as follows: 25% Durcupan for 2 hours, then 50% Durcupan for 2 h, and 75% Durcupan for 2 hours. Embryos were then placed in 100% Durcupan overnight and then transferred into fresh 100% Durcupan for polymerization in silicon molds at 60 °C for 48 h. The blocks were trimmed and transverse sections were cut through the trunk of the zebrafish embryos. To perform serial block face scanning electron microscopy (SBF-SEM), ultra-thin sections were imaged with a Quanta 250 FEG (FEI) scanning electron microscope equipped with a 3View2.XP in situ ultramicrotome (Gatan). The block face images obtained were taken with 3 kV acceleration voltage and at 10 Pa pressure (low vacuum). Each slice was 75 nm thick and imaged with a magnification of 626.0×, pixel size of 21 nm and pixel dwell time of 1 µs (min frame time (s) = 34.169). The images were further processed for 3D reconstruction using Imaris software (Ver.7.7.2).
Statistical analysis
The data obtained were compared by non-parametric Mann-Whitney statistical test using the GraphPad Prism software (version 5.0; San Diego, CA). Data were presented as mean ± SD and asterisks were used to indicate significant differences (* p < 0.05; ** p < 0.01; and *** p < 0.005).
Electronic supplementary material Supplementary Figures Supplementary video S1 Supplementary video S2 Supplementary video S3 Supplementary video S4 Supplementary video S5 Supplementary video S6
Electronic supplementary material Supplementary information accompanies this paper at 10.1038/s41598-018-27791-6.
📊 Figures
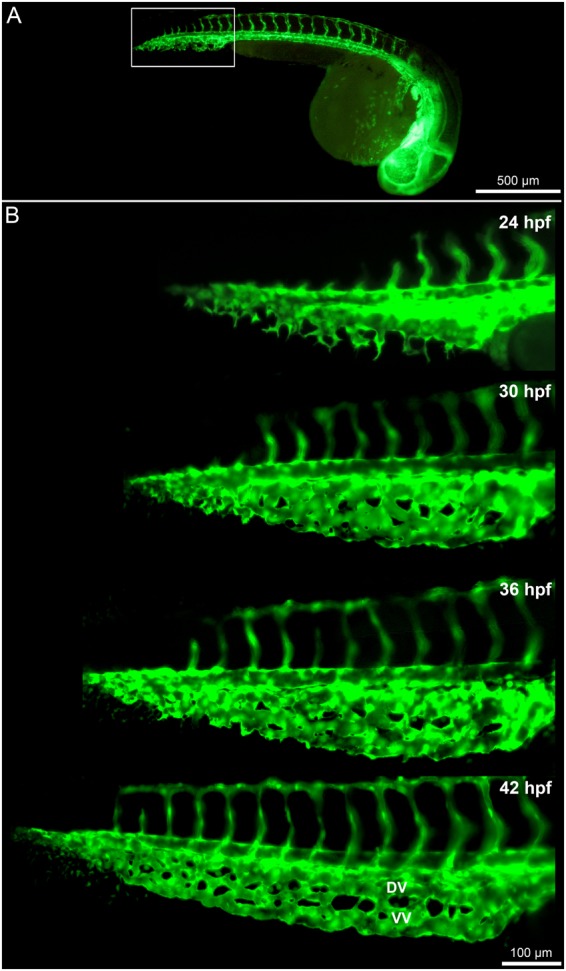
Figure 1
Time lapse in vivo images of the caudal vein plexus (CVP) from 24-42 hpf. ( A ) Overview of the blood vessels in Tg(fli1a:eGFP) y7 of the whole zebrafish embryo with the highlighted region (white box)...
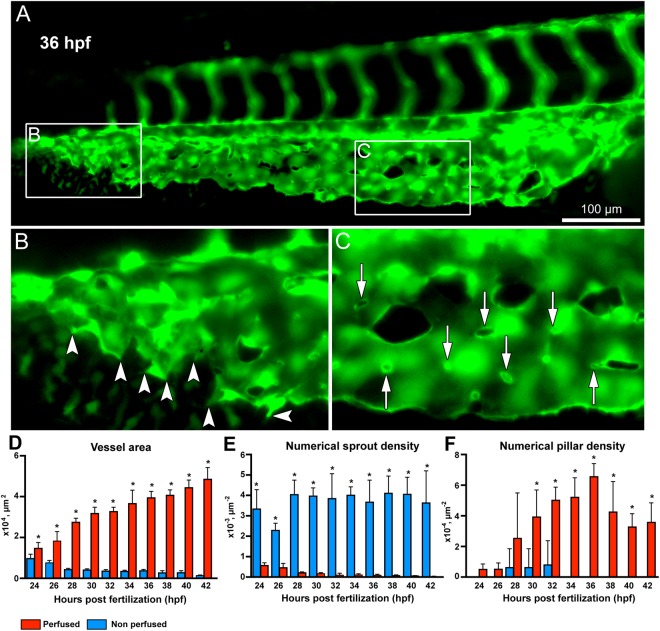
Figure 2
Morphometric analysis of sprouting vs.intussusceptive angiogenesisu00a0between perfused and non-perfused regions of the zebrafish CVP. ( A ) Atu00a036 hpf the zebrafish embryo shows both intussuscepti...
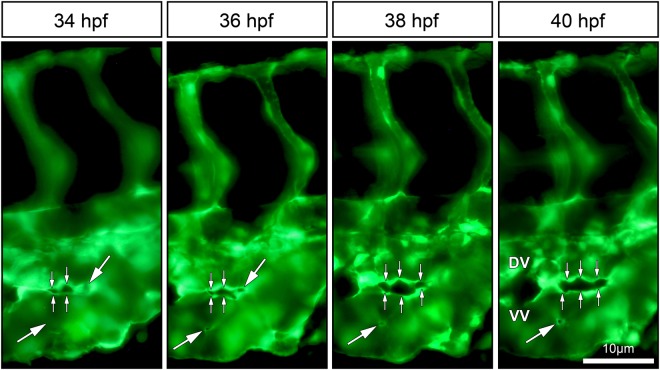
Figure 3
In vivo imaging of intussusceptive pillar formation followed by fusion and splitting in the CVP of zebrafish embryo. The large white arrows represent a clear vessel at 34 hpf and newly formed pillars ...
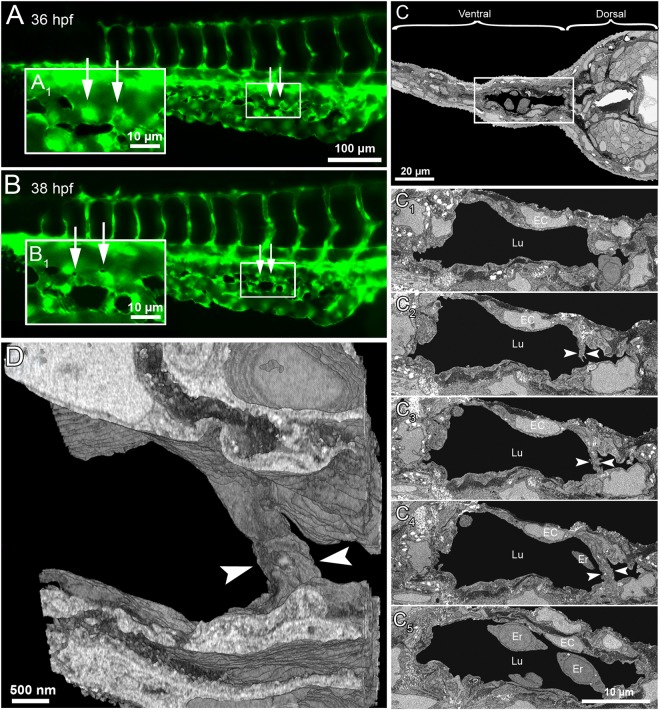
Figure 4
Serial block face electron microscopy (SBF-EM) demonstrating the 3D ultra-structure of newly formed intussusceptive pillar. ( A ) In vivo GFP images of CVP at 36 hpf, revealing intact vascular surface...
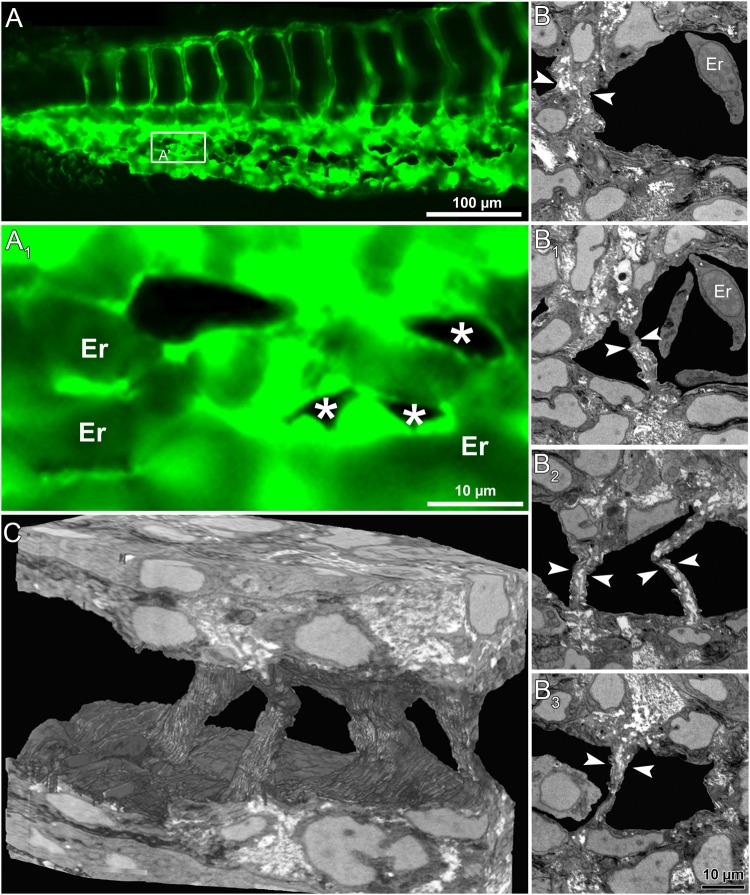
Figure 5
In vivo images and serial block face electron microscopy (SBF-SEM) sections obtained during IA mediated remodeling of zebrafish CVP. ( A ) In vivo images ofu00a0CVP fromu00a0zebrafish embryo and the c...
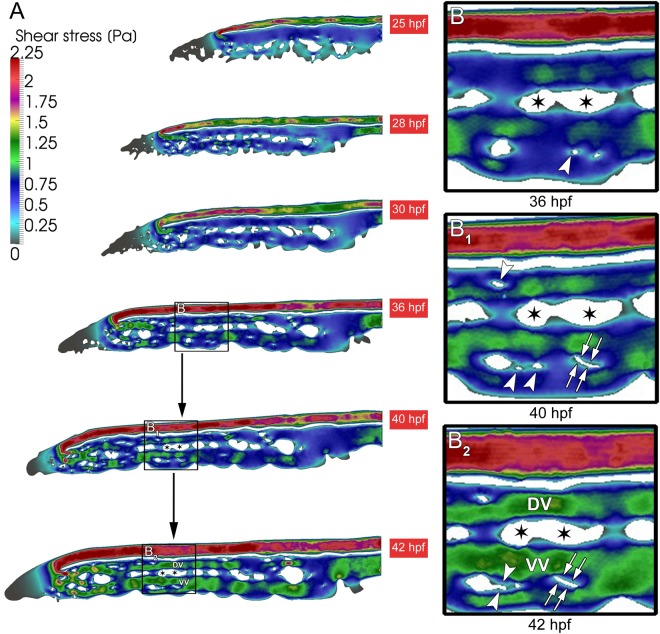
Figure 6
Shear stress distribution during CVP development. ( A ) The overall shear stress distribution calculated from blood flow videos obtained from in vivo microscopy between 25-42 hpf of developing CVP. ( ...
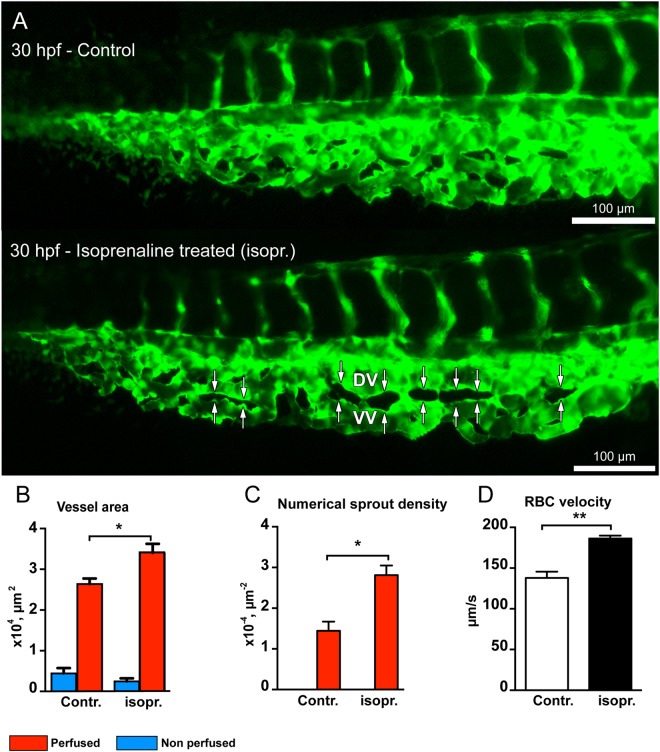
Figure 7
Isoprenaline hydrochloride (Isopr.) treatment accelerates vascular development and splitting in the zebrafish CVP. ( A ) CVP of the control embryo at 30 hpf compared with that of isoprenaline-treated ...
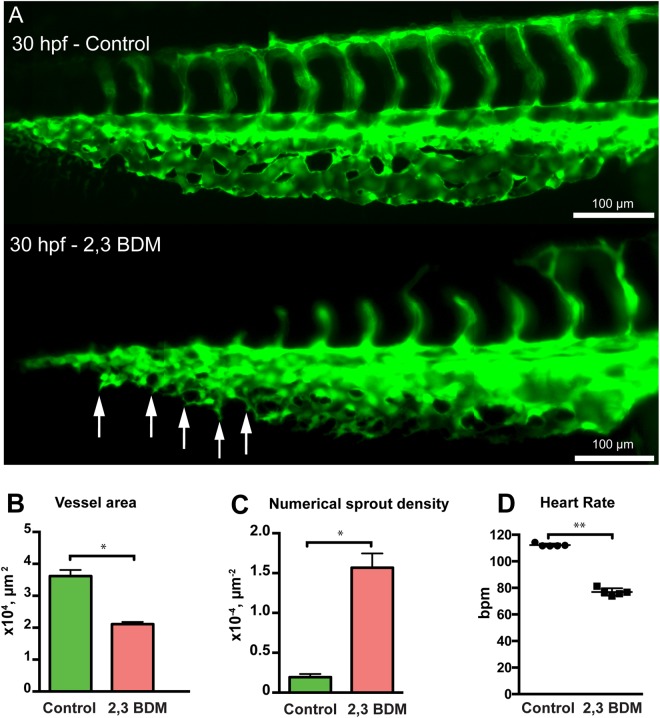
Figure 8
Treatment with 2,3 BDM decreases CVP development in zebrafish embryos. ( A ) The CVP of the control compared with 2,3 BDM treated embryos at 30 hpf. The treated CVP shows numerous sprouts (white arrow...
Figure images are served from the NIH/NLM PubMed Central Open Access Subset or Europe PMC; copyright remains with the publishers and authors.
💬 Discussion
0 commentsNo comments yet. Be the first to start a discussion!
Leave a Comment