Abstract
Prediction errors are differences between expected and actual sensory input and are thought to be key computational signals that drive learning related plasticity. One way that prediction errors could drive learning is by activating neuromodulatory systems to gate plasticity. The catecholaminergic locus coeruleus (LC) is a major neuromodulatory system involved in neuronal plasticity in the cortex. Using two-photon calcium imaging in mice exploring a virtual environment, we found that the activity of LC axons in the cortex correlated with the magnitude of unsigned visuomotor prediction errors. LC response profiles were similar in both motor and visual cortical areas, indicating that LC axons broadcast prediction errors throughout the dorsal cortex. While imaging calcium activity in layer 2/3 of the primary visual cortex, we found that optogenetic stimulation of LC axons facilitated learning of a stimulus-specific suppression of visual responses during locomotion. This plasticity - induced by minutes of LC stimulation - recapitulated the effect of visuomotor learning on a scale that is normally observed during visuomotor development across days. We conclude that prediction errors drive LC activity, and that LC activity facilitates sensorimotor plasticity in the cortex, consistent with a role in modulating learning rates.
🔬 Techniques
🔭 Microscopes
✨ Fluorophores
🧪 Sample Preparation
🏭 Microscope Brands
🧪 Reagent Suppliers
💻 Software Details
💾 Data Repositories
🏷️ Research Resource Identifiers (RRIDs)
Verified research resources used in this paper:
🏛️ Research Organizations (ROR)
Affiliated research institutions:
📋 Methods
Animals and husbandry
All animal procedures were approved by and carried out in accordance with guidelines of the Veterinary Department of the Canton Basel-Stadt, Switzerland, under license number 2573. Mice used in the study were of the NET-Cre strain ( Wagatsuma et al., 2018 ) bred in-house, either heterozygous transgenics or (in the case of some controls) wild types. Both males and females were used, and all mice were aged between 8 and 20 weeks. Mice had ad libitum access to water and regular mouse chow throughout the entire study. Mice were co-housed in groups of 2–5 in a reversed 12 hr light-dark cycle, and all imaging experiments took place during the dark part of the cycle.
Viral vector injections and surgery
For all surgical procedures, mice were anesthetized with an intraperitoneal injection of a mixture of fentanyl (0.05 mg/kg), medetomidine (0.5 mg/kg), and midazolam (5 mg/kg) and provided with both peri- and postoperative general analgesics: Metacam (5 mg/kg, s.c.) and buprenorphine (0.1 mg/kg, s.c.). A lidocaine and ropivacaine mixture was injected subcutaneously into the scalp prior to incision. Metacam analgesia was provided for a further 48 hr post-surgery. Mice were allowed to recover for 1–3 weeks prior to first head-fixation. Surgeries for two-photon imaging of LC axons Thirteen male and female NET-Cre mice (4–6 weeks old) were unilaterally injected at stereotactic coordinates (relative to bregma and brain surface): 5.45 mm posterior, 1.10 mm lateral, 3.65 mm deep. 250–500 nl of AAV2/5-hSyn-DIO-axon-GCaMP6s (2.7x10 13 genome copies/ml) was injected into each site. A 4 mm diameter circular imaging window was then implanted. A circular craniotomy was made overlying visual cortex (8 mice) or motor cortex (4 mice) and a durectomy was performed. A glass window was then placed onto the craniotomy and fixed in place with cyanoacrylate. A custom titanium headplate was attached to the skull using dental cement (Paladur, Kulzer). Surgeries for two-photon imaging in layer 2/3 V1 during optogenetic stimulation of LC axons Male and female NET-Cre mice (4–6 weeks old) were unilaterally injected with 250–500 nl of AAV2/1-hSyn-DIO-ChrimsonR-tdTomato (1.2 x 10 13 –3.4 x 10 13 genome copies/ml) into the right LC at stereotactic coordinates (relative to bregma and brain surface): 5.45 mm posterior, 1.10 mm lateral, 3.65 mm deep. A maximum of 250 nl of AAV2/1-hSyn-soma-jGCaMP8m (titer range from 10 13 –10 15 genome copies/ml) was then injected across 3–5 locations spanning right V1, and a window and headplate were implanted as above, but with the additional measure of black pigmenting of the dental cement for the reduction of optogenetic stimulation light reaching the eyes of the mouse. For control mice, the injection into the LC was omitted. For the dataset in Figure 3 , eight mice were injected in the LC, but two were excluded due to lack of expression (see section ‘Axon density’). Six mice were not injected in the LC to serve as controls. For the dataset in Figure 4 , 12 mice were injected in the LC, with 6 mice classified as high ChrimsonR-expressing and 6 mice classified as low ChrimsonR-expressing (see section ‘Axon Density’). 7 mice were not injected in the LC to serve as controls.
Show full methods section
Animals and husbandry
All animal procedures were approved by and carried out in accordance with guidelines of the Veterinary Department of the Canton Basel-Stadt, Switzerland, under license number 2573. Mice used in the study were of the NET-Cre strain ( Wagatsuma et al., 2018 ) bred in-house, either heterozygous transgenics or (in the case of some controls) wild types. Both males and females were used, and all mice were aged between 8 and 20 weeks. Mice had ad libitum access to water and regular mouse chow throughout the entire study. Mice were co-housed in groups of 2–5 in a reversed 12 hr light-dark cycle, and all imaging experiments took place during the dark part of the cycle.
Viral vector injections and surgery
For all surgical procedures, mice were anesthetized with an intraperitoneal injection of a mixture of fentanyl (0.05 mg/kg), medetomidine (0.5 mg/kg), and midazolam (5 mg/kg) and provided with both peri- and postoperative general analgesics: Metacam (5 mg/kg, s.c.) and buprenorphine (0.1 mg/kg, s.c.). A lidocaine and ropivacaine mixture was injected subcutaneously into the scalp prior to incision. Metacam analgesia was provided for a further 48 hr post-surgery. Mice were allowed to recover for 1–3 weeks prior to first head-fixation. Surgeries for two-photon imaging of LC axons Thirteen male and female NET-Cre mice (4–6 weeks old) were unilaterally injected at stereotactic coordinates (relative to bregma and brain surface): 5.45 mm posterior, 1.10 mm lateral, 3.65 mm deep. 250–500 nl of AAV2/5-hSyn-DIO-axon-GCaMP6s (2.7x10 13 genome copies/ml) was injected into each site. A 4 mm diameter circular imaging window was then implanted. A circular craniotomy was made overlying visual cortex (8 mice) or motor cortex (4 mice) and a durectomy was performed. A glass window was then placed onto the craniotomy and fixed in place with cyanoacrylate. A custom titanium headplate was attached to the skull using dental cement (Paladur, Kulzer). Surgeries for two-photon imaging in layer 2/3 V1 during optogenetic stimulation of LC axons Male and female NET-Cre mice (4–6 weeks old) were unilaterally injected with 250–500 nl of AAV2/1-hSyn-DIO-ChrimsonR-tdTomato (1.2 x 10 13 –3.4 x 10 13 genome copies/ml) into the right LC at stereotactic coordinates (relative to bregma and brain surface): 5.45 mm posterior, 1.10 mm lateral, 3.65 mm deep. A maximum of 250 nl of AAV2/1-hSyn-soma-jGCaMP8m (titer range from 10 13 –10 15 genome copies/ml) was then injected across 3–5 locations spanning right V1, and a window and headplate were implanted as above, but with the additional measure of black pigmenting of the dental cement for the reduction of optogenetic stimulation light reaching the eyes of the mouse. For control mice, the injection into the LC was omitted. For the dataset in Figure 3 , eight mice were injected in the LC, but two were excluded due to lack of expression (see section ‘Axon density’). Six mice were not injected in the LC to serve as controls. For the dataset in Figure 4 , 12 mice were injected in the LC, with 6 mice classified as high ChrimsonR-expressing and 6 mice classified as low ChrimsonR-expressing (see section ‘Axon Density’). 7 mice were not injected in the LC to serve as controls.
Immunohistochemistry
For all experiments with vector injections in LC to express either GCaMP or ChrimsonR-tdTomato, we histologically verified that expression was confined to the neurons within the anatomical location and spatial pattern expected of the LC. In a subset of mice used for imaging LC axons, we also confirmed that the transgene expressing neurons were catecholaminergic by immunostaining for tyrosine hydroxylase and GFP ( Figure 1—figure supplement 1A ). After transcardial perfusion, brains were extracted and placed in 4% paraformaldehyde overnight. Brains were then embedded in 4% agar and sliced at 40 µm on a vibratome. Free floating slices were then washed in PBS-triton, blocked for 2 h with 10% goat serum, and incubated overnight with primary antibodies (1:1000 dilution rabbit anti-tyrosine hydroxylase (Millipore 657012, RRID: AB_10681344 ), and 1:500 dilution chicken anti-GFP (Abcam ab13970, RRID: AB_300798 )). The following day, slices were washed again in PBS-triton and incubated for 2 h with the secondary antibodies at 1:1000 dilution (Alexa Fluor 488 anti-chicken (Jackson ImmunoResearch 703-545-155, RRID: AB_2340375 ) and Alexa Fluor 568 anti-rabbit (ThermoFisher Scientific, A10042, RRID: AB_2534017 )). Slices were mounted in Fluoroshield with DAPI (F6057, Sigma Aldrich). Virtual reality and visual stimuli A virtual tunnel, with walls patterned with vertical sinusoidal gratings, was projected onto a toroidal screen spanning 240 degrees horizontally and 100 degrees vertically of the visual field. The projector output was gated by a 24 kHz TTL such that it only turned on at the turnaround points of the two-photon resonance scanner, minimizing light artifacts during imaging. Mice were head-fixed on an air-floated polystyrene ball of 20 cm diameter. Movement of the virtual tunnel walls could occur only in one dimension (forward and backwards), with the ball restricted to rotation around the pitch axis using a pin. In closed loop conditions, visual flow speed in the tunnel was coupled to the rotation of the ball, with the exception of brief 1 s mismatch stimuli. These were triggered every 12±2 s (mean ± SD) regardless of locomotion behavior and would clamp the visual flow speed to zero. In open loop conditions, the visual flow speed was controlled irrespective of mouse locomotion. Three different types of open loop session were used: (1) for LC axon imaging ( Figures 1 and 2 ), as well as optogenetic stimulation of LC axons during open loop replays ( Figure 4 ), the visual flow from a previous closed loop session would be replayed. For LC axon imaging, the visual flow onset responses and playback halt responses were analyzed during this session. (2) For stimulation of LC axons to assess the effect on cortical responses ( Figure 3 ), 1 s fixed speed nasotemporal visual flow stimuli would be presented every 9±3 s (mean ± SD). We presented three different speeds of visual flow in a pseudorandom order. (3) For assessing the effects of LC axon stimulation on visuomotor plasticity ( Figure 4 ), we presented 1 s duration fixed speed visual flow stimuli every 7±1 s (mean ± SD), but this time only one speed was presented (equivalent to the speed seen during 24 cm/s locomotion in closed loop conditions), however, the direction was either nasotemporal or temporonasal, in a pseudorandom order. All mice imaged were habituated to head-fixation and the virtual reality tunnel for at least four daily 1-hr sessions prior to imaging, until they showed regular, comfortable locomotion.
Two-photon imaging
Imaging was performed on a modified Thorlabs Bergamo II two-photon microscope system. Excitation illumination was provided by a Ti-Sapphire laser with a wavelength at 930 nm and a laser power between 20 and 30 mW under the objective. When imaging neurons in V1, a piezo scanner was used to move the objective to four separate layers sequentially (15 Hz effective frame rate), but for LC axons, imaging was fixed in a single layer (60 Hz frame rate). Field of view size was 750×400 pixels (approximately 300 x 300 µm). Custom software (available at https://sourceforge.net/projects/iris-scanning ; copy archived at Widmer and Keller, 2023 ) was used to acquire the imaging data. For mice undergoing imaging of layer 2/3 V1 neurons ( Figures 3 and 4 ), two-photon imaging sites were confirmed as being in V1 by mapping V1 boundaries using intrinsic signal optical imaging.
Optogenetic stimulation of LC axons
The beam from a 637 nm OBIS laser (Coherent) was focused onto the imaging site via the two-photon microscope objective. The laser was gated to turn on only during the turnaround times of the two-photon resonance scanner, to minimize stimulation induced light artifacts. During stimulation, the laser was presented in 15 ms pulses at 20 Hz (30% duty cycle) for a total duration of 1 s. For stimulation during visual stimulus presentations ( Figure 3 ), the power was 27 mW/mm 2 . Since this evoked a small visual response in the V1 calcium activity of both ChrimsonR-expressing and control mice ( Figure 3C ), the power was reduced for subsequent experiments to 20 mW/mm 2 ( Figure 4 ), at which point the positive visual response disappeared ( Figure 4—figure supplement 1C ). For the optogenetic stimulation during visual stimulus presentations ( Figure 3 ), optogenetic stimulation occurred simultaneous with a random 50% of mismatch stimuli and visual flow stimuli, or in isolation, every 12 s on average, during closed loop conditions. For optogenetic stimulation in the plasticity experiments ( Figure 4 ), stimulation occurred every 7 s on average. In 17/61 included imaging sites, this was gated by mouse locomotion such that stimulation only occurred when locomotion speed exceeded 4 cm/s. Since the results looked very similar for both locomotion gated and ungated stimulations, the data were pooled for analysis. ΔF/F calculation Raw images were full-frame registered to correct for lateral brain motion. For V1 layer 2/3 neurons, neuronal somata were manually selected based on mean and maximum fluorescence images. Average fluorescence per region of interest (ROI) was corrected for slow fluorescence drift over time using an 8 th percentile filter and a 1000 frame window, and divided by the median value over the entire trace to calculate ΔF/F ( Dombeck et al., 2007 ). For LC axonal data ( Figures 1 and 2 ), there were a number of alternative/additional steps. First, all ROIs within an image above a manually set fluorescence threshold were selected. Non-axonal ROIs from this set were then removed in two ways: first, a ‘circularity index’ (circularity index = 4π x area/perimeter 2 ) and area threshold were used. ROIs with circularity index above 0.14 or a total area below 150 pixels were excluded – this served to remove non-axonal structures. Second, any ROI without evidence of calcium activity was removed: a fast Fourier transform was used to obtain the power spectrum of the ΔF/F trace. From this, the signal-to-noise ratio of the calcium signal was calculated, where noise was calculated as the average power between 3 and 8 Hz. ROIs with power below a signal-to-noise ratio of 10 in the frequency band from 0.05 to 1 Hz (classified as signal) were excluded. This served to remove uncommon elongated non-axonal ROIs, such as blood vessel walls. Next, due to the lower signal to noise of the axonal recordings, the ΔF/F recorded at 60 Hz was low pass filtered at 10 Hz. Finally, due to the high correlation of ΔF/F between LC axonal ROIs within a field of view ( Figure 1—figure supplement 1D–F ), ΔF/F was averaged across all axonal ROIs within a field of view. Calculation of visuomotor error ( Figure 1 ) Visuomotor error is calculated as the difference between locomotion speed and visual flow speed, assuming a constant gain between the two that the mouse predominantly experiences in the virtual reality. The change in absolute error (Δ|Error|) is calculated for each trial as the change in absolute (i.e., unsigned) visuomotor error during the stimulus window, minus the absolute visuomotor error in the 1 s preceding the stimulus. For each type of stimulus and each FoV, Δ|Error| was then averaged across trials. Note that for visuomotor mismatch, Δ|Error| is equivalent to the locomotion speed during mismatch (since visual flow speed during mismatch is zero, and the preceding 1 s is closed loop, where the error is zero). In all stimulus conditions ( Figure 1H ), the Δ|Error| is calculated in a window 0.66 s (40 frames) preceding the window used to calculate ΔF/F responses. Locomotion onsets and visual flow onsets Locomotion onsets were defined as the locomotion speed crossing a threshold of 0.4 cm/s, where the average speed in the previous two seconds was
📊 Figures
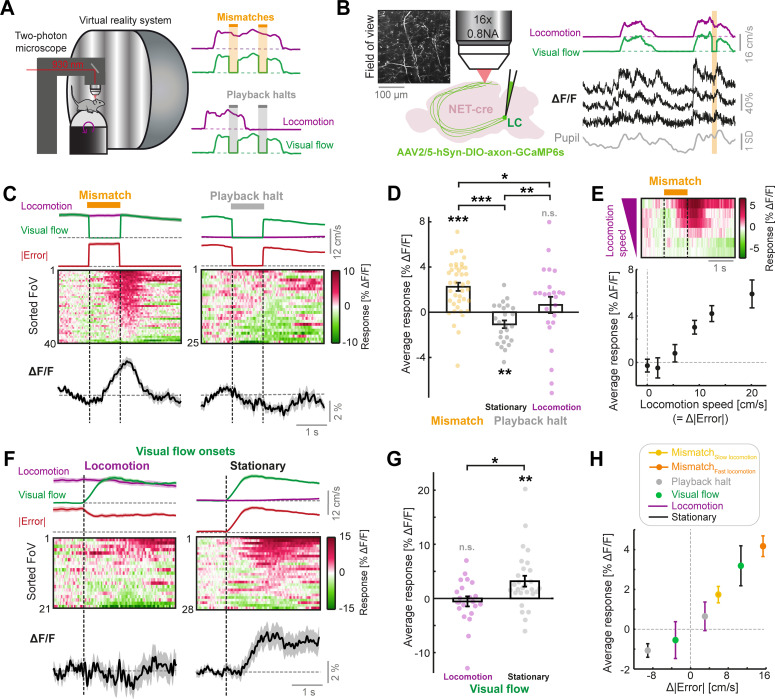
Figure 1.
LC axonal calcium activity reflects unsigned visuomotor prediction errors.
( A ) Left: Schematic of the two-photon microscope and virtual reality system. Right: Schematics of the two virtual reality conditions. Top: closed loop condition in which visual flow speed (green) is...
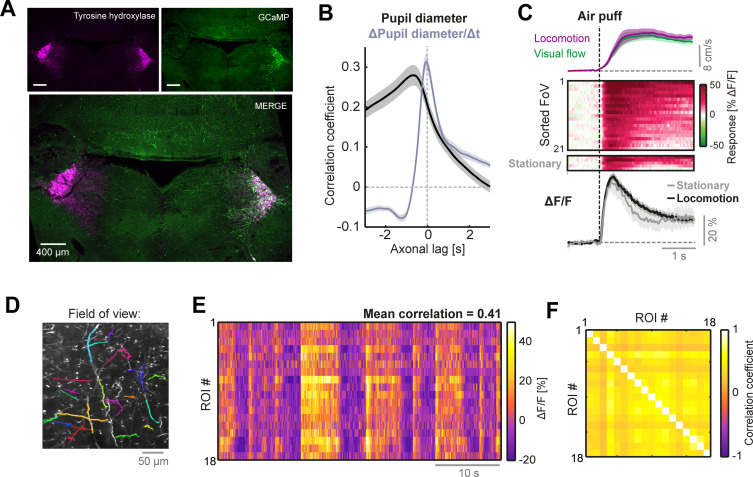
Figure 1u2014figure supplement 1.
Additional information and analyses on two-photon imaging of LC axons.
( A ) Confocal micrographs showing immunolabelling for tyrosine hydroxylase (magenta) and GCaMP6s (green) in the two LC. GCaMP6s was expressed via stereotactic viral vector injection into only the rig...
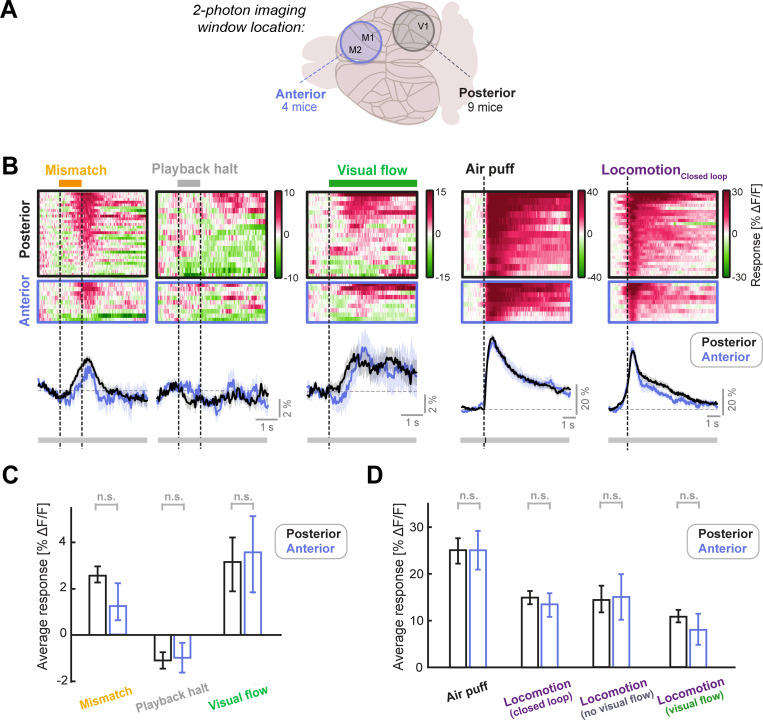
Figure 2.
LC axonal responses are similar in sensory (posterior) and motor (anterior) cortical areas.
( A ) Schematic of the two different locations of the two-photon imaging windows used. Posterior windows were centered on V1 and included surrounding structures, while anterior windows included the pr...
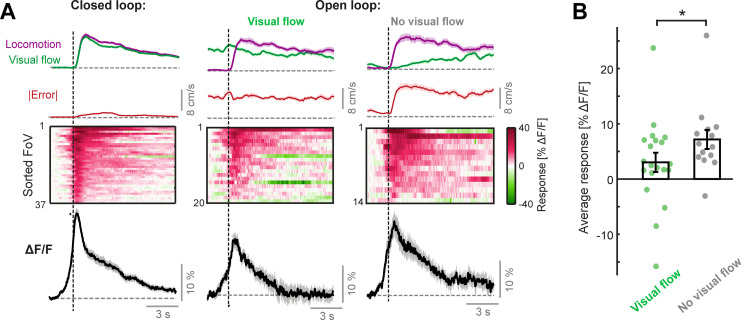
Figure 2u2014figure supplement 1.
Locomotion onset responses of LC axons.
( A ) Responses to the onset of locomotion occurring during the closed loop condition (left), during visual flow in the open loop condition (middle), and during no visual flow in the open loop conditi...
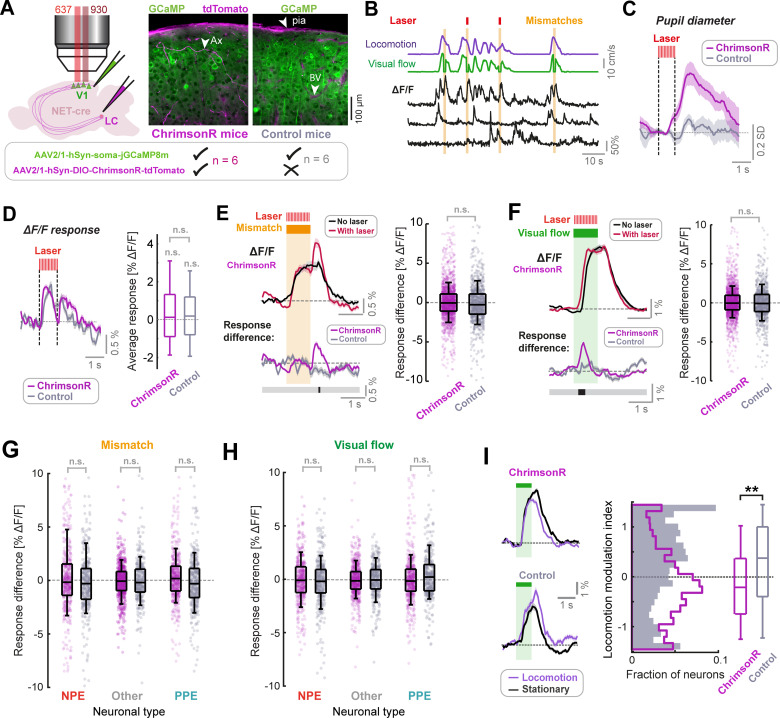
Figure 3.
LC axon stimulation has only a small effect on stimulus responses in layer 2/3 of V1.
( A ) AAV vector injections were used to express ChrimsonR-tdTomato in LC NET-positive neurons, and jGCaMP8m in layer 2/3 neurons of V1. Simultaneous two-photon calcium imaging and optogenetic stimula...
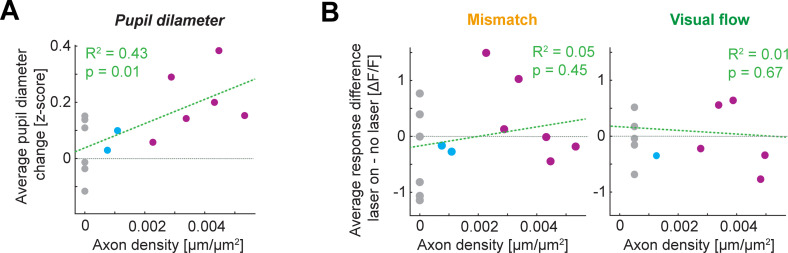
Figure 3u2014figure supplement 1.
Dependence of laser stimulation effects on ChrimsonR-labelled LC axon density.
( A ) Laser-evoked change in pupil diameter plotted against ChrimsonR-labelled axon density in V1 (see Methods) for the dataset in Figure 3 . Pink shows high ChrimsonR-expressing mice, blue shows low ...
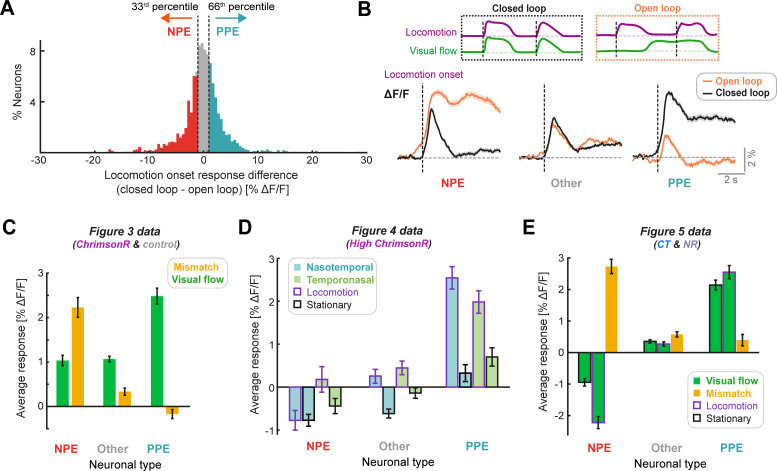
Figure 3u2014figure supplement 2.
Classification of functional neuronal types in V1 layer 2/3.
( A ) Percentage of neurons as a function of the difference in response to locomotion onsets in closed loop conditions and open loop conditions. Neurons with a responses difference below the 33rd perc...
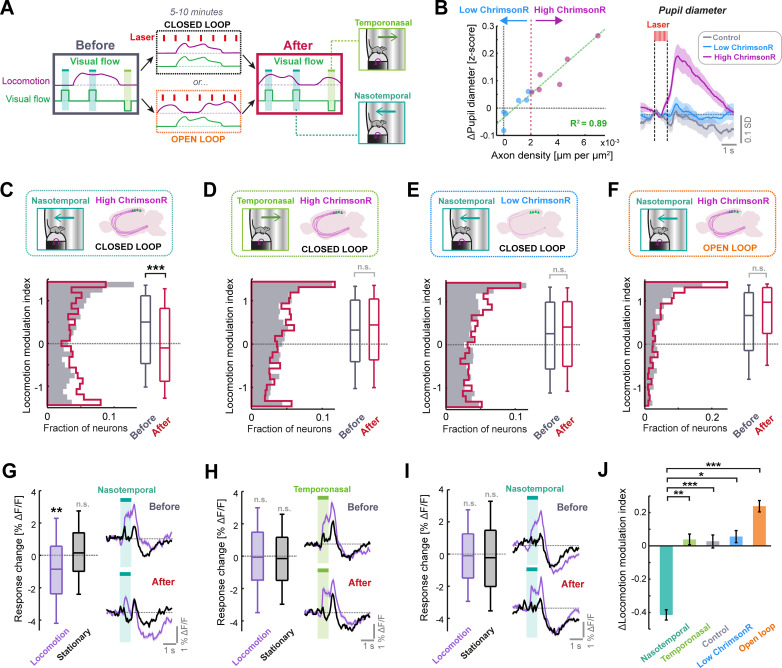
Figure 4.
Phasic LC output enhances sensorimotor plasticity in layer 2/3 of V1.
( A ) Diagram of the experiment used to determine whether LC axon stimulation during different visuomotor coupling conditions can modulate plasticity. Visual responses are compared before and after 5u...
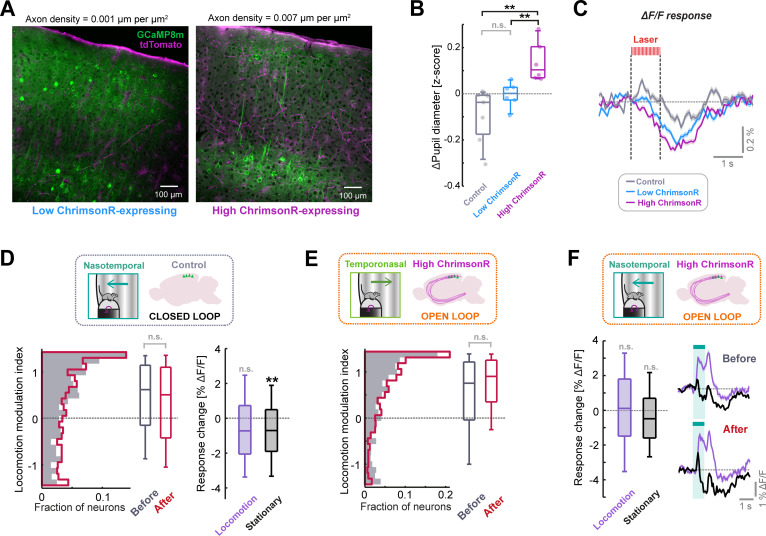
Figure 4u2014figure supplement 1.
Additional information and analyses on optogenetic stimulation of LC axons to drive plasticity.
( A ) Two example confocal microscopy images from V1 showing jGCaMP8m expression (green) and tdTomato expression (magenta), indicating labelled LC axons. The right image is from an animal classified a...
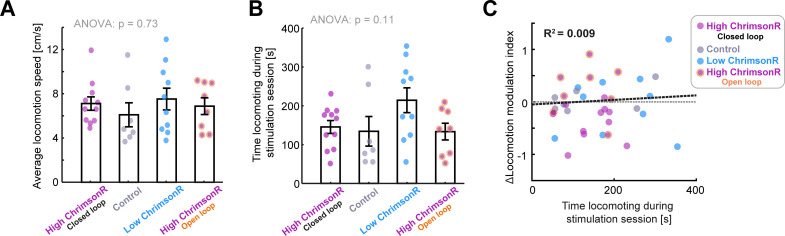
Figure 4u2014figure supplement 2.
Differences in locomotion during stimulation cannot explain differences in the change of locomotion modulation index between groups.
Related to Figure 4 . ( A ) Average locomotion speed (excluding stationary periods) for: High ChrimsonR-expressing mice during closed loop stimulation, Control mice during closed loop stimulation, low...
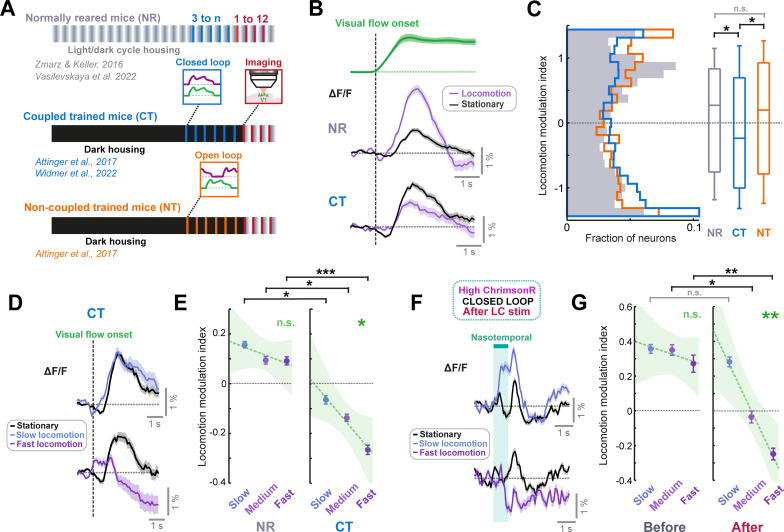
Figure 5.
LC axon stimulation over minutes recapitulates the visuomotor plasticity seen over days.
( A ) Diagram of the three groups of mice reared with different visuomotor experience. Normally reared mice (NR, gray) were raised with a normal light/dark cycle in their cages, with the full diversit...
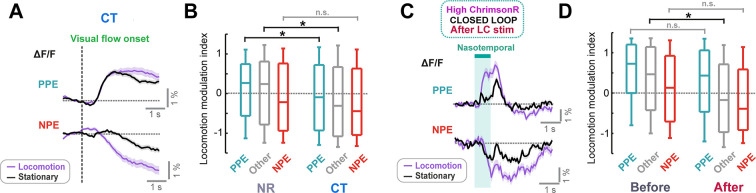
Figure 5u2014figure supplement 1.
Comparison of locomotion modulation index across different functional neuronal types in layer 2/3 V1.
Related to Figure 5 . ( A ) Average population responses of layer 2/3 neurons in V1 in coupled trained mice to the onset of visual flow during stationary periods (black), and during locomotion (purple...
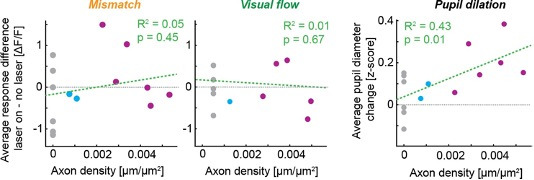
Author response image 1.
Correlations between axon density and average effect of laser stimulation on stimulus responses and pupil dilation (data from manuscript Figure 3).
Grey points show control mice, blue points show low ChrimsonR-expressing mice, and purple points show high ChrimsonR- expressing mice.
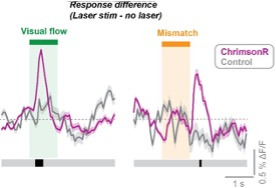
Author response image 2.
Difference in responses to visual stimuli caused by optogenetic stimulation, calculated by subtracting the average response when no laser was presented from the average response when the laser was presented concurrent with the visual stimulus.
Pink traces show the response difference for ChrimsonR-expressing mice, and grey shows the same for control mice. Black blocks below indicate consecutive timepoints after stimulation showing a signifi...
Figure images are served from the NIH/NLM PubMed Central Open Access Subset or Europe PMC; copyright remains with the publishers and authors.
💬 Discussion
0 commentsNo comments yet. Be the first to start a discussion!
Leave a Comment