Abstract
Septins are guanine nucleotide-binding proteins that polymerize into filamentous and higher-order structures. Cdc42 and its effector Gic1 are involved in septin recruitment, ring formation and dissociation. The regulatory mechanisms behind these processes are not well understood. Here, we have used electron microscopy and cryo electron tomography to elucidate the structural basis of the Gic1-septin and Gic1-Cdc42-septin interaction. We show that Gic1 acts as a scaffolding protein for septin filaments forming long and flexible filament cables. Cdc42 in its GTP-form binds to Gic1, which ultimately leads to the dissociation of Gic1 from the filament cables. Surprisingly, Cdc42-GDP is not inactive, but in the absence of Gic1 directly interacts with septin filaments resulting in their disassembly. We suggest that this unanticipated dual function of Cdc42 is crucial for the cell cycle. Based on our results we propose a novel regulatory mechanism for septin filament formation and dissociation. DOI: http://dx.doi.org/10.7554/eLife.01085.001.
🔬 Techniques
🧬 Organisms
✨ Fluorophores
🧪 Sample Preparation
🏭 Microscope Brands
🧪 Reagent Suppliers
💻 Software Details
📋 Protocols
💾 Data Repositories
🏛️ Research Organizations (ROR)
Affiliated research institutions:
📋 Methods
Plasmid construction Construction of yeast two-hybrid plasmids of septins were previously described ( Farkasovsky et al., 2005 ). In order to construct plasmids coding for the LexA and AD fusions with Gic1 fragments of different size, gic1 (310-942) (primers GIC1 -N3: CCAAGGATCCATGTTCAAAAAAAAGGACCTGTTGTCGAGG and GIC1 -C1: CCAAGTCGACGGTATTTCGAGGAGTACTAGTTTC) and gic1 (670-942) (primers GIC1 -N4: CCAAGGATCCGATTTGGAAATGACCTTGGAAGAC and GIC1 -C1: CCAAGTCGACGGTATTTCGAGGAGTACTAGTTTC) were amplified by using yeast chromosomal DNA as a template and the Expand High Fidelity PCR system (Roche, Mannheim, Germany). The PCR products were digested with Bam HI and Sal I and fragments were introduced between the Bam HI and Sal I sites of pEG202 or pJG4-5 vectors. The same PCR products were also used in the construction of expression plasmids pFM812 ( gic1 (310-942) in pEGST with C-terminal His 6 -tag) or pFM562 ( gic1 (670-942) in pGEX4T-3). All plasmid constructs were confirmed by sequencing.
Protein purification
The yeast septin complex was expressed and purified as described earlier ( Farkasovsky et al., 2005 ). In order to study the interaction of Gic1 with septin filaments in vitro, we first expressed Gic1 recombinantly in E. coli . Since the full-length protein aggregated during expression, we tested different constructs and could obtain sufficient amounts of stable non-aggregating protein only after deleting the N-terminal 103 amino acids ( Figure 4 ). Gic1(104-314) (in the text referred to as Gic1) contains the CRIB domain, which is essential for its interaction with Cdc42, and the C-terminus, which, because of its homology to the Borg BD3 domain, might be important for Gic1 binding to septins. For the bacterial expression of Gic1(104-314), the plasmid pFM812 was transformed into the E. coli strain BL21 (DE3) Rosetta (Merck KGaA, Darmstadt, Germany). The cells were grown in TB medium, supplemented with ampicillin and chloramphenicol at 37°C and induced by addition of 0.2 mM IPTG at an optical density of OD 600 = 0.6. After 8 hr at 28°C, cells were harvested by centrifugation, resuspended in isolation buffer IB1 (25 mM NaHPO 4 pH 7.8, 5% glycerol, 0.3 M NaCl, 1 mM MgCl 2 , 5 mM ß-mercaptoethanol, 10 mM imidazole, complete protease inhibitors [Roche], 0.2 mM PMSF) and disrupted by using a microfluidizer (Microfluidics Co., Westwood, MA, USA). After high-speed centrifugation at 100000× g , the supernatant was incubated with 50 ml (V t ) Ni-NTA-Sepharose (Qiagen, Hilden, Germany), washed with 300 ml buffer IB2 (25 mM NaHPO 4 pH 7.8, 5% glycerol, 0.5 M NaCl, 1 mM MgCl 2 , 5 mM ß-mercaptoethanol, 50 mM imidazole, 5 mM ATP, complete protease inhibitors, 0.2 mM PMSF) and with 100 ml of buffer IB3 (25 mM NaHPO 4 pH 7.8, 5% glycerol, 0.3 M NaCl, 1 mM MgCl 2 , 5 mM ß-mercaptoethanol). Gic1 was eluted with 300 mM imidazole in buffer IB3 and the GST-tag was cleaved using thrombin at 4°C. Then, the GST and the undigested fusion protein were removed by glutathione sepharose column chromatography (GE Healthcare, Buckinghamshire, UK). Gic1 was concentrated and further purified on a Superdex S200 column (GE Healthcare, Buckinghamshire, UK). Expression and purification of Cdc42(G12V) was performed as previously described ( Rudolph et al., 1998 ). Due its intrinsic GTPase activity, Cdc42 is usually GDP-bound after purification. In order to exchange GDP to GppNHp or to remove residual GTP, 5 mM EDTA (5 times the MgCl 2 concentration) and 20 times excess of the desired nucleotide over the protein were added to Cdc42 and incubated at room temperature for 2 hr. Subsequently, the protein was concentrated using Amicon Ultra-4 Centrifugal Filters with a cut-off of 10 kDa and washed with the gel filtration buffer devoid of EDTA and nucleotide (150 mM NaCl, 20 mM Tris-HCl pH 7.5, 1 mM MgCl 2 ).
Show full methods section
Plasmid construction Construction of yeast two-hybrid plasmids of septins were previously described ( Farkasovsky et al., 2005 ). In order to construct plasmids coding for the LexA and AD fusions with Gic1 fragments of different size, gic1 (310-942) (primers GIC1 -N3: CCAAGGATCCATGTTCAAAAAAAAGGACCTGTTGTCGAGG and GIC1 -C1: CCAAGTCGACGGTATTTCGAGGAGTACTAGTTTC) and gic1 (670-942) (primers GIC1 -N4: CCAAGGATCCGATTTGGAAATGACCTTGGAAGAC and GIC1 -C1: CCAAGTCGACGGTATTTCGAGGAGTACTAGTTTC) were amplified by using yeast chromosomal DNA as a template and the Expand High Fidelity PCR system (Roche, Mannheim, Germany). The PCR products were digested with Bam HI and Sal I and fragments were introduced between the Bam HI and Sal I sites of pEG202 or pJG4-5 vectors. The same PCR products were also used in the construction of expression plasmids pFM812 ( gic1 (310-942) in pEGST with C-terminal His 6 -tag) or pFM562 ( gic1 (670-942) in pGEX4T-3). All plasmid constructs were confirmed by sequencing.
Protein purification
The yeast septin complex was expressed and purified as described earlier ( Farkasovsky et al., 2005 ). In order to study the interaction of Gic1 with septin filaments in vitro, we first expressed Gic1 recombinantly in E. coli . Since the full-length protein aggregated during expression, we tested different constructs and could obtain sufficient amounts of stable non-aggregating protein only after deleting the N-terminal 103 amino acids ( Figure 4 ). Gic1(104-314) (in the text referred to as Gic1) contains the CRIB domain, which is essential for its interaction with Cdc42, and the C-terminus, which, because of its homology to the Borg BD3 domain, might be important for Gic1 binding to septins. For the bacterial expression of Gic1(104-314), the plasmid pFM812 was transformed into the E. coli strain BL21 (DE3) Rosetta (Merck KGaA, Darmstadt, Germany). The cells were grown in TB medium, supplemented with ampicillin and chloramphenicol at 37°C and induced by addition of 0.2 mM IPTG at an optical density of OD 600 = 0.6. After 8 hr at 28°C, cells were harvested by centrifugation, resuspended in isolation buffer IB1 (25 mM NaHPO 4 pH 7.8, 5% glycerol, 0.3 M NaCl, 1 mM MgCl 2 , 5 mM ß-mercaptoethanol, 10 mM imidazole, complete protease inhibitors [Roche], 0.2 mM PMSF) and disrupted by using a microfluidizer (Microfluidics Co., Westwood, MA, USA). After high-speed centrifugation at 100000× g , the supernatant was incubated with 50 ml (V t ) Ni-NTA-Sepharose (Qiagen, Hilden, Germany), washed with 300 ml buffer IB2 (25 mM NaHPO 4 pH 7.8, 5% glycerol, 0.5 M NaCl, 1 mM MgCl 2 , 5 mM ß-mercaptoethanol, 50 mM imidazole, 5 mM ATP, complete protease inhibitors, 0.2 mM PMSF) and with 100 ml of buffer IB3 (25 mM NaHPO 4 pH 7.8, 5% glycerol, 0.3 M NaCl, 1 mM MgCl 2 , 5 mM ß-mercaptoethanol). Gic1 was eluted with 300 mM imidazole in buffer IB3 and the GST-tag was cleaved using thrombin at 4°C. Then, the GST and the undigested fusion protein were removed by glutathione sepharose column chromatography (GE Healthcare, Buckinghamshire, UK). Gic1 was concentrated and further purified on a Superdex S200 column (GE Healthcare, Buckinghamshire, UK). Expression and purification of Cdc42(G12V) was performed as previously described ( Rudolph et al., 1998 ). Due its intrinsic GTPase activity, Cdc42 is usually GDP-bound after purification. In order to exchange GDP to GppNHp or to remove residual GTP, 5 mM EDTA (5 times the MgCl 2 concentration) and 20 times excess of the desired nucleotide over the protein were added to Cdc42 and incubated at room temperature for 2 hr. Subsequently, the protein was concentrated using Amicon Ultra-4 Centrifugal Filters with a cut-off of 10 kDa and washed with the gel filtration buffer devoid of EDTA and nucleotide (150 mM NaCl, 20 mM Tris-HCl pH 7.5, 1 mM MgCl 2 ).
Filament preparation and antibody labeling
For septin filament production, septin oligomers in a high-salt buffer (500 mM NaCl, 1 mM MgCl 2 , 50 mM Tris-HCl pH 7.5, 1 mM DTT) at a final concentration of 0.3 µM were dialyzed overnight at 4°C against a low-salt buffer (100 mM NaCl, 20 mM Tris-HCl pH 7.5, 1 mM DTT). In the case of Gic1-septin complexes, septin oligomers (final concentration of 0.3 µM) were mixed with Gic1 (final concentration of 1.5 µM) in a high-salt buffer and dialyzed as described above. For antibody decoration, 5 μl of polyclonal antibodies against Cdc11 (Santa Cruz Biotech, Heidelberg, Germany) and Cdc3 (gift from Dr Michael Knop, ZMBH, Heidelberg) (1:100) were added to 20 μl of a sample containing the filaments or the septin octamers and incubated overnight at 4°C. For studies involving Cdc42, 0.1 μM of the septin octamer and 0.5 μM of Gic1 were used. Cdc42-GppNHp and Cdc42-GDP were used at the same concentration as Gic1 or at higher concentrations (as indicated in the figures) and incubated for different time intervals ( Figures 7 and 10 ).
Gel filtration chromatography
For gel filtration analyses of binding between non-polymerizing septin, Gic1 and Cdc42, 1 mg of each protein of the desired complex was mixed and incubated for 15 min at 4°C. Then, 500 μl of the solution was injected into Superdex S200 (GE Healthcare, Buckinghamshire, UK) column. The sample was run at 0.4 ml/min with a buffer containing 100 mM NaCl, 20 mM Tris-HCl pH 7.5, 1 mM DTT and 1 mM MgCl 2 .
Yeast two-hybrid assay
Two-hybrid studies were performed using the LexA-based system as described previously ( Sirajuddin et al., 2009 ). The yeast strain EGY48 was co-transformed with pEG202-based and pJG4-5-based plasmids. The reporter plasmid pSH18-34 was used for the quantitative ß-galactosidase assay. Three independent isolates of each strain were tested on minimal medium in absence of leucine or presence of X-gal, respectively. Adsorption to lipid monolayer To obtain more details on the structure of septin-Gic1 complexes, we formed single railroad tracks by untangling the bundles on a lipid monolayer, which we then studied by EM and SPA. Since Cdc3 carries a His 6 -tag, the filaments can be adsorbed to a lipid monolayer containing Ni-NTA-lipids. To obtain single-stranded filaments, 30 µl of the samples were adsorbed to a lipid monolayer composed of 0.5 mg/ml of DOGS-NTA:DOPC at a molar ratio of 1:3 and incubated for 1 hr at 4°C. The monolayer was transferred to a carbon-coated grid and then negatively stained as described below. To prove that the His 6 -tags of the proteins are not responsible for the entangling of the filaments, we performed additional experiments. Both Gics and septins have been reported to interact strongly with PIP2 ( Orlando et al., 2008 ; Bertin et al., 2010 ). We therefore immobilized septin-Gic1 filaments on lipid monolayers containing PIP2 instead of Ni-NTA lipids. The filaments adsorbed to the grid and bundles were ‘untangled’ comparably to that seen in the experiments with Ni-NTA lipids ( Figure 17 ), indicating that the interaction of the septin-Gic1 filaments, respectively, is not His 6 -tag-induced. 10.7554/eLife.01085.024 Figure 17. Septin-Gic1 complexes immobilized on a PIP2-containing lipid monolayer. ( A – C ) Representative EM image of negatively stained septin-Gic1 complexes immobilized on a PIP2-containing monolayer. Scale bar, 100 nm. DOI: http://dx.doi.org/10.7554/eLife.01085.024 Negative stain electron microscopy and image processing Conventional negative staining was performed as previously described ( Bröcker et al., 2012 ). In brief, samples were applied onto freshly glow-discharged, carbon-coated copper grids. The sample was left for 1 min on the grid before blotting and staining with uranyl formate (0.7% wt/vol). All images of negatively stained samples were taken with a JEOL JEM 1400 electron microscope equipped with a LaB 6 filament at an acceleration voltage of 120 kV. Electron micrographs were taken in minimal dose mode at a magnification of 50,000× and a defocus of 1–2 µm. Negatives (Kodak S0-163 film) were scanned with a Heidelberg Tango drum scanner with 2419 dpi resolution yielding a pixel size of 4.5 Å on the specimen level. Alternatively, images were recorded with a 4k × 4k CMOS camera F-416 (TVIPS) at a calibrated magnification of 67,200×, resulting in a pixel size of 2.32 Å/pixel. Single particles were manually selected using boxer ( Ludtke et al., 1999 ). To analyze septins and Gic1 in their non-filamentous state, 4461 particles of septin octamers, 199 particles of septin octamers labeled with anti-Cdc11 antibody and 1282 and 2195 particles of non-polymerizing septin-Cdc10(30-322) tetramers and octamers were selected. In the same way, 14,407 particles of septin-Cdc42-GDP, 451 particles of septin-Cdc42-GDP labeled with anti-Cdc3 antibody, 1152 particles of septin-Cdc42-GDP + GTP were selected. 3,169 particles of septin + GTP, 188 particles of septin + GTP labeled with anti-Cdc3 antibody, 281 particles of septin + GTP and anti-Cdc11 antibody were selected. To analyze septin and Gic1 in filamentous structures, two different sets of particles were selected. The first set focused on the septin filaments (sf) between two Gic1 cross-bridges and the second set in the middle of the Gic1 cross-bridge (gc). 2,228 sf particles and 1471 gc particles of the septin-Gic1 complex, 1971 sf particles and 1561 gc particles of the Cdc11Δ mutant filaments, 3979 sf particles and 3837 gc particles of the septin-Gic1-Cdc42-GppNHp complex and 180 sf particles of the septin-Gic1 complex labeled with anti-Cdc11 antibody were selected, respectively. Single particles were aligned and classified using reference-free alignment and k-means classification procedures implemented in SPARX ( Hohn et al., 2007 ). Briefly, images were normalized to the same mean and standard deviation and band-pass filtered. Images were then centered, subjected to 2D reference-free rotational alignment (sxali2d) and k-means classification (sxk_means), with approximately 100-150 images per class. The images were then further aligned and classified by several rounds of multireference alignment (sxmref_ali2d), where only high quality classes were used as references, followed by k-means classification. Classification was performed within an elongated mask including the respective septin density, expanded by 5 pixels. For analysis of antibody binding, all members of class averages showing additional density were merged and subjected to further rounds of alignment and classification, with approximately 15-20 images per class. Shown are characteristic class averages with the lowest intra-class variance in the region of antibody binding. Cryo electron tomography (cryo-ET) and image processing For cryo-ET of the septin-Gic1 and septin-Gic1-Cdc42-GppNHp complexes, 2 μM of septins and 10 μM of Gic1 with or without 10 μM Cdc42-GppNHp were used, respectively. The septin-Gic1 and septin-Gic1-Cdc42-GppNHp complexes were mixed with 5 nm colloidal gold particles. 4 μl aliquots of each preparation were applied to a glow discharged C-flat holey carbon grid (Protochips Inc.) and plunge-frozen in liquid ethane using a Cryoplunge3 (Gatan Inc.). Images were collected with a JEOL JEM 3200FSC TEM equipped with an 8k × 8k pixel TVIPS CMOS camera (F-816) at an acceleration voltage of 200 kV and a magnification of 85,470×. An in-column omega energy filter was used to improve image contrast by zero-loss filtering with a slit-width of 15 eV. Tilt series were collected at a defocus of ∼ 4-5 μm, covering the range of ±60 in 2° increments and a dosage of about 1e − /Å 2 per image. Images were then reduced by 4 × 4 pixel averaging resulting in a pixel size of 7.3 Å. Data were processed using the IMOD software package ( Kremer et al., 1996 ). Gold particles were tracked as fiducial markers to align the stack of tilted images, and tomograms were reconstructed by weighted back-projection. Selected sub-tomograms were segmented using Amira ( Stalling et al., 2005 ) and rendering was performed in Chimera ( Pettersen et al., 2004 ). The segmentation of tomographic reconstructions was performed by manually tracing structural features through sequential slices of the tomograms. Regions of high density between filaments were assigned to Gic1 or Gic1-Cdc42 respectively. After visual inspection of the first tomograms and subsequent careful segmentation, it became immediately clear that septin-Gic1 complexes are highly heterogeneous concerning their overall arrangement, diameters and even number of septin-filaments, which excluded the possibility of subtomogram averaging. Furthermore, the majority of septin cables reside in a preferred side-view orientation perpendicular to the beam direction ( Figure 3 ; Video 1 ). Although such tomograms gave us clear hints about the overall arrangement of septin cables and revealed clear differences between septin-Gic1 and septin-Gic1-Cdc42-GppNHp, the missing wedge artifacts caused the broadening of the septin filaments, making their exact tracing difficult in all slice-directions. However, these initial attempts revealed bending as a characteristic feature of the septin-Gic1 cables ( Figure 3 ). On grids with relatively thick ice we observed filaments, which changed their orientation and ran parallel to the beam direction at 0° tilt. In some cases, short cables were completely embedded in ice in a top view orientation ( Video 2 and 3 ). Since the missing wedge artifact in this geometry causes only the elongation of the septin filaments, their exact tracing was straightforward, but the cables were often too short. We therefore scanned thousands of positions in several grids for both samples (septin-Gic1 and septin-Gic1-Cdc42-GppNHp) to find complexes of sufficient length and recorded two tomograms of such regions of septin-Gic1 and three tomograms of septin-Gic-Cdc42-GppNHp complexes. Each tomogram contained 7–10 septin-Gic1 or septin-Gic1-Cdc42-GppNHp cables running parallel to the beam at 0° tilt. We extracted all separate cables as subtomograms and processed them as described above. The quality of these raw subtomograms was extremely good and details that would otherwise require the technique of subtomogram averaging (such as number and shape of filaments, or interaction between filaments) were clearly discernable even without further processing ( Figure 18A–B ). 10.7554/eLife.01085.025 Figure 18. Processing of subtomograms. ( A and B ) Top and side view of a representative raw subtomogram filtered to 30 Å, respectively. ( C and D ) Segmentation in Amira ( Stalling et al., 2005 ). Top and side view of representative slices with selected densities, respectively. ( E and F ) Top and side view of three-dimensionally rendered segments in Amira, respectively. ( G and H ) Top and side view of masked raw densities filtered to 40 Å using the Amira derived segments as masks. DOI: http://dx.doi.org/10.7554/eLife.01085.025 We segmented the subtomograms using Amira ( Figure 18C–F ). The resulting segments were then binarized, expanded, gauss filtered and used as masks to extract the respective density from the raw subtomograms. The extracted densities were low-pass filtered to 40 Å ( Figure 18G–H ). Therefore, the images shown in Figures 3, 6 and 18G–H do not represent the typical renderings of manual segmentations, but the extracted raw densities using masks obtained by manual segmentations. To prove that the observed organization of septin-Gic1 or septin-Gic1-Cdc42 complexes is independent of the geometry during image recording, we also processed septin-Gic1-Cdc42 complexes running perpendicular to the beam and parallel to the tilt axis ( Figure 19A–C ). As expected and described above the septin filaments are broadened and flat. However, the structure clearly shows that the septin-Gic1-Cdc42 complexes have the same organization as the complexes depicted in Figure 3E–G and Figure 6E–G , therefore ruling out that our observations are influenced by the geometry of the complexes. 10.7554/eLife.01085.026 Figure 19. Tomography of septin-Gic1-Cdc42 complexes running parallel to the tilt-axis. ( A ) Central slice of representative tomogram of septin-Gic1-Cdc42 complexes. A railroad-like complex running parallel to the tilt axis was extracted (see inset). Scale bars, 200 nm. ( B and C ) Top ( B ) and side view ( C ) of a septin-Gic1-Cdc42-GppNHp complex. The septin filaments and Gic1-Cdc42-GppNHp cross-bridges are depicted in gold and green, respectively. Scale bar, 20 nm. DOI: http://dx.doi.org/10.7554/eLife.01085.026 To determine the effect of the missing wedge on our structure we performed tomography-simulations using an idealized railroad-like structure model. The idealized model of a septin-Gic1-Cdc42-GppNHp complex ( Figure 20B–C ) was obtained by fitting several copies of the crystal structure of the mammalian septin trimer (PDBid: 2QAG ) into the density of septin filaments and placing of GROEL/GROES (PDBid: 1AON ) into the density corresponding to Gic1-Cdc42-GppNHp cross-bridges in one of our reconstructions ( Figure 20A ). 10.7554/eLife.01085.027 Figure 20. Simulations of electron tomograms of septin-Gic1-Cdc42-GppNHp complexes. ( A ) Side view of a septin-Gic1-Cdc42-GppNHp subtomogram. The septin filaments and Gic1-Cdc42-GppNHp cross-bridges are depicted in gold and green, respectively. ( B ) Model of a septin-Gic1-Cdc42-GppNHp complex obtained by fitting the crystal structure of the mammalian septin trimer (PDBid: 2QAG , gold) and GROEL/GROES (PDBid: 1AON , green) into ( A ), shown in three different orientations. ( C ) Simulated EM density map of ( B ) at a resolution of 45 Å. ( G – L ) Simulations of electron tomograms obtained by tilting the model shown in ( C ) in the range of ±60 in 2° increments with its long axis running parallel to the beam ( D ), parallel ( G ) and perpendicular ( J ) to our microscope’s tilt axis, respectively. ( E , H , and K ) Corresponding projections at −60°, 0°, 60° and ( F , I , and L ) the resulting simulated tomograms, respectively. Note that the tomograms shown in ( I and L ) are obviously affected by missing wedge artifacts, whereas the tomogram in ( F ) (long axis of the molecule parallel to the beam axis during tilting) is only slightly stretched in comparison to the original model ( C ). DOI: http://dx.doi.org/10.7554/eLife.01085.027 We then simulated electron tomograms by tilting the model shown in Figure 20C in the range of ±60 in 2° increments with its long axis running parallel to the beam, and parallel and perpendicular to our microscope’s tilt axis, respectively ( Figure 20D,G,J ). All tomograms are affected by missing wedge artifacts. However, the complexes running parallel to the tilt axis are better resolved ( Figure 20E–F,H–I ) than the ones running perpendicular to the tilt axis ( Figure 20K–L ). Because of the longitudinal appearance of the septin-Gic1-Cdc42 complexes, tomograms with complexes running parallel to the beam result in a reconstruction that is more similar to the original model ( Figure 20E–F ) compared to complexes running perpendicular to the beam ( Figure 20H–I ). The filaments are fully comparable to the filaments of the original model. Only the densities of GROEL/GROES (simulating Gic1-Cdc42 cross-bridges) ( Figure 20F , shown in green) show an increase in diameter along the z direction by ∼14%. Moreover, to simulate a more ‘close to reality’ situation, the same procedure was repeated, this time after adding noise and applying CTF to the projections ( Figure 21A–B ). The volume was then filtered to 45 Å ( Figure 21C ) and compared again to the simulated model ( Figure 21D ). Even without further processing of this simulated tomogram, both volumes show a high degree of similarity in all aspects with a cross-correlation coefficient of 0.95, further suggesting that tomograms taken under similar conditions are fully sufficient to describe the basic architecture of the filaments. 10.7554/eLife.01085.028 Figure 21. Electron tomogram simulation of septin-Gic1-Cdc42-GppNHp with CTF and noise added. ( A ) Projections of the model shown in ( B ) in the range of ±60° in 2° increments, after applying the CTF at a defocus of 4 µm and addition of noise. Note that at 0°, the long axis of the model was running in the z direction ( Figure 19D ). ( B ) Original model used for generating the reprojections ( Figure 19F ). ( C ) Reconstruction obtained by back-projecting the images shown in ( A ). ( D ) Fitting of the simulated tomographic reconstruction (yellow mesh) into the original model (cyan surface). DOI: http://dx.doi.org/10.7554/eLife.01085.028 Filament preparation and antibody labeling For septin filament production, 0.3 µM of septin hetero-oligomers (wild-type, EGFP-tagged, Cdc10Δ, Cdc11Δ or Cdc10(30-322) mutants) in a high-salt buffer (500 mM NaCl, 1 mM MgCl 2 , 50 mM Tris-HCl pH 7.5, 1 mM DTT) were dialyzed overnight at 4°C against a low-salt buffer (100 mM NaCl, 20 mM Tris-HCl pH 7.5, 1 mM DTT). In order to form the septin-Gic1 complexes, 1.5 µM of Gic1 was included during dialysis. Since Gic1 forms dimers and septin octamers contain two Cdc10 subunits, the molar ratio (Cdc10:Gic1) is 1.25:1. For antibody decoration, 5 μl of polyclonal antibodies against Cdc11 (Santa Cruz Biotechnology Inc.) and Cdc3 (a gift from Michael Knop, DKFZ-ZMBH, Heidelberg, Germany) (diluted 1:100) were added to 20 μl of a sample containing either septin-Gic1 complex or the septin octamers (generated by GTP, Cdc42-GDP or both) and incubated overnight at 4°C to allow efficient binding. In order to evaluate the effect of Cdc42 on septin complexes, 0.1 μM of septin octamers and 0.5 μM of Gic1 were used. Cdc42-GppNHp and Cdc42-GDP were used at a concentration equal to Gic1 or at 10 times higher concentrations and incubated for different time intervals ( Figures 7 and 10 ). To assess the effect of nucleotides on septin complexes, 2.4 mM of GMP, GDP, GTP or GppNHp were added to 0.5 μM of septin filaments dialyzed alone or with 2.5 μM of Gic1 and incubated for 16 hr at 4°C. The same sample was dialyzed to remove the residual GTP and the generated octamers were incubated with 25 μM of Cdc42-GDP and incubated at 4°C for 16 hr. For cryo-ET of the septin-Gic1 and septin-Gic1-Cdc42 complexes, 2 μM of YSC and 10 μM of Gic1 with or without 10 μM Cdc42-GppNHp were used, respectively.
Data deposition
The coordinates for the EM structures have been deposited in the EM Data Bank under accession codes EMDB-2504 and EMDB-2505.
Additional files Major datasets
The following datasets were generated: Sadian Y , Gatsogiannis C , Patasi C , Hofnagel O , Goody RS , Farkašovský M , Raunser S , 2013 , Data from: The Role of Cdc42 and Gic1 in the Regulation of Septin Filament Formation and Dissociation , http://www.ebi.ac.uk/pdbe/entry/EMD-2504 , Publicly available at Electron Microscopy Data Bank (EMDB). Sadian Y , Gatsogiannis C , Patasi C , Hofnagel O , Goody RS , Farkašovský M , Raunser S , 2013 , Data from: The Role of Cdc42 and Gic1 in the Regulation of Septin Filament Formation and Dissociation , http://www.ebi.ac.uk/pdbe/entry/EMD-2505 , Publicly available at Electron Microscopy Data Bank (EMDB).
📊 Figures
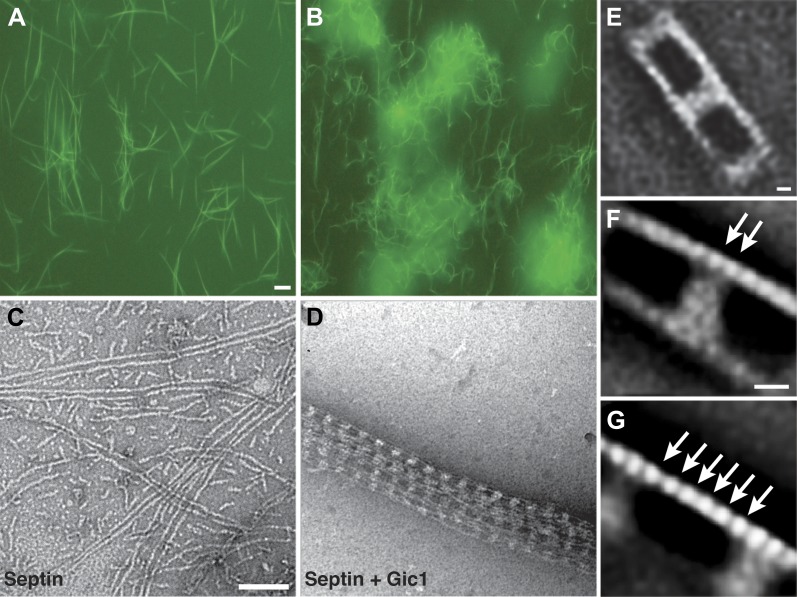
Figure 1.
Gic1 scaffolds septin filaments resulting in long and flexible filament cables.
( A and B ) Yeast septin octamers containing Cdc3-EGFP polymerized by dialysis alone ( A ) or together with Gic1 ( B ) and imaged using fluorescence microscopy. Scale bar, 0.5 u00b5m. ( C and D ) Repr...
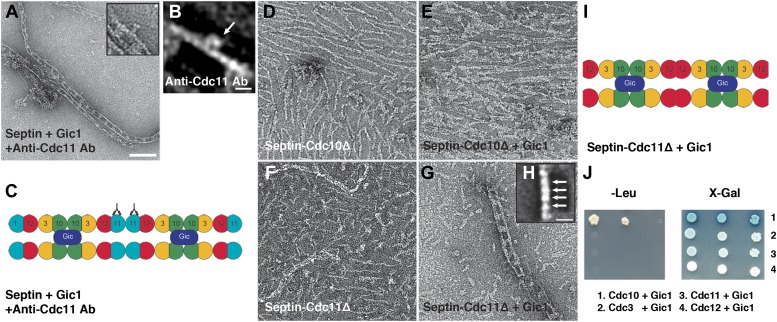
Figure 2.
Gic1 binds specifically to septin Cdc10.
( A and B ) Representative EM image ( A ) and class averages ( B ) of septin-Gic1 complexes labeled with antibody against Cdc11. Arrow indicates the antibodies. The class average in ( B ) contains 15 ...
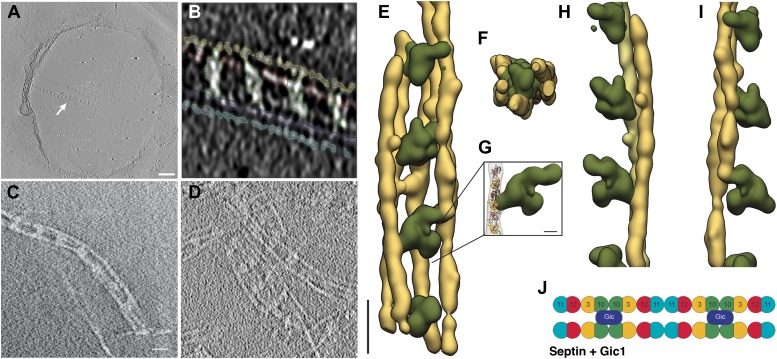
Figure 3.
Cryo-ET of the septin-Gic1 complex.
( A ) Central slice of a cryo electron tomogram (for full tomogram see Videos 1u20133 ). Arrow indicates a septin-Gic1 cable. Scale bar, 200 nm. ( B ) Segmentation of the tomograms. ( C and D ) Extrac...
Video 1.
Video through a cryo electron tomogram of the septin-Gic1 complex with bundles running perpendicular to the beam.
DOI: http://dx.doi.org/10.7554/eLife.01085.006
Video 2.
Video through a cryo electron tomogram of the septin-Gic1 complex with bundles running parallel to the beam (indicated by an arrow).
DOI: http://dx.doi.org/10.7554/eLife.01085.007
Video 3.
Close-up on a septin-Gic1 complex running parallel to the beam (full tomogram see Video 2 ).
DOI: http://dx.doi.org/10.7554/eLife.01085.008
Video 4.
Video of the 3D reconstruction of the septin-Gic1 complex derived from tomograms of vitrified samples.
DOI: http://dx.doi.org/10.7554/eLife.01085.009
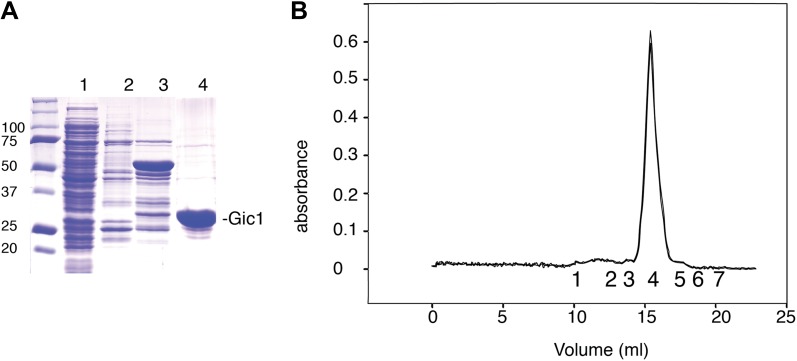
Figure 4.
Purification of Gic1.
( A ) SDS-PAGE of the Gic1(104-314) purification. (1) Flow through Ni-NTA, (2) wash Ni-NTA, (3) elution Ni-NTA, (4) elution from gel filtration after cleavage with prescission protease. ( B ) Gel filt...
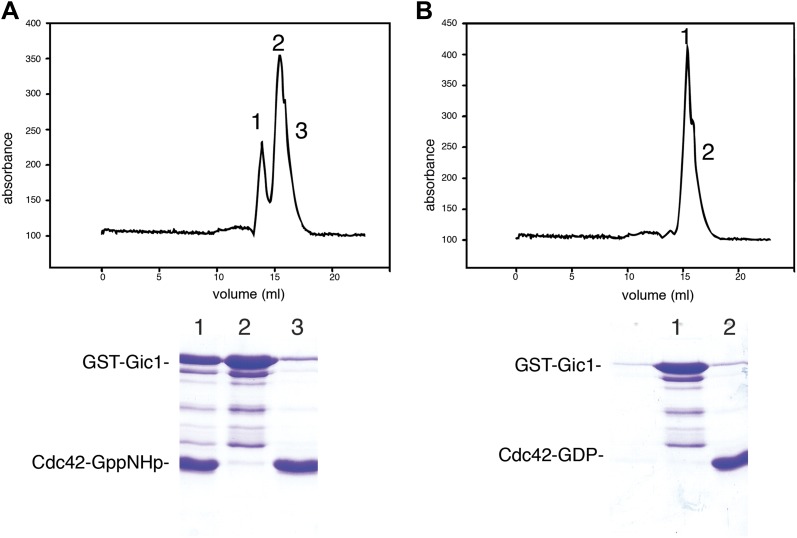
Figure 5.
Cdc42-GppNHp binds specifically to Gic1.
( A and B ) Gel filtration chromatography and SDS-PAGE of Gic1 with Cdc42-GppNHp ( A ) and Cdc42-GDP ( B ), respectively. DOI: http://dx.doi.org/10.7554/eLife.01085.011
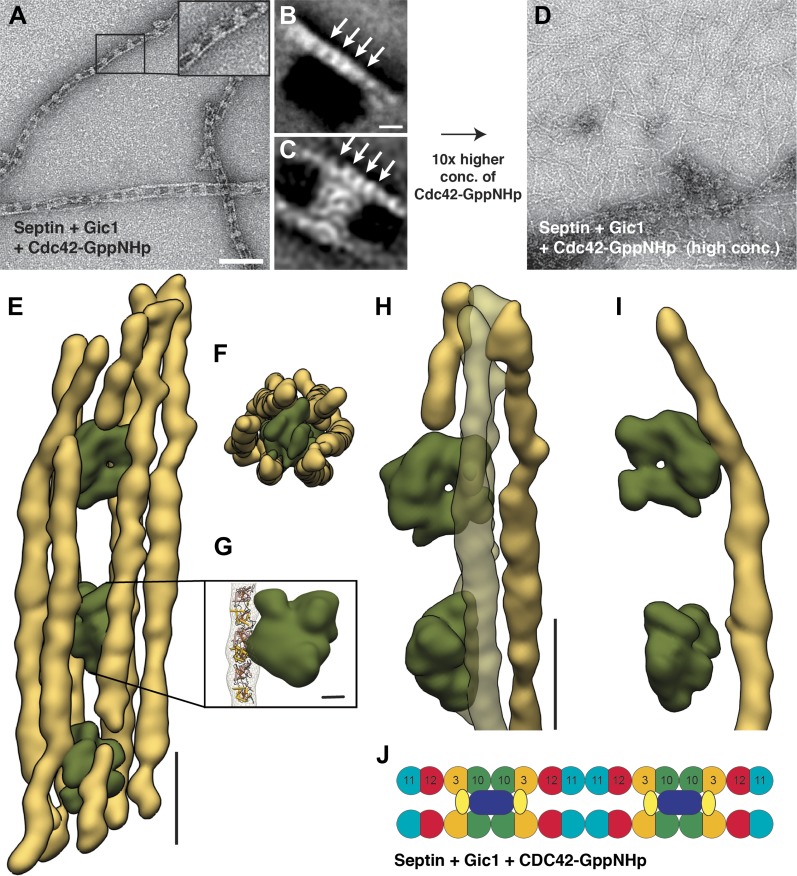
Figure 6.
Cdc42-GppNHp binds specifically to Gic1 and dissociates septin-Gic1 complexes.
( A ) Representative EM image of negatively stained septin-Gic1-Cdc42-GppNHp complexes. The concentration of Gic1 and Cdc42-GppNHp used for filament preparation is 0.5 u00b5M. Scale bar, 100 nm. ( B a...
Video 5.
Video of the 3D reconstruction of the septin-Gic1-Cdc42-GppNHp complex derived from tomograms of vitrified samples.
DOI: http://dx.doi.org/10.7554/eLife.01085.013
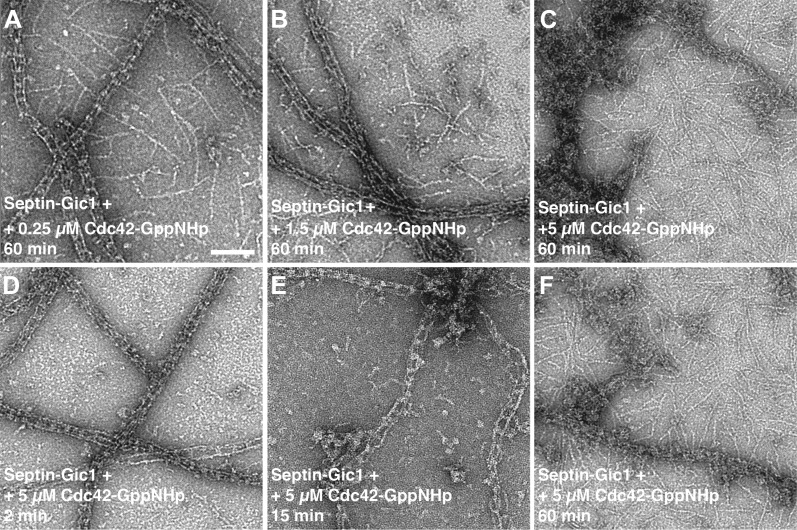
Figure 7.
Time- and concentration-dependent interaction of Cdc42-GppNHp with the septin-Gic1 complex.
( A u2013 C ) Representative EM images of the septin-Gic1 complex incubated for 60 min with ( A ) 0.25 u03bcM, ( B ) 1.5 u03bcM or ( C ) 5 u03bcM of Cdc42-GppNHp. ( D u2013 F ) Representative EM image...
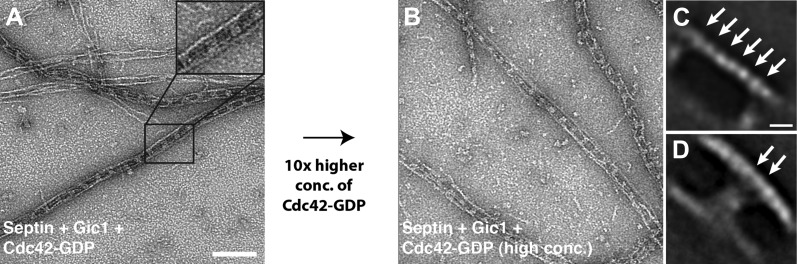
Figure 8.
Cdc42-GDP does not interact with septin-Gic1 complexes.
( A ) Representative EM image of negatively stained septin-Gic1-Cdc42-GDP complexes. Scale bar, 100 nm. ( B ) Same as ( A ) but at 10u00d7 higher concentration of Cdc42-GDP. ( C and D ) Representative...
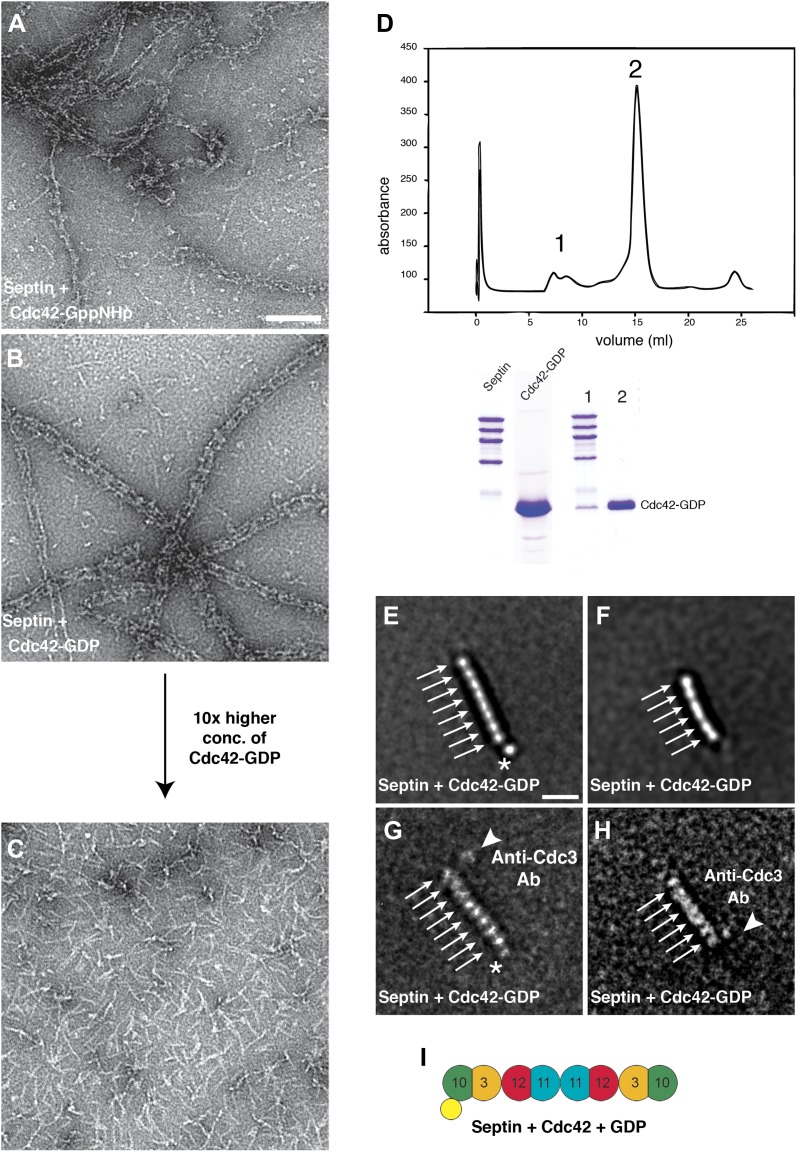
Figure 9.
Cdc42-GDP binds specifically to Cdc10 and dissociates septin filaments.
( A ) Representative EM image of negatively stained septin complexes incubated with Cdc42-GppNHp. Scale bar, 100 nm. ( B ) Representative EM image of negatively stained septin-Cdc42-GDP-complexes. ( C...
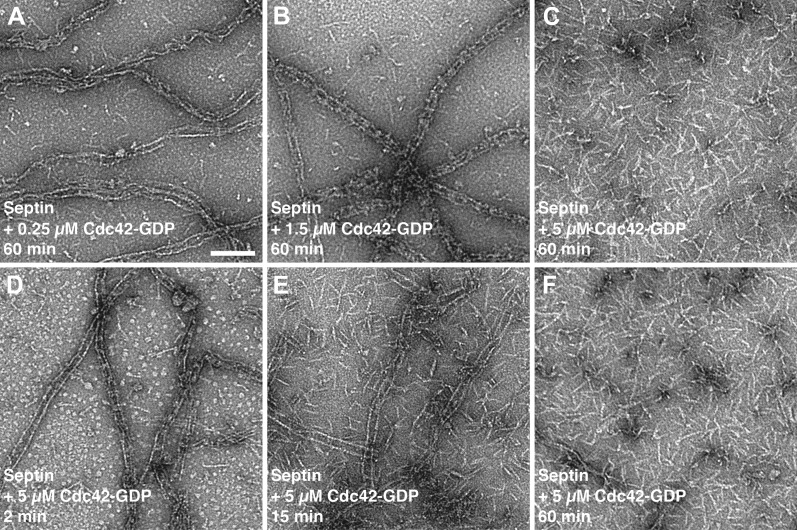
Figure 10.
Time- and concentration-dependent interaction of Cdc42-GDP with septin filaments.
( A u2013 C ) Representative EM images of septin filaments incubated for 60 min with ( A ) 0.25 u03bcM, ( B ) 1.5 u03bcM or ( C ) 5 u03bcM of Cdc42-GDP. ( D u2013 E ) Representative EM images of septi...
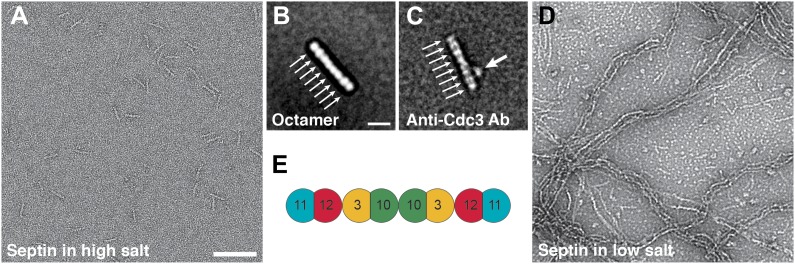
Figure 11.
Septin polymerization depends on the ionic strength.
( A and B ) Representative EM images and class averages of septin complexes at high-salt (500 mM NaCl) labeled with antibody against Cdc3 ( C ) and low-salt (100 mM NaCl) ( D ) conditions. Arrows indi...
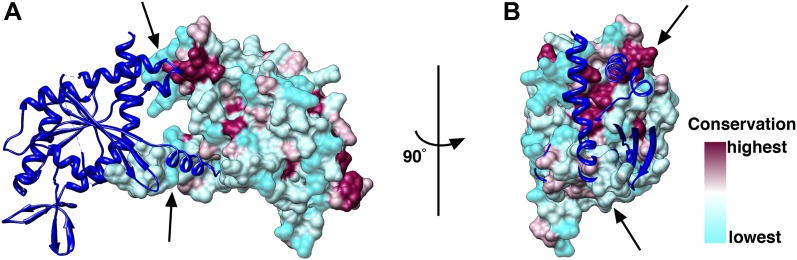
Figure 12.
Conservation of the N/C interface between Cdc3, Cdc10, Cdc11 and Cdc12.
( A and B ) Side ( A ) and end-on views ( B ) of the N/C interface between two Cdc10 septins. Homology models of Cdc3, Cdc10, Cdc11 and Cdc12 using the SEPT2 structure (PDB 2QA5 ) as reference were ca...
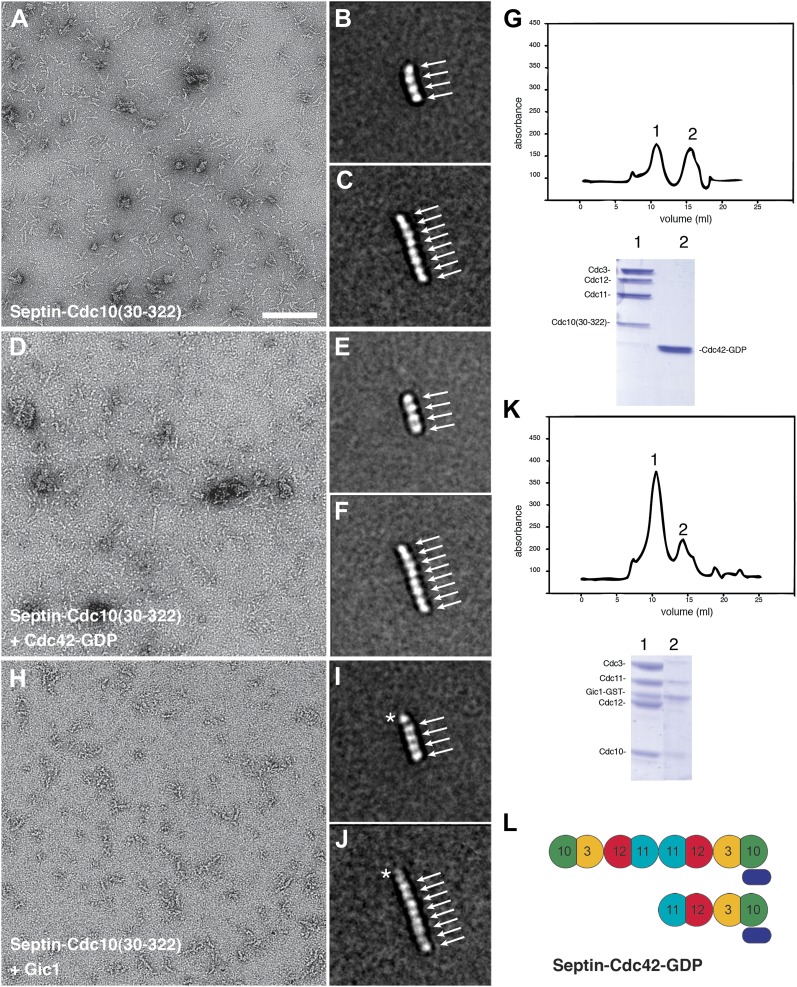
Figure 13.
Gic1 but not Cdc42-GDP binds to polymerization impaired septin complexes.
( A u2013 C ) Representative EM image and class averages of polymerization-impaired septin complexes containing Cdc10(30-322). Scale bars, 100 nm in ( A ) and 10 nm in ( B ). ( D u2013 F ) Representat...
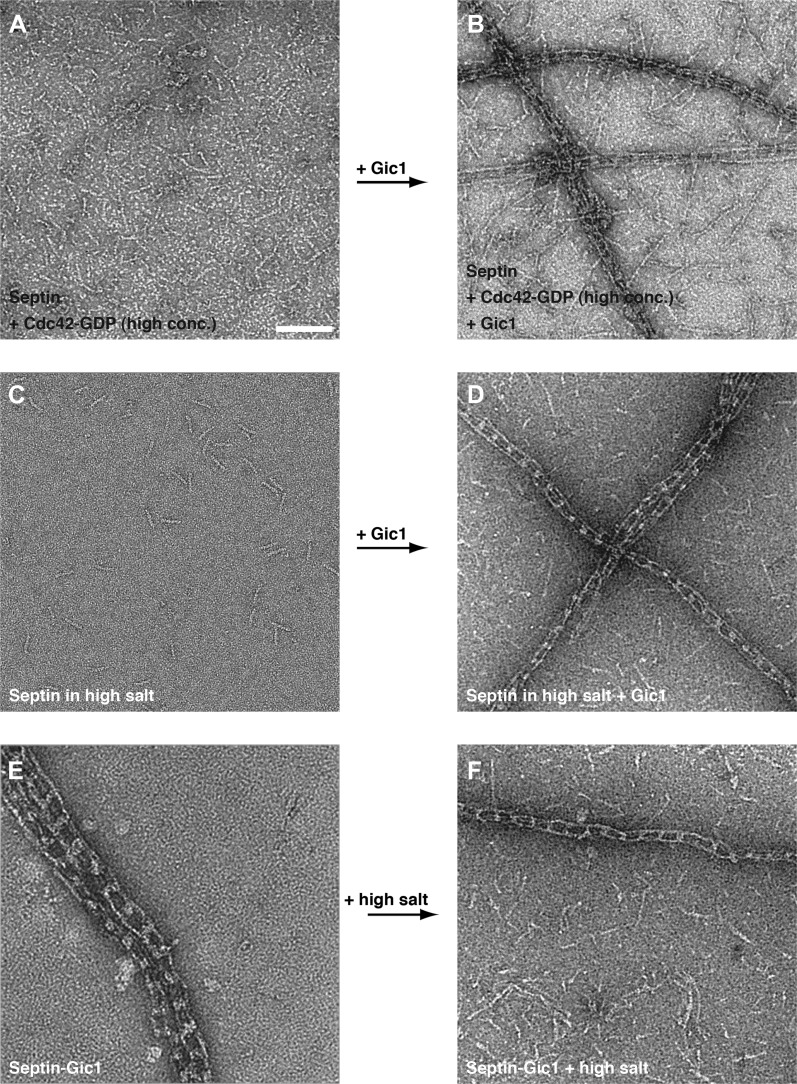
Figure 14.
Gic1 stabilizes septin filaments.
( Au2013D ) Representative EM images of septin-Cdc42-GDP complexes and septin octamers in high-salt buffer before ( A and C ) and after incubation with Gic1 ( B and D ), respectively. Scale bar, 100 n...
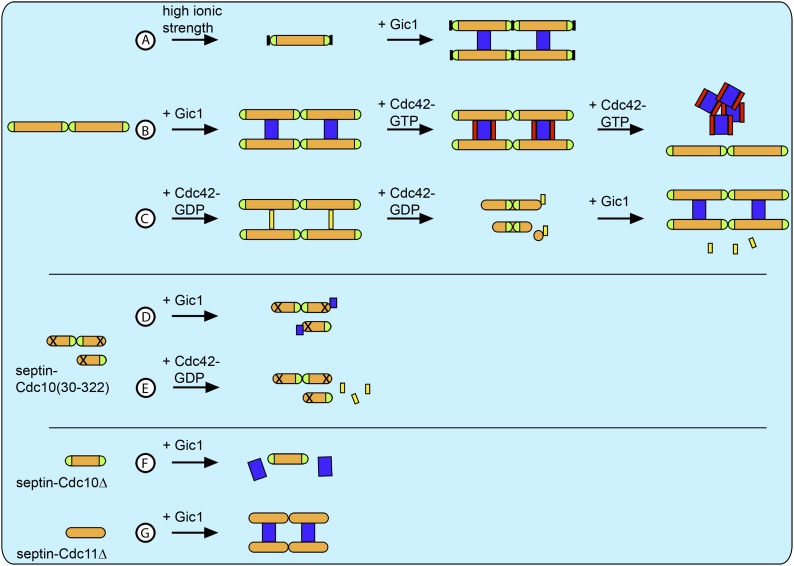
Figure 15.
Schematic overview of all results.
( A ) At high ionic strength septin filaments disassemble into octamers ( Figure 11 ). However, when Gic1 is added, septin-Gic1 filament cables are formed even at high-salt concentrations ( Figure 14 ...
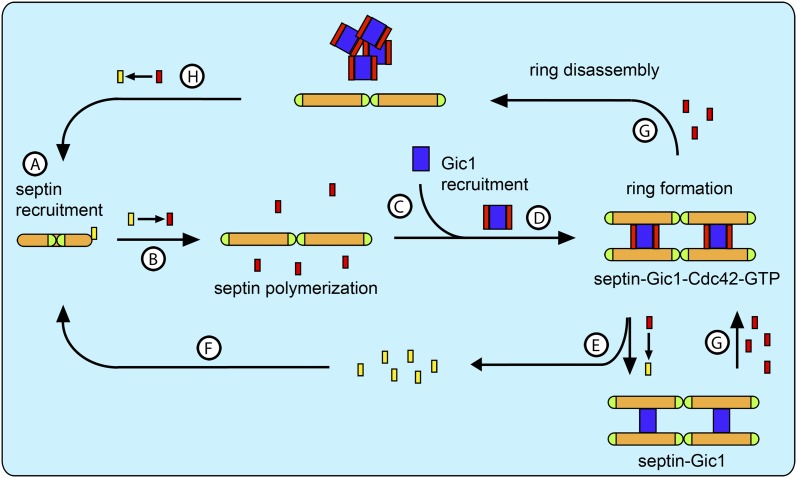
Figure 16.
Model for septin recruitment, ring formation and disassembly.
( A ) Cdc42-GDP recruits septin complexes to the bud site. ( B ) At the bud site Cdc24 catalyzes the nucleotide exchange of Cdc42, which recruits its effector Gic1. ( C ) Septins polymerize. ( D ) Gic...
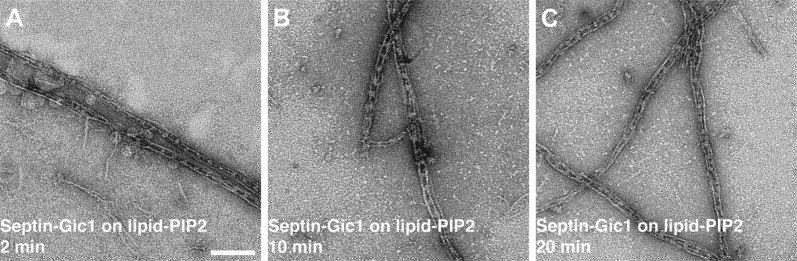
Figure 17.
Septin-Gic1 complexes immobilized on a PIP2-containing lipid monolayer.
( A u2013 C ) Representative EM image of negatively stained septin-Gic1 complexes immobilized on a PIP2-containing monolayer. Scale bar, 100 nm. DOI: http://dx.doi.org/10.7554/eLife.01085.024
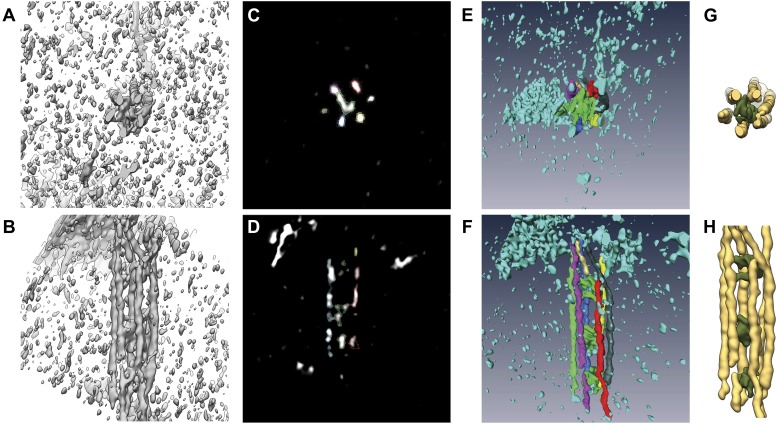
Figure 18.
Processing of subtomograms.
( A and B ) Top and side view of a representative raw subtomogram filtered to 30 u00c5, respectively. ( C and D ) Segmentation in Amira ( Stalling et al., 2005 ). Top and side view of representative s...
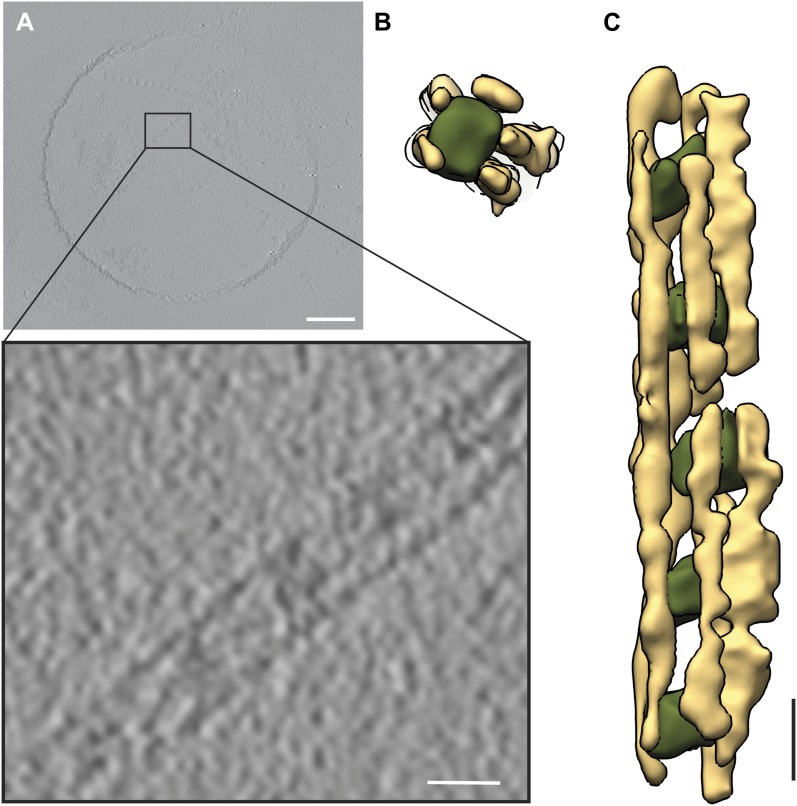
Figure 19.
Tomography of septin-Gic1-Cdc42 complexes running parallel to the tilt-axis.
( A ) Central slice of representative tomogram of septin-Gic1-Cdc42 complexes. A railroad-like complex running parallel to the tilt axis was extracted (see inset). Scale bars, 200 nm. ( B and C ) Top ...
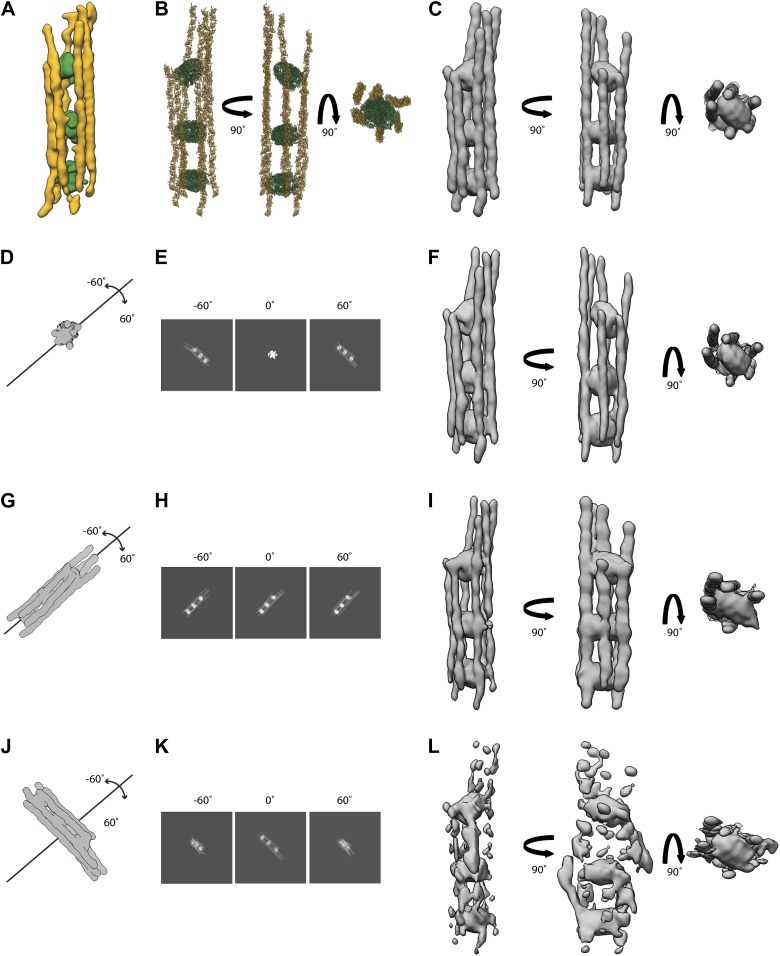
Figure 20.
Simulations of electron tomograms of septin-Gic1-Cdc42-GppNHp complexes.
( A ) Side view of a septin-Gic1-Cdc42-GppNHp subtomogram. The septin filaments and Gic1-Cdc42-GppNHp cross-bridges are depicted in gold and green, respectively. ( B ) Model of a septin-Gic1-Cdc42-Gpp...
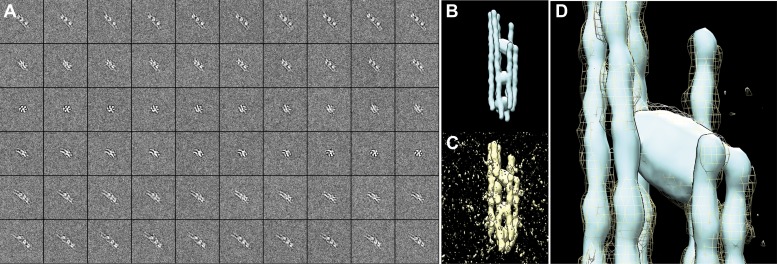
Figure 21.
Electron tomogram simulation of septin-Gic1-Cdc42-GppNHp with CTF and noise added.
( A ) Projections of the model shown in ( B ) in the range of u00b160u00b0 in 2u00b0 increments, after applying the CTF at a defocus of 4 u00b5m and addition of noise. Note that at 0u00b0, the long ax...
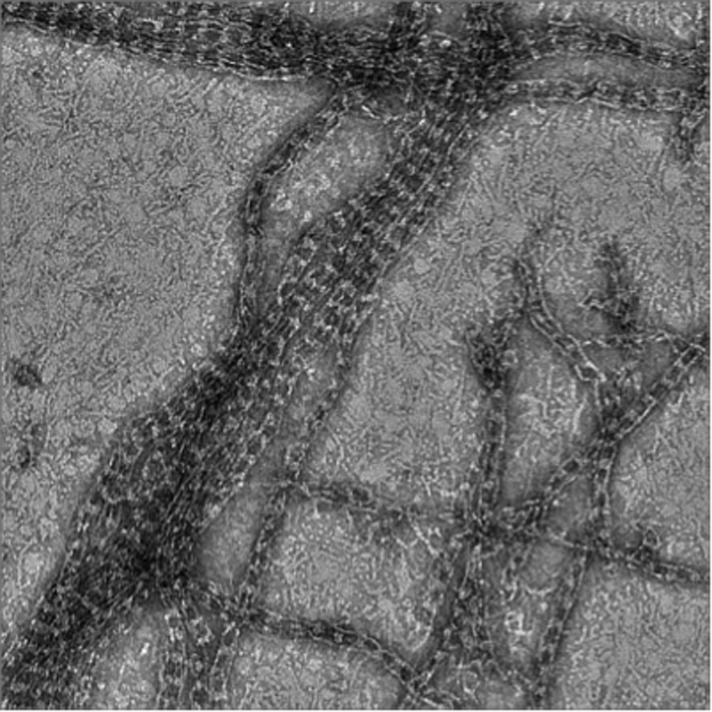
Author response image 1.
Septin-Gic1-GST complexes.
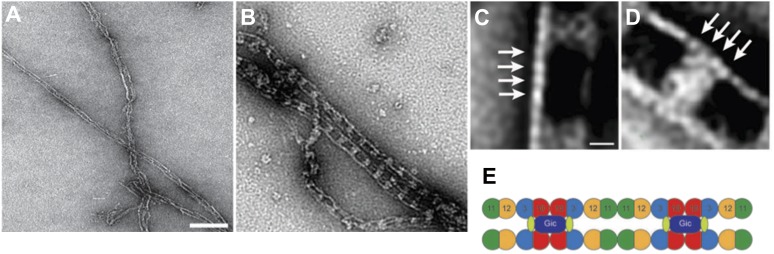
Author response image 2.
Complexes between Gic1 and septin filaments containing Cdc3-EGFP.
(A-B) Representative EM images of negatively stained septin filaments containing Cdc3-EGFP polymerized by dialysis alone (A) or together with Gic1 (B) . Scale bar, 100 nm. (C-D) Representative class a...
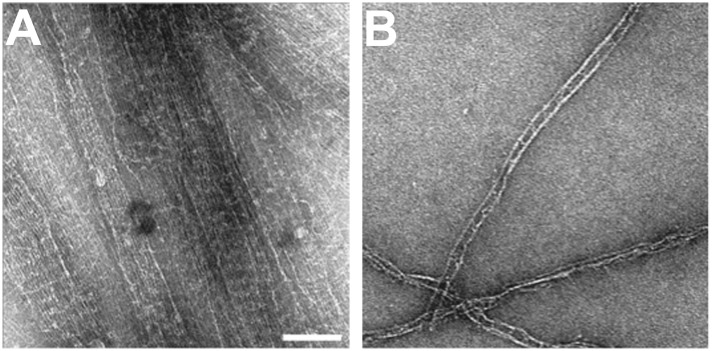
Author response image 3.
Cross-bridges between bare septin filaments.
(A) Very high concentration of septin filaments. (B) Low concentration of septin filaments. Note, due to negative staining the thin cross-bridges between bare septin filaments mediated by the C-termin...
Figure images are served from the NIH/NLM PubMed Central Open Access Subset or Europe PMC; copyright remains with the publishers and authors.
💬 Discussion
0 commentsNo comments yet. Be the first to start a discussion!
Leave a Comment