Abstract
In mammals, megakaryocytes (MKs) in the bone marrow (BM) produce blood platelets, required for hemostasis and thrombosis. MKs originate from hematopoietic stem cells and are thought to migrate from an endosteal niche towards the vascular sinusoids during their maturation. Through imaging of MKs in the intact BM, here we show that MKs can be found within the entire BM, without a bias towards bone-distant regions. By combining in vivo two-photon microscopy and in situ light-sheet fluorescence microscopy with computational simulations, we reveal surprisingly slow MK migration, limited intervascular space, and a vessel-biased MK pool. These data challenge the current thrombopoiesis model of MK migration and support a modified model, where MKs at sinusoids are replenished by sinusoidal precursors rather than cells from a distant periostic niche. As MKs do not need to migrate to reach the vessel, therapies to increase MK numbers might be sufficient to raise platelet counts.Megakaryocyte maturation is thought to occur as the cells migrate from a vessel-distant (endosteal) niche to the vessel within the bone. Here, the authors show that megakaryocytes represent largely sessile cells in close contact with the vasculature and homogeneously distributed in the bone marrow.
🔬 Techniques
🔭 Microscopes
💻 Software
✨ Fluorophores
🧪 Sample Preparation
🔬 Cell Lines
🏭 Microscope Brands
🧪 Reagent Suppliers
🔴 Lasers
📷 Detectors
🔎 Objectives
🎨 Filters
💻 Software Details
🏛️ Research Organizations (ROR)
Affiliated research institutions:
📋 Methods
Mice
All animal experiments were approved by the district government of Lower Frankonia (Bezirksregierung Unterfranken). For all experiments, 8–12 week old male and female mice (equal distribution in both groups) were used. C57BL/6JRj mice were obtained from Janvier Labs. Mice lacking talin1 specifically in MKs and platelets ( Tln fl/fl, PF4-Cre ; on a C57BL/6J background) have been described previously 32 ; Cre-negative litter mates served as control animals. For the EdU treatment, each mouse (~30 g) was daily fed with 25 mg EdU embedded in glucose-agarose cubes for 10 days prior to platelet depletion and subsequently until the mice were euthanized. These experiments were performed according to institutional guidelines by the district government of Berlin, Germany.
Antibodies and reagents
Anesthetic drugs (medetomidine (Pfizer, Karlsruhe, Germany), midazolam (Roche, Grenzach-Wyhlen, Germany) and fentanyl (Janssen—Cilag, Neuss, Germany)) were used according to the local regulations. Mice were bled in high-molecular-weight heparin (Ratiopharm, Ulm, Germany). Mice were further treated with Plerixafor (AMD3100, Selleckchem, Munich, Germany; 5 mg/kg bodyweight) or SRP4388 (SDF1 alpha, Sigma-Aldrich, Schnelldorf, Germany; 16 µg/kg bodyweight). Antibodies were fluorescently labeled using protein labeling kits (Alexa Fluor 488/546/594/647/750, Life Technologies, Darmstadt, Germany). Anti-CD105 antibody (BioLegend, San Diego, CA, USA) or tetramethylrhodamine dextran (2 MDa; Life Technologies, Darmstadt, Germany) were used for BM vasculature staining. All other antibodies were generated and modified in our laboratory as previously described 19 Platelet depletion Thrombocytopenia was induced in C57BL/6JRj WT mice by intravenous injection of rat anti- GPIbα (CD42b; Emfret Analytics, Eibelstadt, Germany; 2.0 μg/g body weight). Peripheral platelet counts were determined using a fully automated hematology analyzer and additionally by flow cytometry. Cryo-sections Femora and sterna of male and female mice age 8–12 weeks were isolated, fixed with 4% PFA (AppliChem GmbH, Darmstadt, Germany) (AppliChem) in 5 mM sucrose in phosphate buffered saline (PBS), transferred into 10% sucrose in PBS and dehydrated using a graded sucrose series (20%, 30%). Subsequently, the samples were embedded in SCEM medium (Section Lab, Hiroshima, Japan), snap-frozen in liquid nitrogen and stored at −80 °C. 10 µm-thick cryosections were generated according to the Kawamoto protocol 13 at a Leica CM1900 cryotom (Leica, Mannheim, Germany). For EdU-stainings, sections were rehydrated 20 min with PBS followed by permeabilization for 30 min with 0.5% Triton X-100. After three 5 min washes with washing buffer (PBS; 0.1% Tween 20; 5% FCS), the click-it reaction was performed for 30 min according to the manufacturer’s instructions (Click-iT ® EdU Alexa Fluor ® 647 Imaging Kit, Thermo Fisher). MKs were stained with anti-CD41-FITC antibody (f.c. 5 µg/ml; Becton Dickinson, Franklin Lakes, USA), anti-β1-tubulin antibody (f.c. 10 µg/ml; Sigma-Aldrich, Schnelldorf, Germany), or anti-GPIX (f.c. 5 µg/ml; CD42a) antibody. Secondary antibodies were purchased as conjugates with Alexa Fluor 488/594/647 (f.c. 7 µg/ml; Life Technologies, Darmstadt, Germany). Nuclei were stained with Hoechst33258 (Biomol, Hamburg, Germany) and mounted with Mowiol (Sigma-Aldrich) or 4′,6-diamidine-2′-phenylindole dihydrochloride (DAPI)-containing mounting medium (DAPI Fluoromount-G; Southern Biotech, Birmingham, AL, USA). Staining with antibodies and secondary reagents was performed for 45 min at room temperature (RT). Sections were analyzed by confocal microscopy (Leica TCS-SP5) and processed with the Leica LAS AF software and ImageJ software (NIH). MK number and density were measured in every visual field. Three femur sections from three separate animals were examined. Megakaryocyte adhesion and proplatelet formation Fetal liver cells of wildtype mice were isolated from E14.5 old embryos and cultivated for 3 days at 37 °C and 5% CO 2 . Three hours prior to the enrichment of MKs via a bovine serum albumin (BSA) gradient, the cells were incubated with IgG control antibodies (Emfret Analytics, Eibelstadt, Germany), anti-α2-integrin (LEN/B 49 ) or anti-GPIX derivatives at 10 μg/mL or remained untreated. To determine proplatelet formation, 17,000 MKs/cm 2 were seeded in triplicates and incubated at 37 °C and 5% CO 2 for 24 h. For the adhesion assay 140,000 MKs were seeded on BSA or human fibrillar collagen I (Corning; 10 µg/cm 2 ) coated coverslips (12 mm diameter) and incubated for 4 h at 37 °C and 5% CO 2 . Afterwards the non-adherent cells were removed and the adhered MKs were stained with an FITC conjugated anti-CD41 antibody (f.c. 5 µg/ml; Becton Dickinson, Franklin Lakes, USA) for 1 h before mounting them with DAPI. At least 10 visual fields per cover slip were recorded at a TCS SP8 (Leica) confocal microscope and the surface coverage analyzed with FIJI 50 .
Show full methods section
Mice
All animal experiments were approved by the district government of Lower Frankonia (Bezirksregierung Unterfranken). For all experiments, 8–12 week old male and female mice (equal distribution in both groups) were used. C57BL/6JRj mice were obtained from Janvier Labs. Mice lacking talin1 specifically in MKs and platelets ( Tln fl/fl, PF4-Cre ; on a C57BL/6J background) have been described previously 32 ; Cre-negative litter mates served as control animals. For the EdU treatment, each mouse (~30 g) was daily fed with 25 mg EdU embedded in glucose-agarose cubes for 10 days prior to platelet depletion and subsequently until the mice were euthanized. These experiments were performed according to institutional guidelines by the district government of Berlin, Germany.
Antibodies and reagents
Anesthetic drugs (medetomidine (Pfizer, Karlsruhe, Germany), midazolam (Roche, Grenzach-Wyhlen, Germany) and fentanyl (Janssen—Cilag, Neuss, Germany)) were used according to the local regulations. Mice were bled in high-molecular-weight heparin (Ratiopharm, Ulm, Germany). Mice were further treated with Plerixafor (AMD3100, Selleckchem, Munich, Germany; 5 mg/kg bodyweight) or SRP4388 (SDF1 alpha, Sigma-Aldrich, Schnelldorf, Germany; 16 µg/kg bodyweight). Antibodies were fluorescently labeled using protein labeling kits (Alexa Fluor 488/546/594/647/750, Life Technologies, Darmstadt, Germany). Anti-CD105 antibody (BioLegend, San Diego, CA, USA) or tetramethylrhodamine dextran (2 MDa; Life Technologies, Darmstadt, Germany) were used for BM vasculature staining. All other antibodies were generated and modified in our laboratory as previously described 19 Platelet depletion Thrombocytopenia was induced in C57BL/6JRj WT mice by intravenous injection of rat anti- GPIbα (CD42b; Emfret Analytics, Eibelstadt, Germany; 2.0 μg/g body weight). Peripheral platelet counts were determined using a fully automated hematology analyzer and additionally by flow cytometry. Cryo-sections Femora and sterna of male and female mice age 8–12 weeks were isolated, fixed with 4% PFA (AppliChem GmbH, Darmstadt, Germany) (AppliChem) in 5 mM sucrose in phosphate buffered saline (PBS), transferred into 10% sucrose in PBS and dehydrated using a graded sucrose series (20%, 30%). Subsequently, the samples were embedded in SCEM medium (Section Lab, Hiroshima, Japan), snap-frozen in liquid nitrogen and stored at −80 °C. 10 µm-thick cryosections were generated according to the Kawamoto protocol 13 at a Leica CM1900 cryotom (Leica, Mannheim, Germany). For EdU-stainings, sections were rehydrated 20 min with PBS followed by permeabilization for 30 min with 0.5% Triton X-100. After three 5 min washes with washing buffer (PBS; 0.1% Tween 20; 5% FCS), the click-it reaction was performed for 30 min according to the manufacturer’s instructions (Click-iT ® EdU Alexa Fluor ® 647 Imaging Kit, Thermo Fisher). MKs were stained with anti-CD41-FITC antibody (f.c. 5 µg/ml; Becton Dickinson, Franklin Lakes, USA), anti-β1-tubulin antibody (f.c. 10 µg/ml; Sigma-Aldrich, Schnelldorf, Germany), or anti-GPIX (f.c. 5 µg/ml; CD42a) antibody. Secondary antibodies were purchased as conjugates with Alexa Fluor 488/594/647 (f.c. 7 µg/ml; Life Technologies, Darmstadt, Germany). Nuclei were stained with Hoechst33258 (Biomol, Hamburg, Germany) and mounted with Mowiol (Sigma-Aldrich) or 4′,6-diamidine-2′-phenylindole dihydrochloride (DAPI)-containing mounting medium (DAPI Fluoromount-G; Southern Biotech, Birmingham, AL, USA). Staining with antibodies and secondary reagents was performed for 45 min at room temperature (RT). Sections were analyzed by confocal microscopy (Leica TCS-SP5) and processed with the Leica LAS AF software and ImageJ software (NIH). MK number and density were measured in every visual field. Three femur sections from three separate animals were examined. Megakaryocyte adhesion and proplatelet formation Fetal liver cells of wildtype mice were isolated from E14.5 old embryos and cultivated for 3 days at 37 °C and 5% CO 2 . Three hours prior to the enrichment of MKs via a bovine serum albumin (BSA) gradient, the cells were incubated with IgG control antibodies (Emfret Analytics, Eibelstadt, Germany), anti-α2-integrin (LEN/B 49 ) or anti-GPIX derivatives at 10 μg/mL or remained untreated. To determine proplatelet formation, 17,000 MKs/cm 2 were seeded in triplicates and incubated at 37 °C and 5% CO 2 for 24 h. For the adhesion assay 140,000 MKs were seeded on BSA or human fibrillar collagen I (Corning; 10 µg/cm 2 ) coated coverslips (12 mm diameter) and incubated for 4 h at 37 °C and 5% CO 2 . Afterwards the non-adherent cells were removed and the adhered MKs were stained with an FITC conjugated anti-CD41 antibody (f.c. 5 µg/ml; Becton Dickinson, Franklin Lakes, USA) for 1 h before mounting them with DAPI. At least 10 visual fields per cover slip were recorded at a TCS SP8 (Leica) confocal microscope and the surface coverage analyzed with FIJI 50 .
Multiphoton intravital microscopy
Mice were anesthetized by intraperitoneal injection of medetomidine 0.5 mg/g, midazolam 5 mg/g and fentanyl 0.05 mg/g body weight. A 1-cm incision was made along the midline to expose the frontoparietal skull, while carefully avoiding damage to the bone tissue. The mouse was placed on a custom metal stage equipped with a stereotactic holder to immobilize the head. BM vasculature was visualized by injection of tetramethylrhodamine dextran (8 µg/g body weight) and anti-CD105 Alexa Fluor 546/Alexa Fluor 594 (0.4 µg/g body weight). Platelets and MKs were visualized by injection of Alexa Fluor 488-labeled anti-GPIX derivative (0.6 µg/g body weight). Images were acquired at a frame rate of 12 f/min or 1 f/min on an upright two-photon fluorescence microscope (TriM Scope I multiphoton system, LaVision BioTec, Bielefeld, Germany or TCS SP8 MP, Leica Microsystems, Wetzlar, Germany) equipped with a ×20 water objective with a numerical aperture of 0.95. Emission was detected with HQ535/50-nm and ET605/70-nm filters. A tunable broad-band Ti:Sa laser (Chameleon, Coherent, Dieburg, Germany) was used at 760 nm to capture Alexa Fluor488 and Alexa Fluor 546/Alexa Fluor 594/tetramethylrhodamine dextran fluorescence. FIJI 50 and Imaris ® 8.3.1 (Bitplane, Zürich, Switzerland) were used to generate movies.
Tissue preparation for LSFM
Platelets/MKs and BM vasculature were stained by injecting Alexa Fluor 750-labeled anti-GPIX derivative (0.6 µg/g body weight) and anti-CD105 Alexa Fluor 647 (0.4 µg/g body weight), respectively. Thirty minutes after injection the mice were transcardially perfused with ice-cold PBS to wash out the blood and ice-cold 4% paraformaldehyde (PFA, Sigma-Aldrich, Schnelldorf, Germany (pH 7.2)) to fix the tissues. Sterna, skull, and femora were harvested and stored in 4% PFA for 30 min. Bone samples were washed in PBS and decalcified in 10% ethylenediaminetetraacetic acid (AppliChem, Darmstadt, Germany) for 96 h at 4 °C on a shaker. Samples were then washed in PBS, followed by dehydration in a graded methanol (Sigma-Aldrich) series (50%, 70%, 95%, 100% for 30 min each) at RT and stored at 4 °C overnight. The methanol was replaced stepwise by a clearing solution consisting of one part benzyl alcohol to two parts benzyl benzoate (BABB, Sigma-Aldrich). After incubation in the clearing solution for at least 2 h at RT, tissue specimens became optically transparent and were used for LSFM imaging on the following day.
LSFM setup and data acquisition
Image acquisition of cleared samples was performed in a home-built scanning light-sheet fluorescence microscope similar to previous designs 18 . The specimen was affixed with cyanoacrylate glue (Weicon, Münster, Germany) to a glass micropipette (100 µl, Brand GmbH) that was mounted on a motorized (8CMA06-25/15 Standa, Vilnius, Lithuania) four axis stage (xyz translation (Newport, Darmstadt, Germany) and rotation (Standa). A home-built coverglass chamber filled with BABB solution allowed imaging of the cleared sample immersed in clearing solution. A custom fiber coupled laser combiner (BFI OPTiLAS GmbH, Groebenzell, Germany) with two red laser lines (642 and 730 nm) was used for fluorescence excitation. For collimation, an objective lens (A10/0.25 Hund, Wetzlar, Germany) providing a beam diameter of roughly 3 mm was used. All laser lines were joined via a dichroic beamsplitter (DCLP 660, AHF Analysentechnik, Tübingen, Germany). A galvanometric scanner (6210 H, Cambridge Technology, Bedford, MA, USA) elongated the resulting laser beam with a frequency of 600 Hz before being focused via a theta lens (VISIR f. TCS-MR II, Leica, Mannheim, Germany) to create a virtual light sheet. The focused beam was relayed with a tube lens and an objective lens (EC Plan-Neofluar 5x/0.16 M27, Zeiss, Göttingen, Germany) to the sample. For detection, a HCX APO L20x/0.95 IMM objective (Leica, Wetzlar, Germany) was mounted on a translation stage (Newport) perpendicular to the light sheet. The fluorescence emission was spectrally filtered using a motorized filter wheel (MAC 6000 Filter Wheel Emission TV 60 C 1.0x (D)) with a MAC 6000 Controller (Zeiss, Göttingen, Germany) equipped with the following filters according to the fluorescence of the used fluorescent labels: 491 nm BrightLine HC 525/50 (autofluorescence), 642 nm HQ 697/58 (Alexa Fluor 647), and 730 nm BrightLine HC 785/62 (Alexa Fluor 750) (AHF). The image was generated by an infinity-corrected ×1.3 tube lens ∞/240–340 (098.9001.000, Leica, Wetzlar, Germany) and detected by a sCMOS camera Neo 5.5 (2560 × 2160 pixels, 16.6 mm × 14.0 mm sensor size, 6.5 µm pixel size, Andor, Belfast, UK). Synchronization of the laser illumination, image acquisition, focus correction, and z scanning was controlled by IQ 2.9 software (Andor). Multicolor stacks were generated by imaging the three color channels sequentially in each plane in increments of 2 µm. Images were saved as Tagged Image File Format (TIFF) stacks.
Image analysis Multicolor
LSFM stacks were processed and analyzed by FIJI 50 and Imaris ® 7.7.2 and 8.3.1 (Bitplane AG, Zurich, Switzerland). Data visualization and analysis was performed in three major steps: (i) image preprocessing, (ii) segmentation, (iii) data extraction. Step (i) was performed using either Imaris or FIJI, steps (ii) and (iii) were performed using Imaris ® 7.7.2 and 8.3.1 including the ImarisCell module. Statistical analysis of object positions, numbers, and volumes (MK, vessel, BM), edge-to-edge distance from MK to vessel or bone, and available vessel interspace were performed using Microsoft Excel (ver. 2013, Microsoft Corporation, Redmond, WA, USA), Origin (ver. 8.6, OriginLab Corporation, Northampton, MA, USA), and SPSS Statistics (ver.23, IBM, Ehningen, Germany) and Matlab software (Mathworks, USA). MKs were considered to be vessel-associated MKs if the maximal distance between the MK edge and the vessel was one voxel, where a voxel has the dimensions 0.5 × 0.5 × 2 µm 3 . All other MKs are referred as non-vessel-associated. Bone structures were derived from autofluorescence by using the pixel classification algorithm of the well-established interactive learning and segmentation toolkit ilastik 51 . Bone structures derived from ilastik were exported to Imaris 8.3.1 for segmentation and further analysis. Multi-photon microscopy images were corrected for noise and converted to binary images using FIJI. MKs that did release proplatelets during the observation period were manually excluded prior to the cell tracking analysis. Cell tracking of binary images was performed by Imaris 8.3.1 or with the active contours module of Icy software ( www.icy.bioimageanalysis.org , Institut Pasteur, France), where the software calculated the center of mass of the cells from the binary images for each frame.
Mean square displacement analysis
(MSD) of cell trajectories was performed by using Matlab (Mathworks) and msdanalyzer class 52 . According to the diffusion theory for two-dimensional data, the mean squared displacement is calculated for different time scales and linked to these by 1 documentclass[12pt]{minimal} usepackage{amsmath} usepackage{wasysym} usepackage{amsfonts} usepackage{amssymb} usepackage{amsbsy} usepackage{mathrsfs} usepackage{upgreek} setlength{oddsidemargin}{-69pt} begin{document}$${rm{MSD}} = 4{K_alpha }{t^alpha }$$end{document} MSD = 4 K α t α where t is the time scale, K α the time scale dependent diffusion coefficient, and α the exponential coefficient of movement. While K α lacks a distinct physical meaning, exponent α defines different motion types as: α = 1, for Brownian diffusion α < 1, for subdiffusion or hindered diffusion α > 1, for superdiffusion or enhanced diffusion Computer simulations Simulations were performed with a self-written algorithm in Matlab software (Mathworks) using volume image stacks of mouse sterna acquired by LSFM and processed with Bitplane Imaris® 7.7.2 software (see above). For random simulation (SimR), MKs were randomly placed in the 3D BM space. For NVA random simulation (SimNVA), BM vasculature and vessel associated MKs served as space-limiting scaffold. The remaining MKs were randomly placed into the intervascular region without vessel or cell contact. The MK-vessel distances were calculated using vessel distance transformation maps. For both types of simulations, the number and size distribution of MKs in the pool were matched to the experimentally estimated values. The presented results are mean ± SD from at least three independent experiments per group, if not stated otherwise.
Statistical analysis
Differences between two groups were statistically analyzed using the Mann–Whitney U test and difference between three or more groups were analyzed using one-way ANOVA. P -values > 0.05 were considered as not significant ( p > 0.05). P -values < 0.05 were considered statistically significant with: * p < 0.05, ** p < 0.01, *** p < 0.001.
Data availability
The datasets generated and/or analyzed in the current study, as well as the source code of the computational simulations are available from the corresponding authors on reasonable request.
Electronic supplementary material Supplementary Information Supplementary Movie 1 Supplementary Movie 2 Supplementary Movie 3 Supplementary Movie 4 Supplementary Movie 5 Supplementary Movie 6 Supplementary Movie 7 Supplementary Movie 8 Supplementary Movie 9 Supplementary Movie 10 Peer Review File
📊 Figures
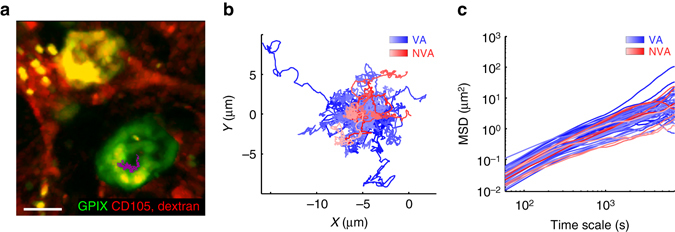
Fig. 1
MK tracking reveals low motility of MKs in vivo. a A representative centroid track ( magenta ) from a MK ( green , scale bar 15u2009u00b5m) monitored for over 3u2009h. Frame rate: 1u2009f/min b Trajec...
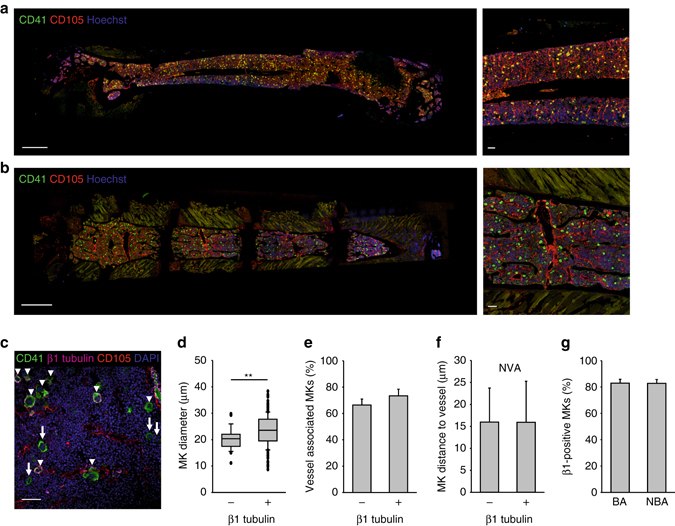
Fig. 2
MKs are largely sessile and distributed within the BM. Distribution of megakaryocytes (MKs, CD41 + , green ) in cryo-sections of femur a and sternum b showing vessels (CD105 + , red ) and nuclei (Hoec...
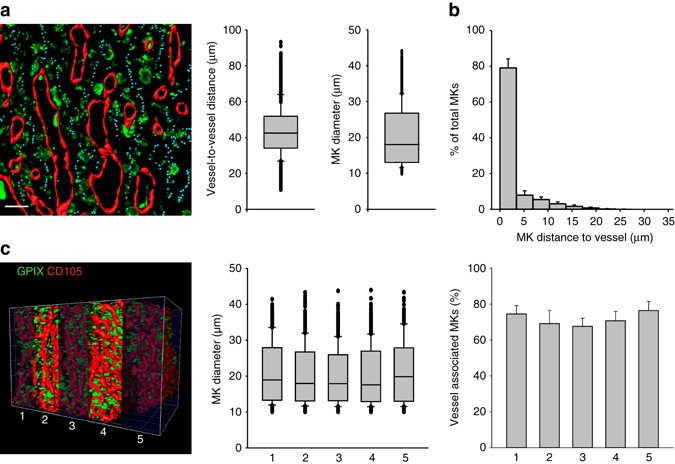
Fig. 3
The intervascular space limits MK distribution within the BM. a Reconstruction of sternal BM revealed a dense blood vessel network ( red , CD105) with limited space for MKs ( green , GPIX) shown by ve...
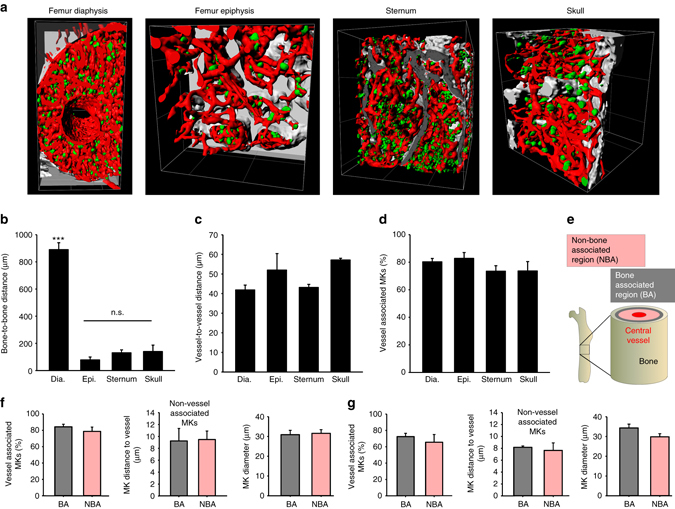
Fig. 4
The inter-bone space is fully vascularized and contains MKs. a Reconstruction of BM along with bone structures for different types of bone revealed that the entire BM contains MKs ( green , GPIX) and ...
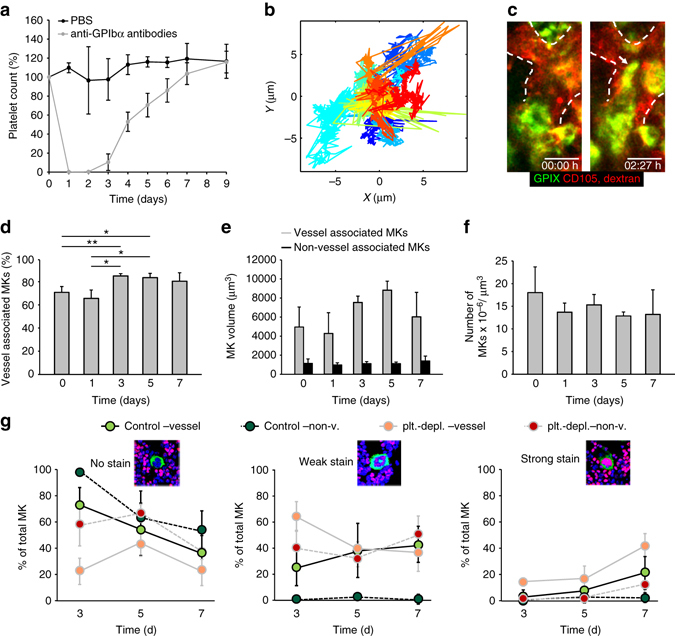
Fig. 5
Platelet depletion does not affect MK distribution or migration within the BM. a Mice displayed severe, but reversible thrombocytopenia after platelets were depleted by anti-GPIbu03b1 antibodies (five...
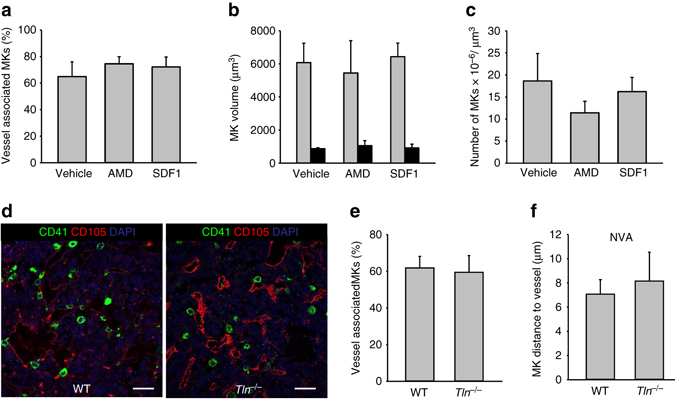
Fig. 6
CXCR4-blockade or talin-deficiency does not affect MK distribution within the BM. Treatment with 5u2009mg/kg bodyweight AMD3100 (AMD) or 16u2009u00b5g/kg bodyweight SDF1 did not modify MK localization...
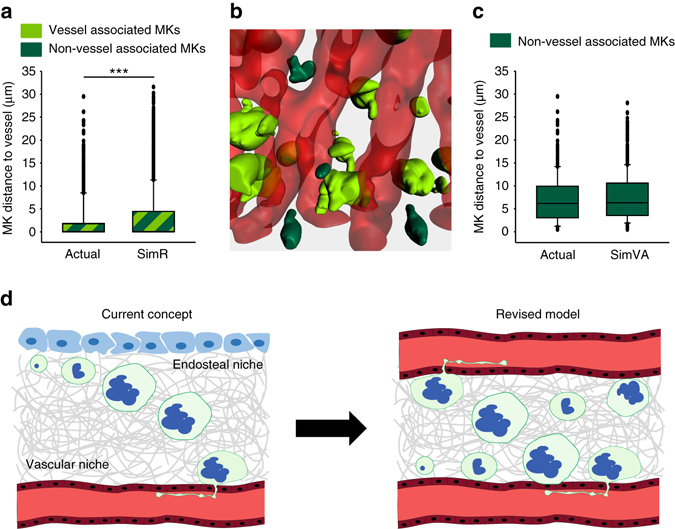
Fig. 7
MKs display a vessel-biased random distribution. MK distribution was simulated ( n =u20096 simulations) using blood vessels ( red ) and MKs ( green ) derived from sternal BM imaging data. a The averag...
Figure images are served from the NIH/NLM PubMed Central Open Access Subset or Europe PMC; copyright remains with the publishers and authors.
💬 Discussion
0 commentsNo comments yet. Be the first to start a discussion!
Leave a Comment