Abstract
Regulatory T cells are crucial in controlling various functions of effector T cells during experimental autoimmune encephalomyelitis. While regulatory T cells are reported to exert their immunomodulatory effects in the peripheral immune organs, their role within the central nervous system (CNS) during experimental autoimmune encephalomyelitis is unclear. Here, by combining a selectively timed regulatory T cells depletion with 2-photon microscopy, we report that regulatory T cells exercise their dynamic control over effector T cells in the CNS. Acute depletion of regulatory T cells exacerbated experimental autoimmune encephalomyelitis severity which was accompanied by increased pro-inflammatory cytokine production and proliferation of effector T cells. Intravital microscopy revealed that, in the absence of regulatory T cells, the velocity of effector T cells was decreased with simultaneous increase in the proportion of stationary phase cells in the CNS. Based on these data, we conclude that regulatory T cells mediate recovery from experimental autoimmune encephalomyelitis by controlling cytokine production, proliferation and motility of effector T cells in the CNS.
🔬 Techniques
🔭 Microscopes
💻 Software
✨ Fluorophores
🧪 Sample Preparation
🔬 Cell Lines
🏭 Microscope Brands
🧪 Reagent Suppliers
📷 Detectors
💻 Software Details
🏛️ Research Organizations (ROR)
Affiliated research institutions:
📊 Figures
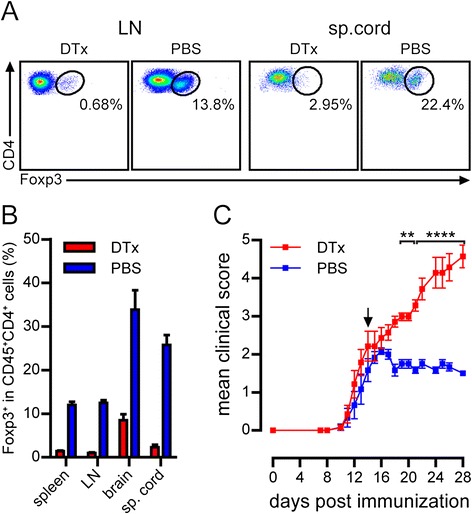
Figure 1
Exacerbation of EAE after acute T reg depletion at the peak of the disease. Representative flow cytometry plots (A) or mean frequency (u00b1 SEM) of Foxp3 + in CD45 + CD4 + T cells (B) isolated from i...
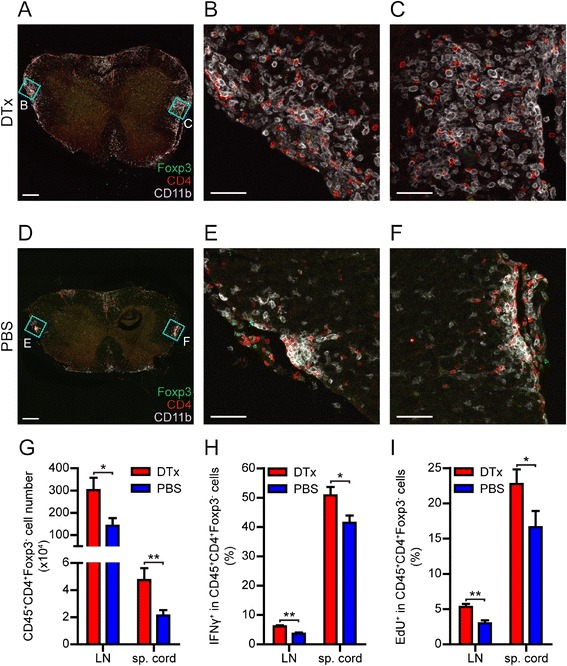
Figure 2
Increased numbers and enhanced proliferation of T eff in T reg -depleted mice. (A) , (D) Representative panoramic pictures of spinal cord cryosections from mice treated with DTx (A) or PBS (D) stained...
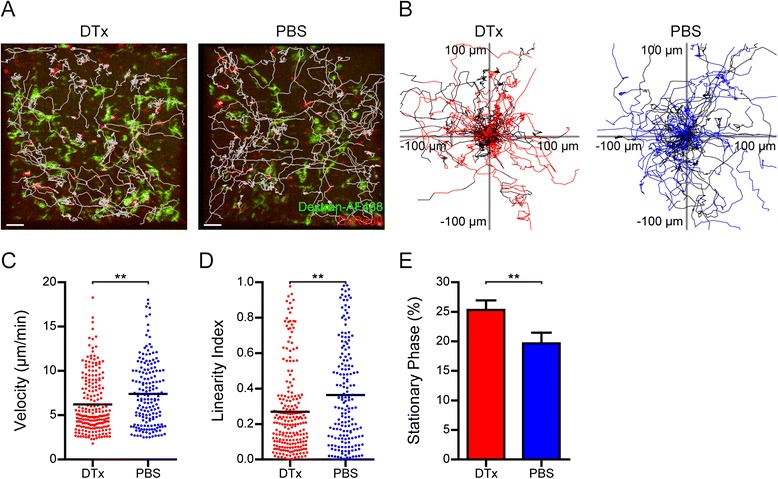
Figure 3
T eff dynamics in the CNS of T reg -depleted mice. Intravital two-photon imaging was performed in the spinal cord meninges of T-Red x DEREG mice two days after DTx or PBS treatment. (A) Trajectories (...
Figure images are served from the NIH/NLM PubMed Central Open Access Subset or Europe PMC; copyright remains with the publishers and authors.
💬 Discussion
0 commentsNo comments yet. Be the first to start a discussion!
Leave a Comment